- HOME
- Free sales tracker template for small businesses: Download and customize in Zoho Sheet
Free sales tracker template for small businesses: Download and customize in Zoho Sheet
- Last Updated : May 8, 2026
- 1.0K Views
- 4 Min Read
![]()
Looking for a ready-to-use sales tracking template? Download the free sales tracker template and start tracking your sales immediately.
If you’d rather learn how to build one yourself before using a template, this blog walks you through the entire process step by step—from setting up your spreadsheet and organizing sales data to tracking expenses and profits. Once you understand how everything works, you can then customize the tracker to match your business workflow and manage your sales more effectively.
Many first-time sellers and small and medium business (SMB) owners find sales tracking software too complex, expensive, and time-consuming to set up. On top of that, teams are often forced to change their workflows to match the tool—when it should be the other way around.
When you're just starting out, you need something simple. A tool that's affordable and flexible. One that helps you track your sales, expenses, inventory, profits, and even trends over time. That's when spreadsheets come in. They are powerful yet simple to handle even for a beginner.
In this blog, I’ll walk you through five simple steps to create a fully functional sales tracker in your spreadsheet using Zoho Sheet. Zoho Sheet is a cloud-based spreadsheet application from Zoho's Office Suite that allows you to create, edit and collaborate on spreadsheets for free. It's also available on iOS and Android.
Overview
Here, I have set up multiple sheets to organize my sales data. Each sheet in this tracker is linked to the main dashboard that helps me track my sales data effectively. Maintaining separate sheets that connect with the dashboard helps understand sales data better and spot trends in real time.
- Order details: This sheet contains the order details, including Order ID, Profits, and Revenue made.
- Inventory details: In the inventory sheet, I added all my product details and availability, which keeps my team in sync with what's needed and what's available.
- Sales tracker dashboard: This sheet consolidates all my data in one place to offer a visual overview that helps me track my orders.
Build an online sales tracker with me in five simple steps :
Step 1: Create your spreadsheet
I opened a blank sheet and named it "Sales Tracker".
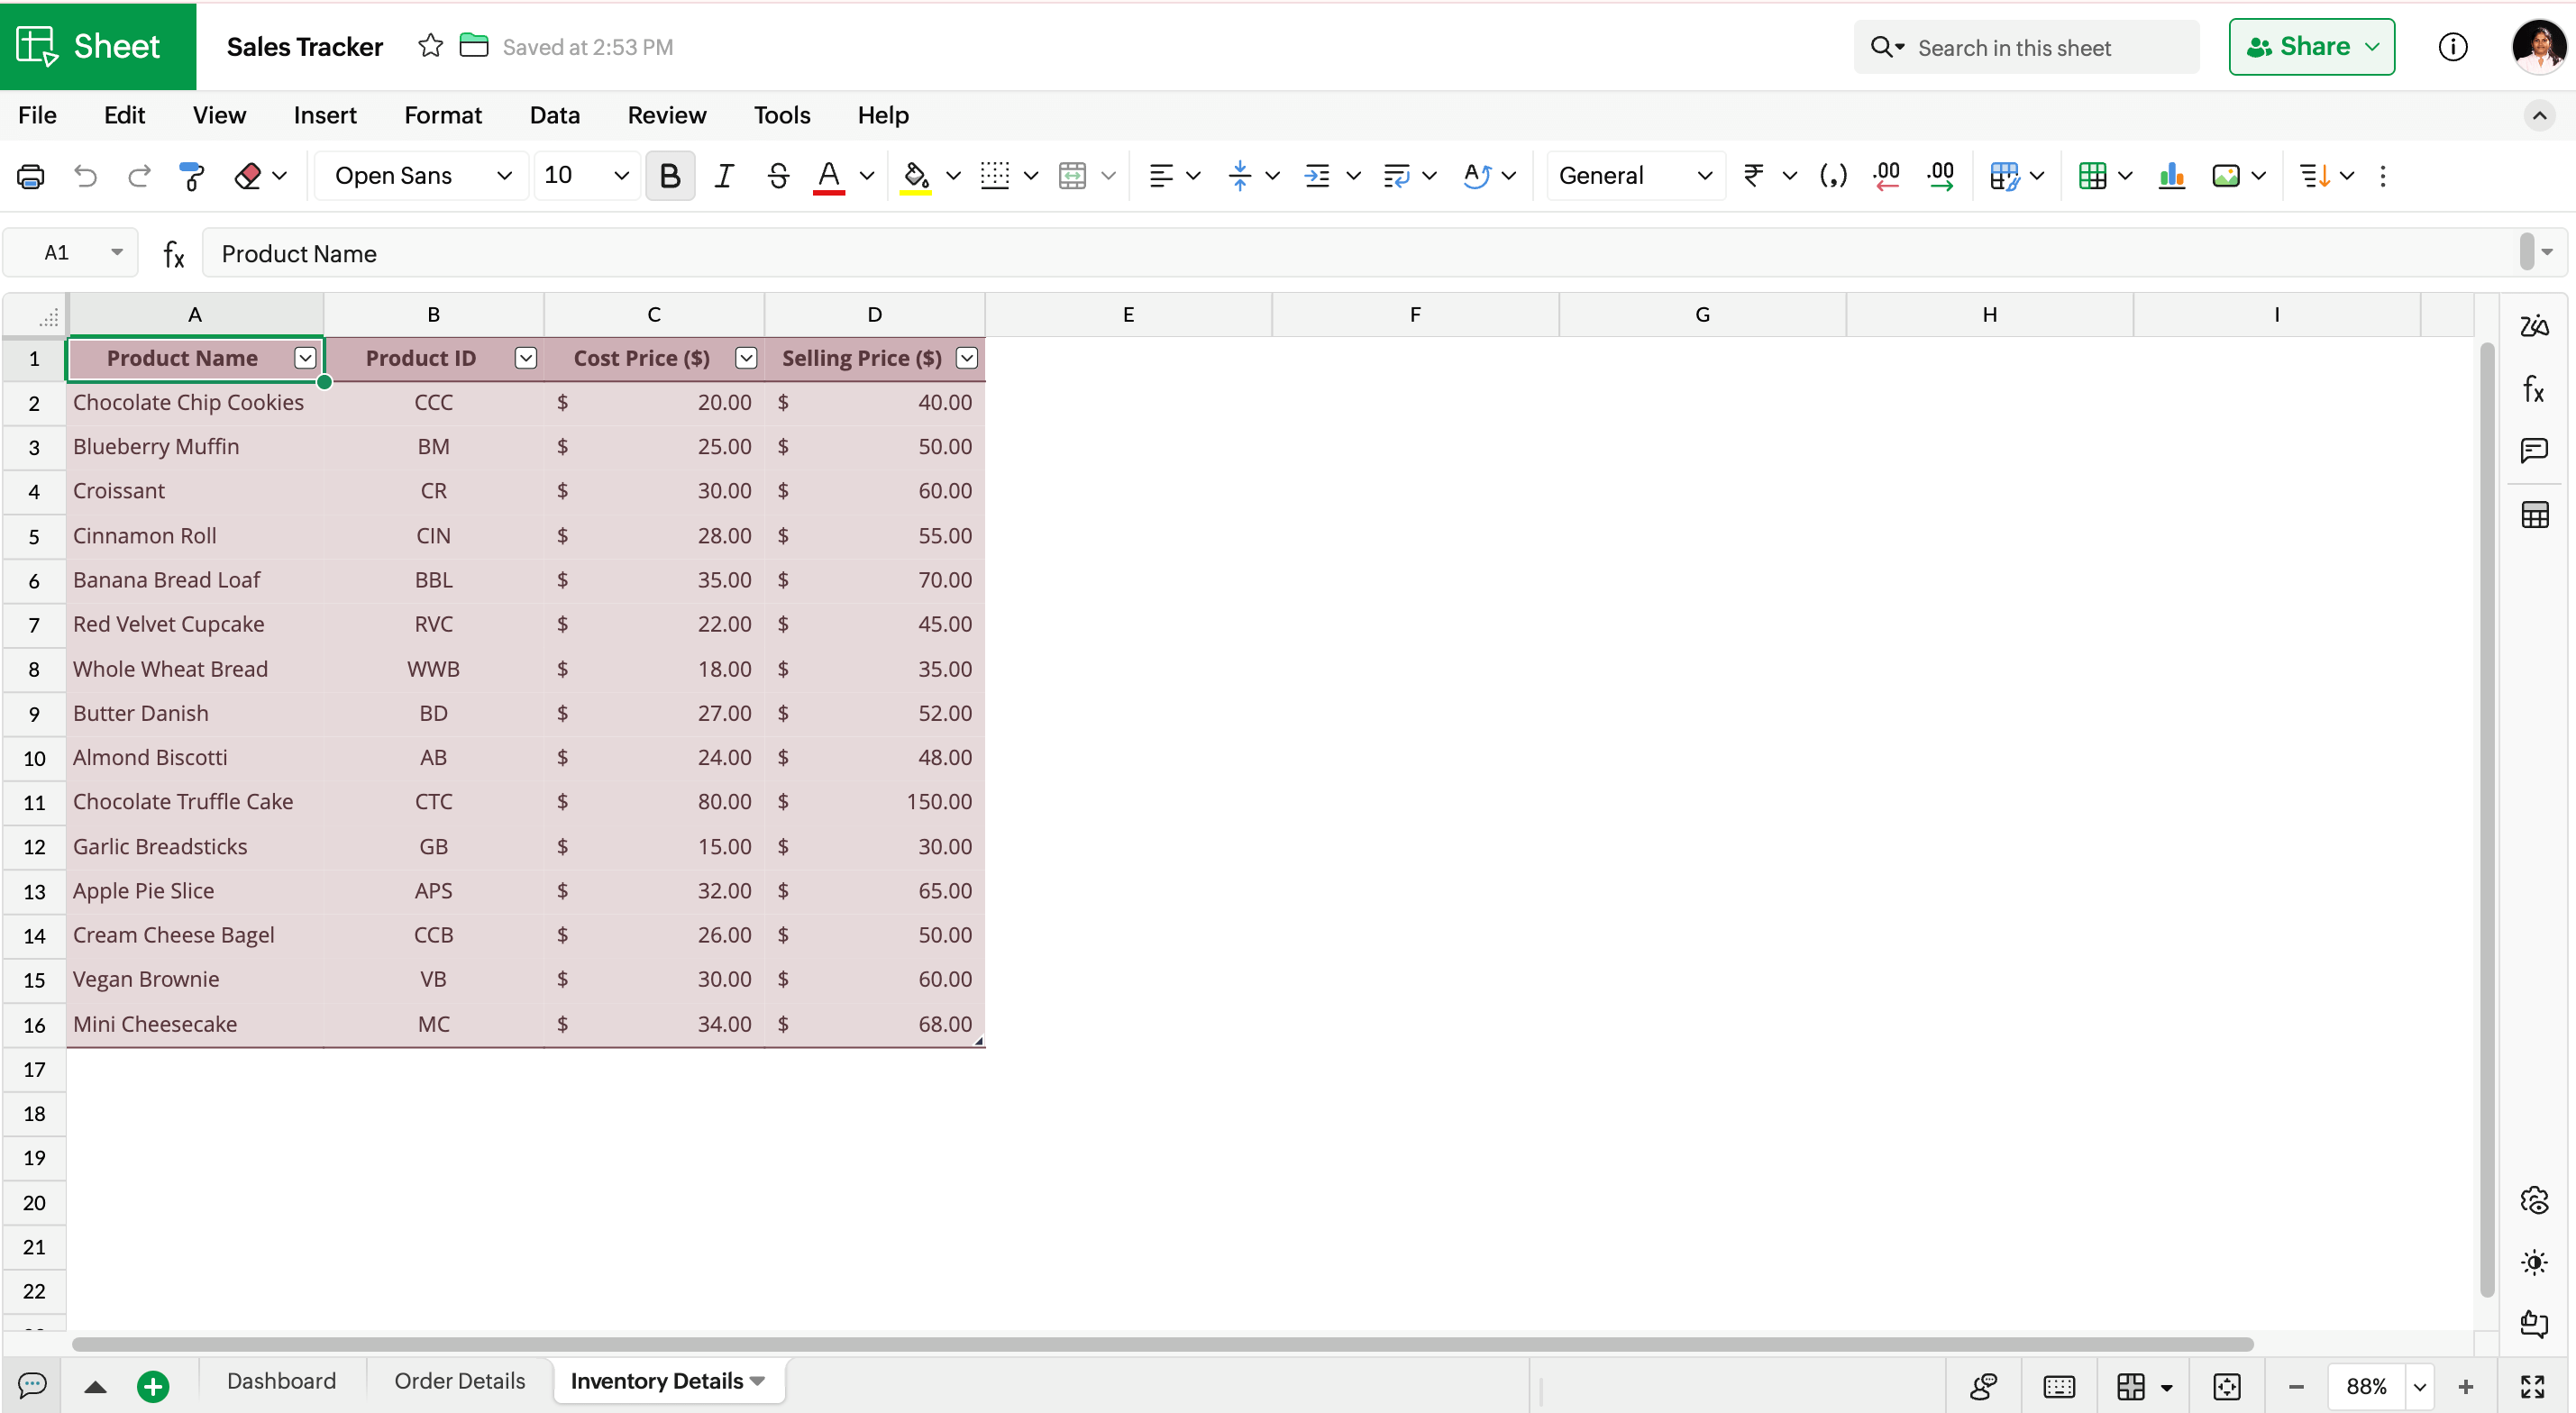
Step 2 : Set up a sheet for your primary inventory details
I created a new sheet–where I added the details of all my products manually. This acts as a library of my products. I entered the following columns of data in my sheet.
Product Name: The names of the products I sell.
Product ID: Unique ID for each product.
Cost of Production: Total expense in the process of manufacturing.
Selling Price: Final price paid by customers to purchase products.
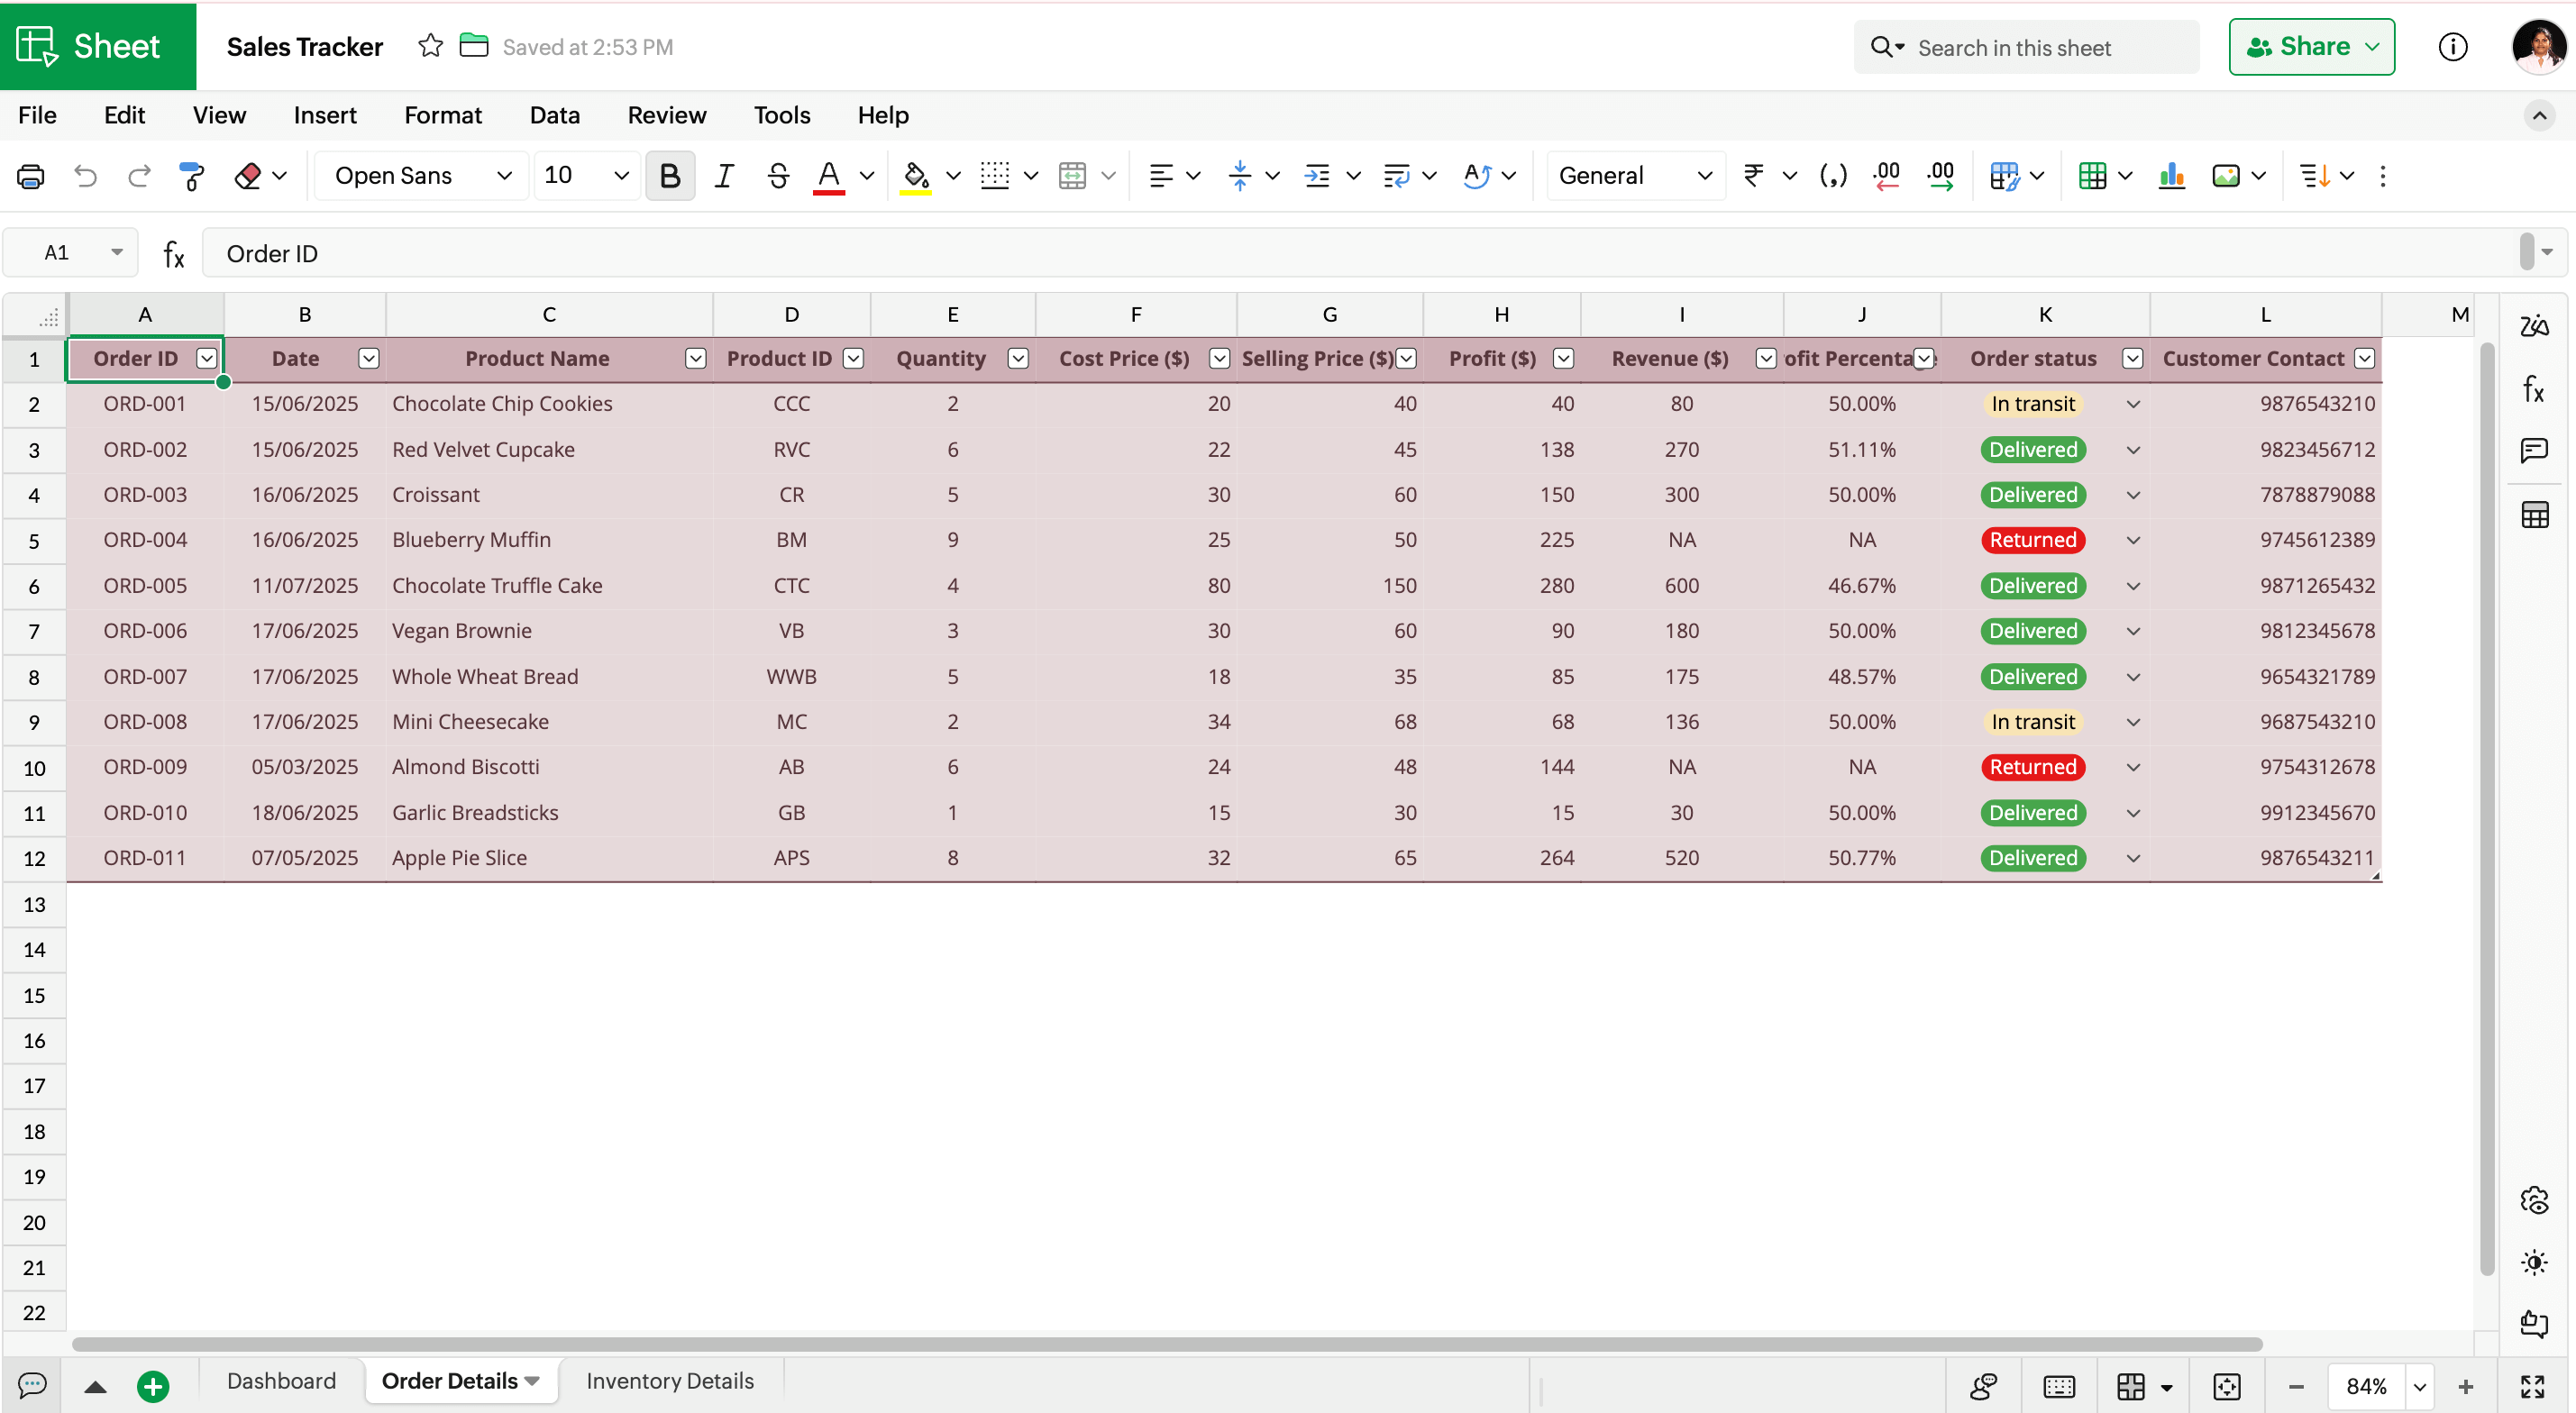
Step 3: Create a sheet to record your order details
I created a new sheet where I added all my order details. To reduce manual calculation with each order, I built a simple formula driven spreadsheet.
Date: Dates of transactions made for every product.
Product Name: Product Names of each item, ensuring that it matches correctly with the list of items in the Inventory sheet
To make things easier, I pulled Product ID, Cost of Production, Selling prices from the Inventory sheet using the VLOOKUP function.
Product ID: =VLOOKUP(C2;Table1;2;0)
Cost of Production: =VLOOKUP(C2;Table1;3;0)
Selling Price: =VLOOKUP(C2;Table1;4;0)
Quantity: Quantity of each product sold
Profit: =G2*E2-F2*E2, to calculate profits made every month
Order Status: Insert a color-coded picklist by navigating to Insert > Picklist with the values "Delivered", "Returned", and "In transit"
Revenue: =IF(K2="Returned";"NA";G2*E2) to calculate revenue made with each order
Profit Percentage: =IF(K2="Returned";"NA";H2/I2)
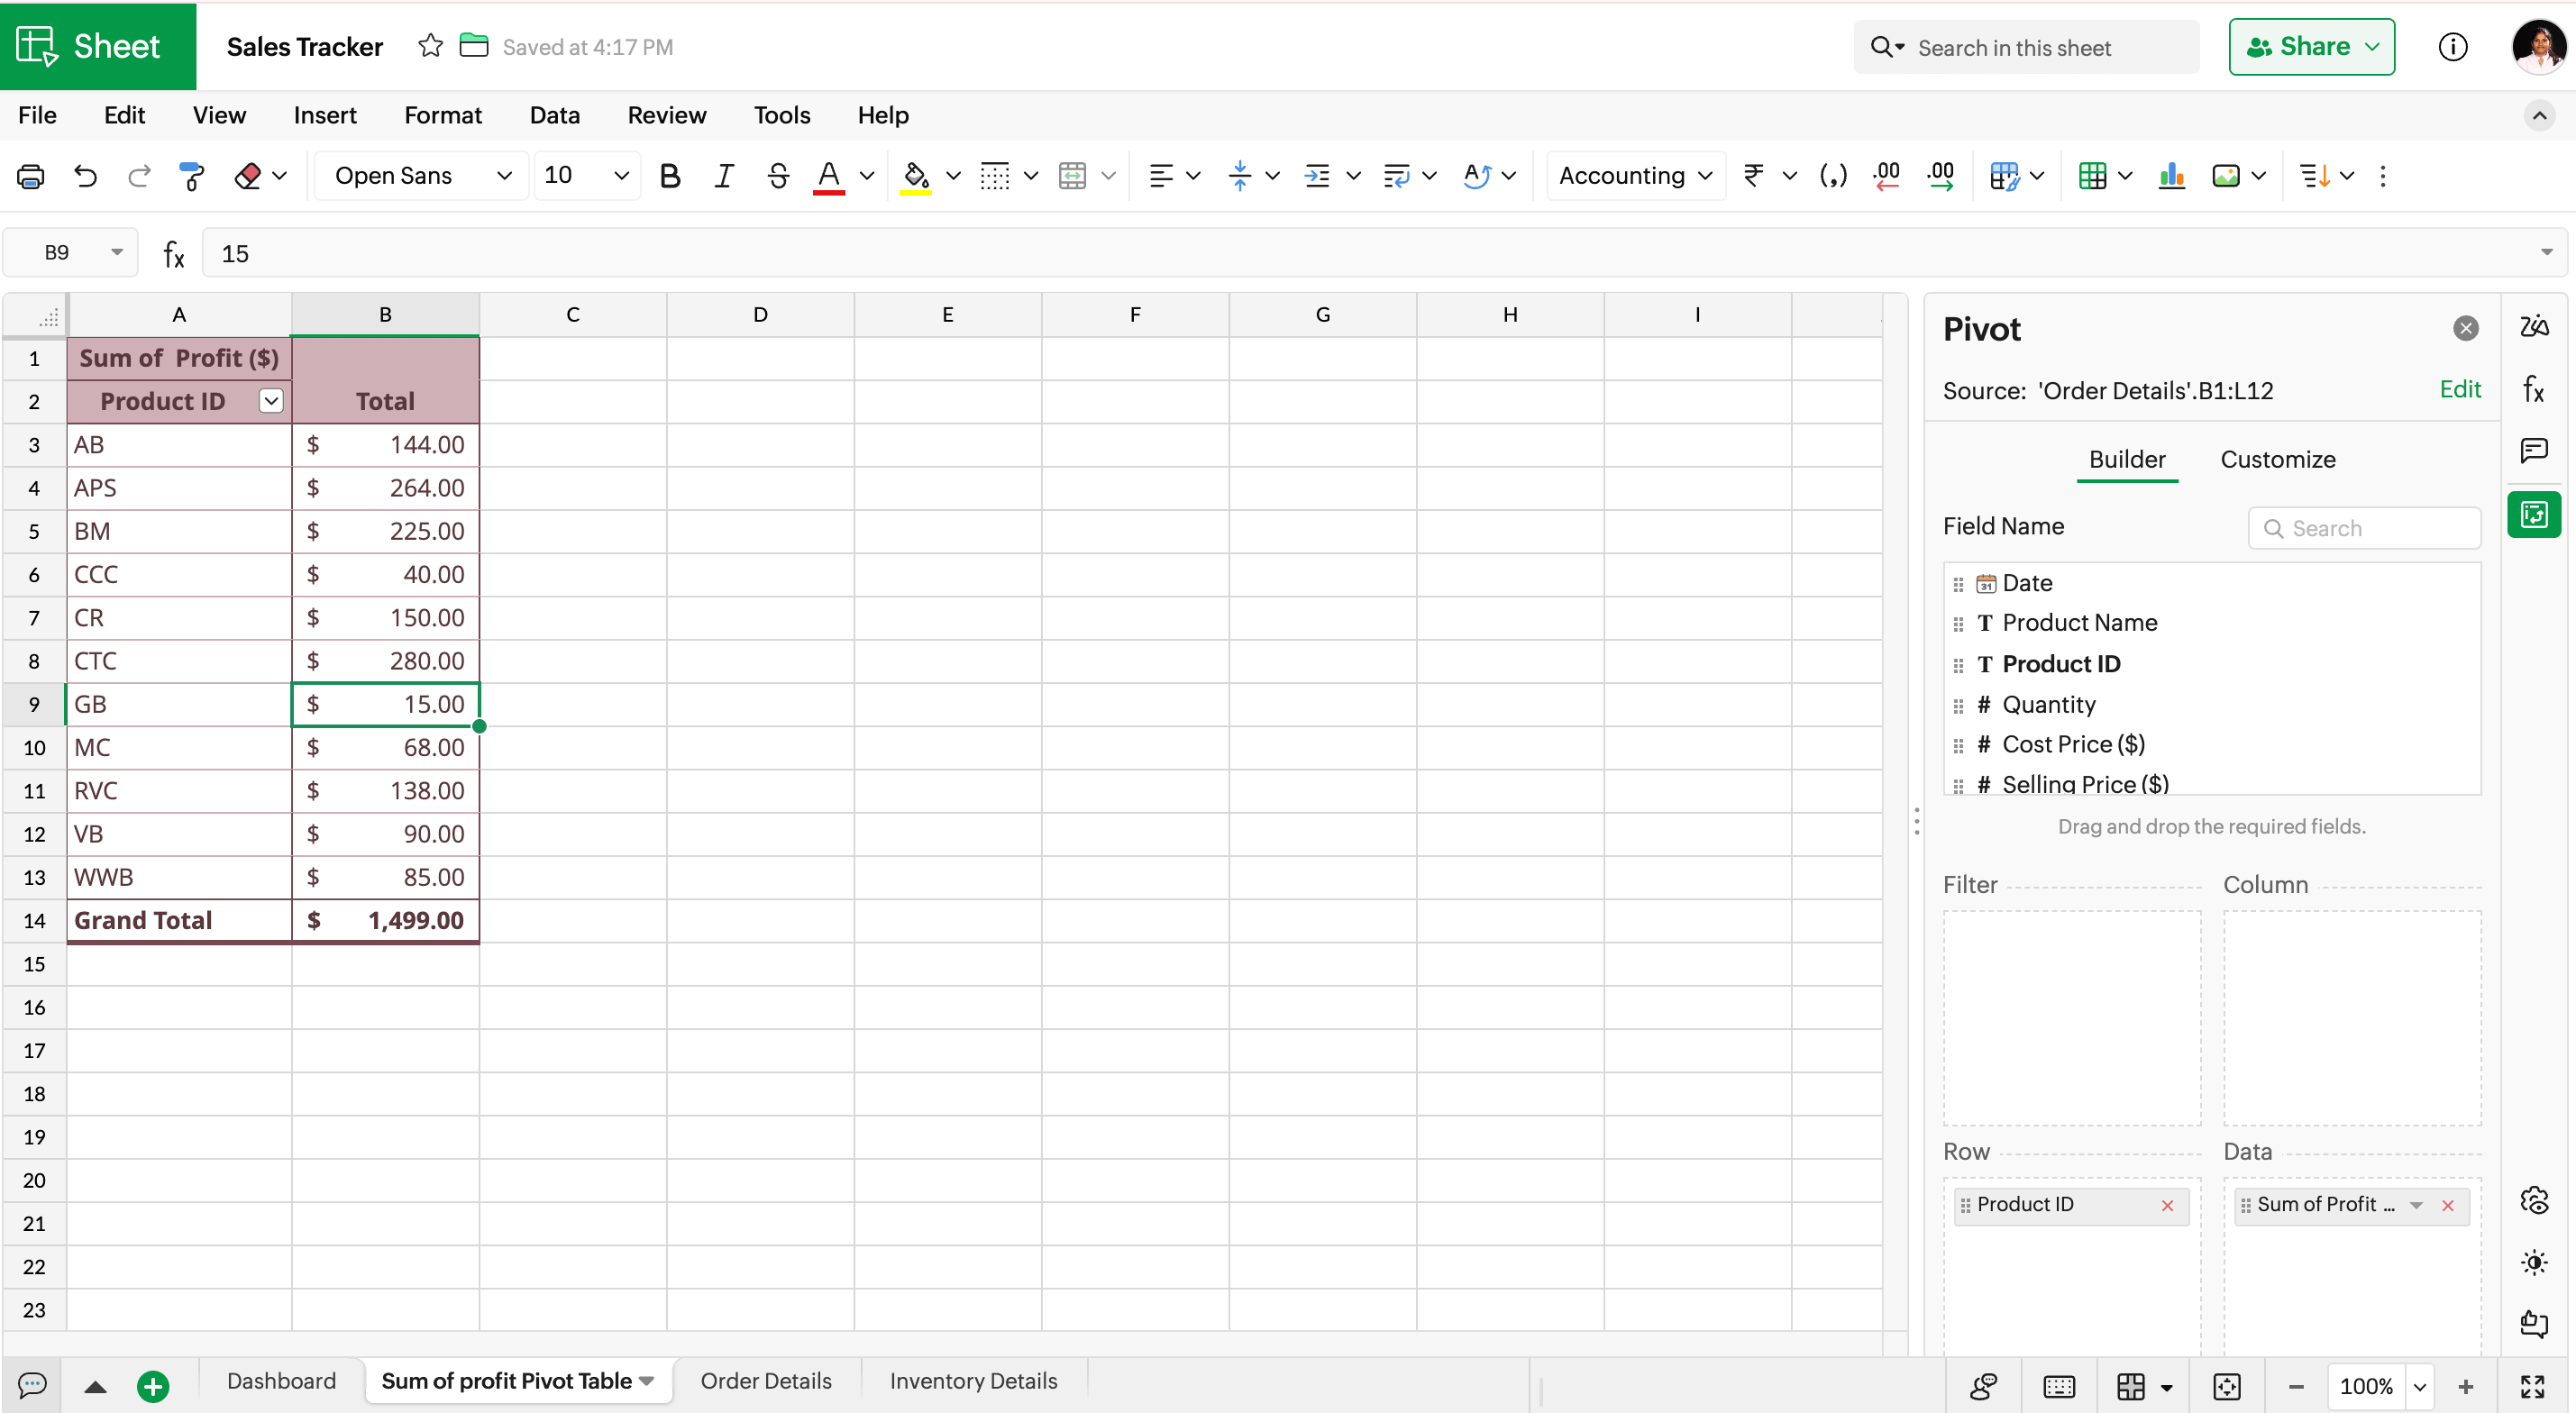
Step 4: Create the visual dashboard
The dashboard is designed to track business performance and order status. By building this dashboard, I aim to spot trends and patterns in my sales data. It will help me track shipments, forecast growth, and visualize data to support better decision making.
I have added the following elements to design my dashboard:
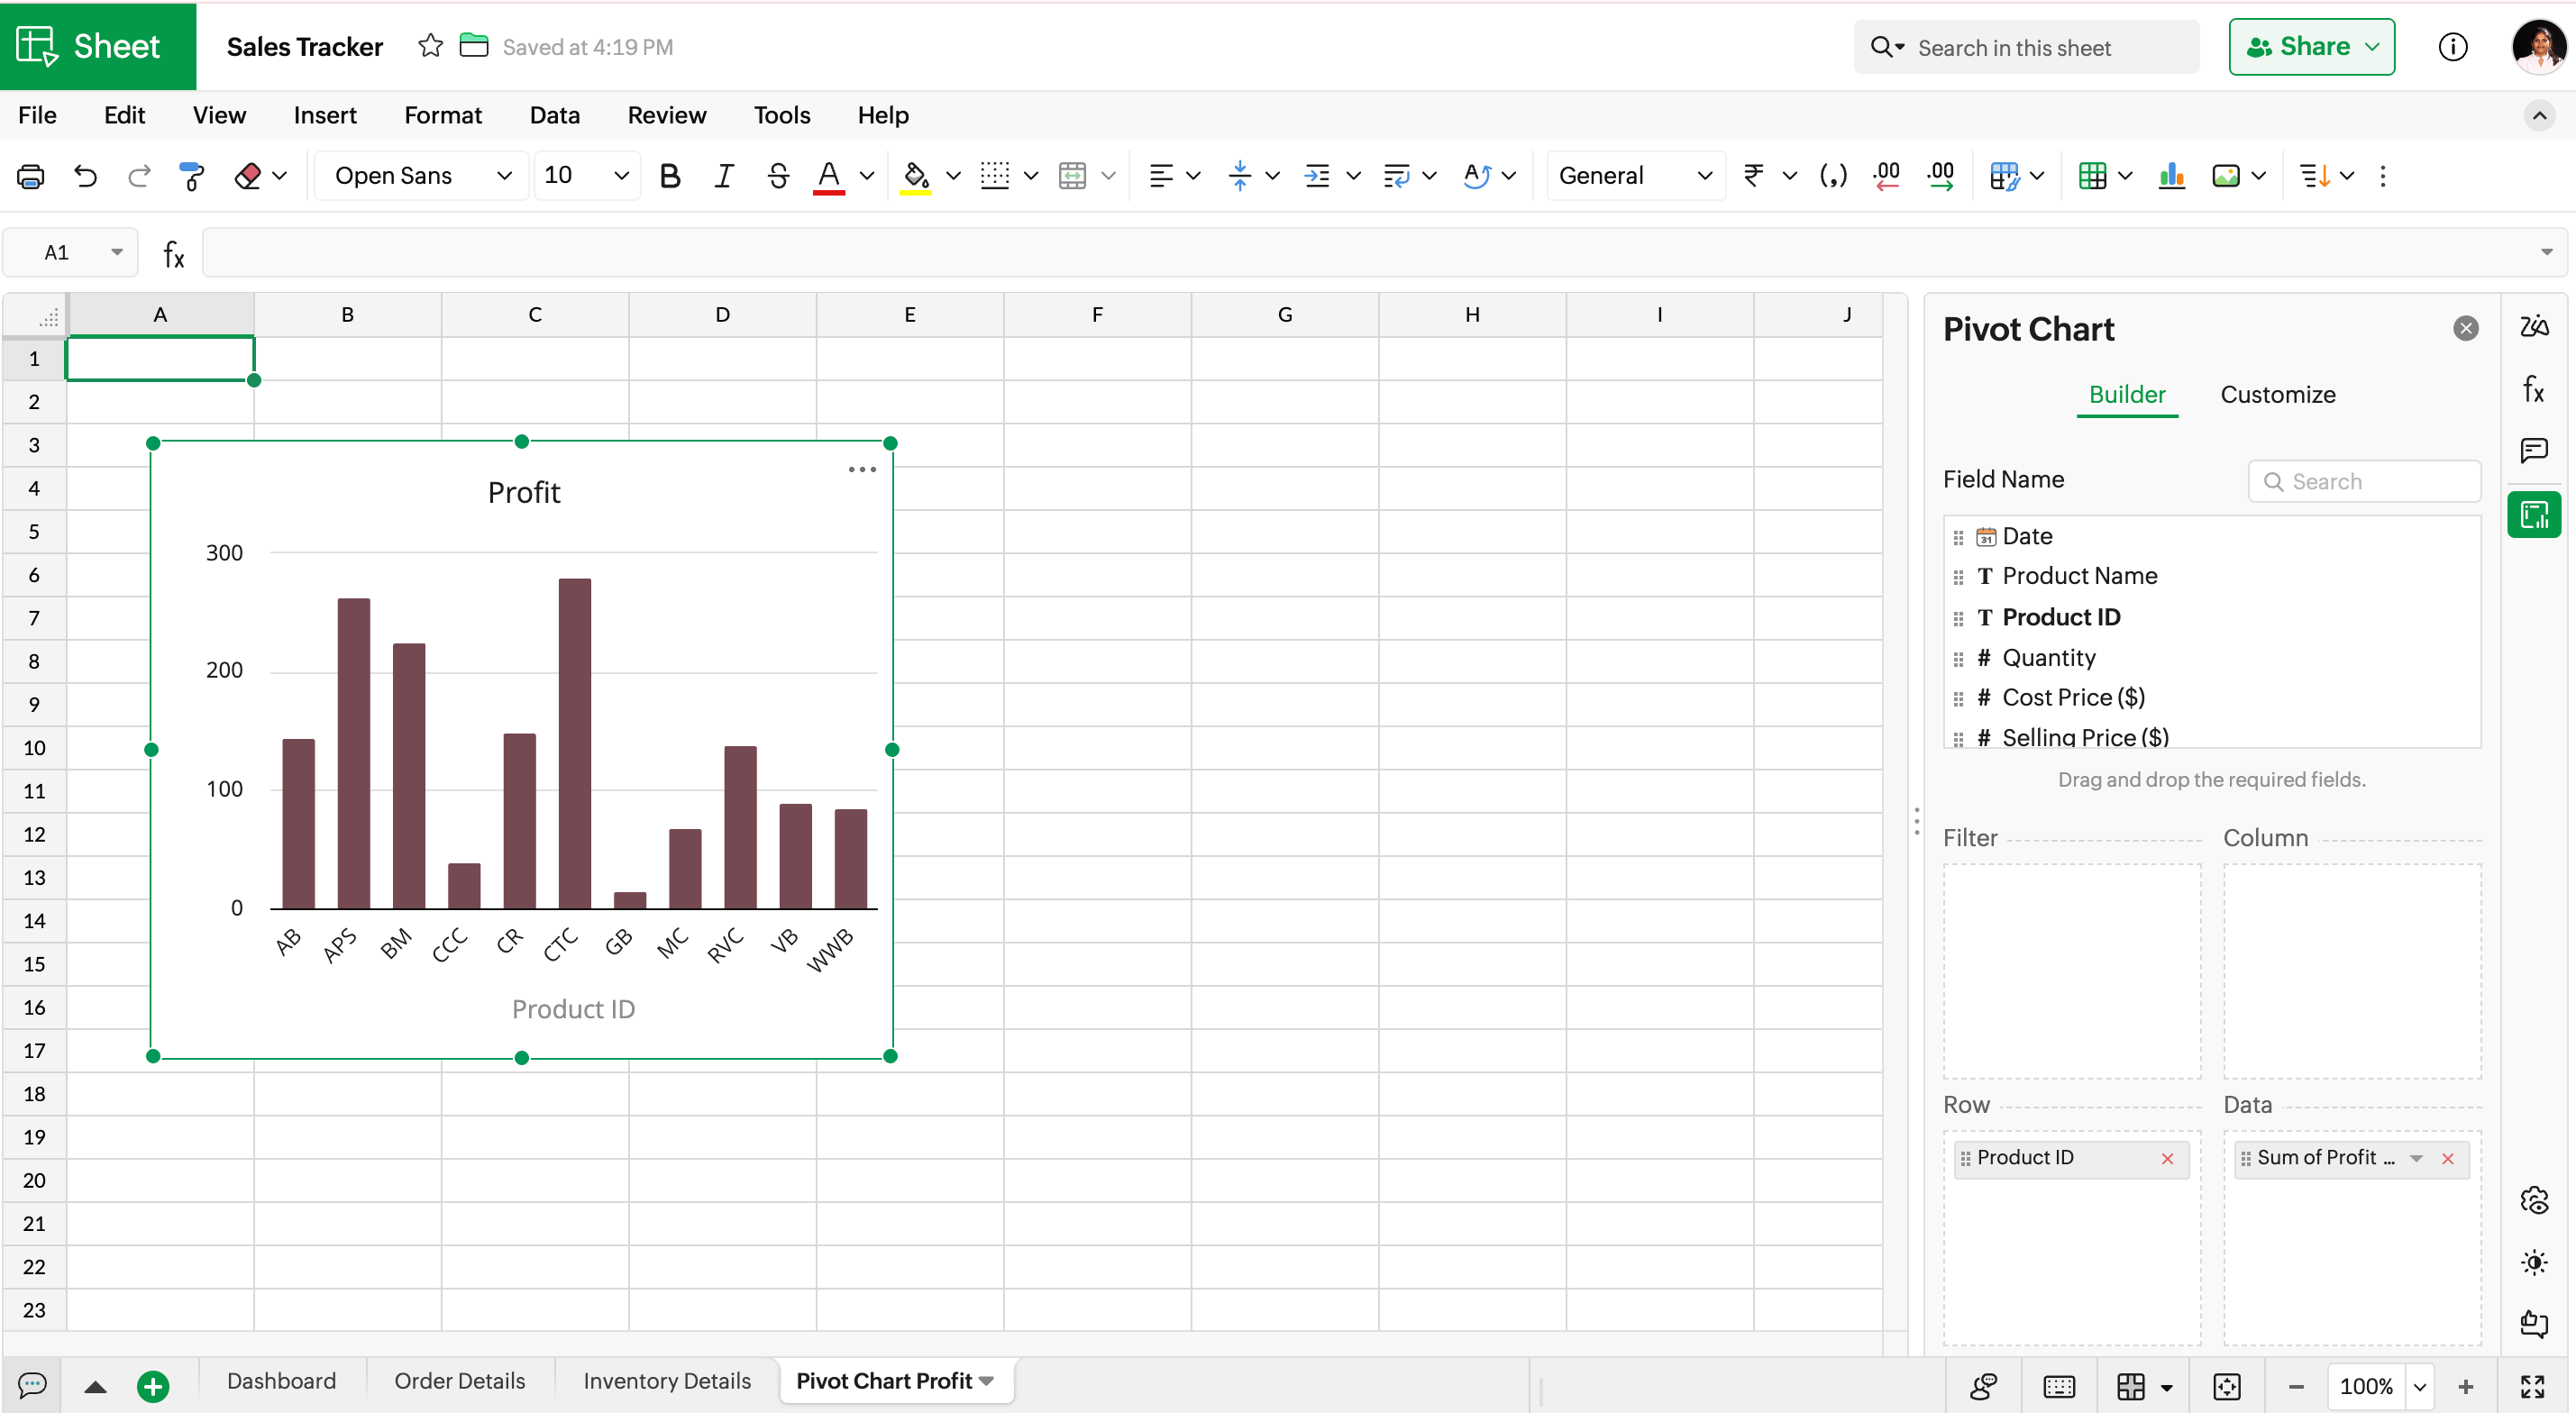
Pivot Table: A pivot table updates dynamically to convert my raw data into an organized summary with profits made each month and show trends based on the latest data.
Pivot Chart: This visually represents the monthly profit data summarized in the Pivot table, making it easier to spot trends and compare performances across months without reading through tables of numbers.
Timeline: With slicers or timelines added, I can organise and view data based on regions or Date and Time. In this dashboard, I am inserting a timeline to organize my orders received based on months.
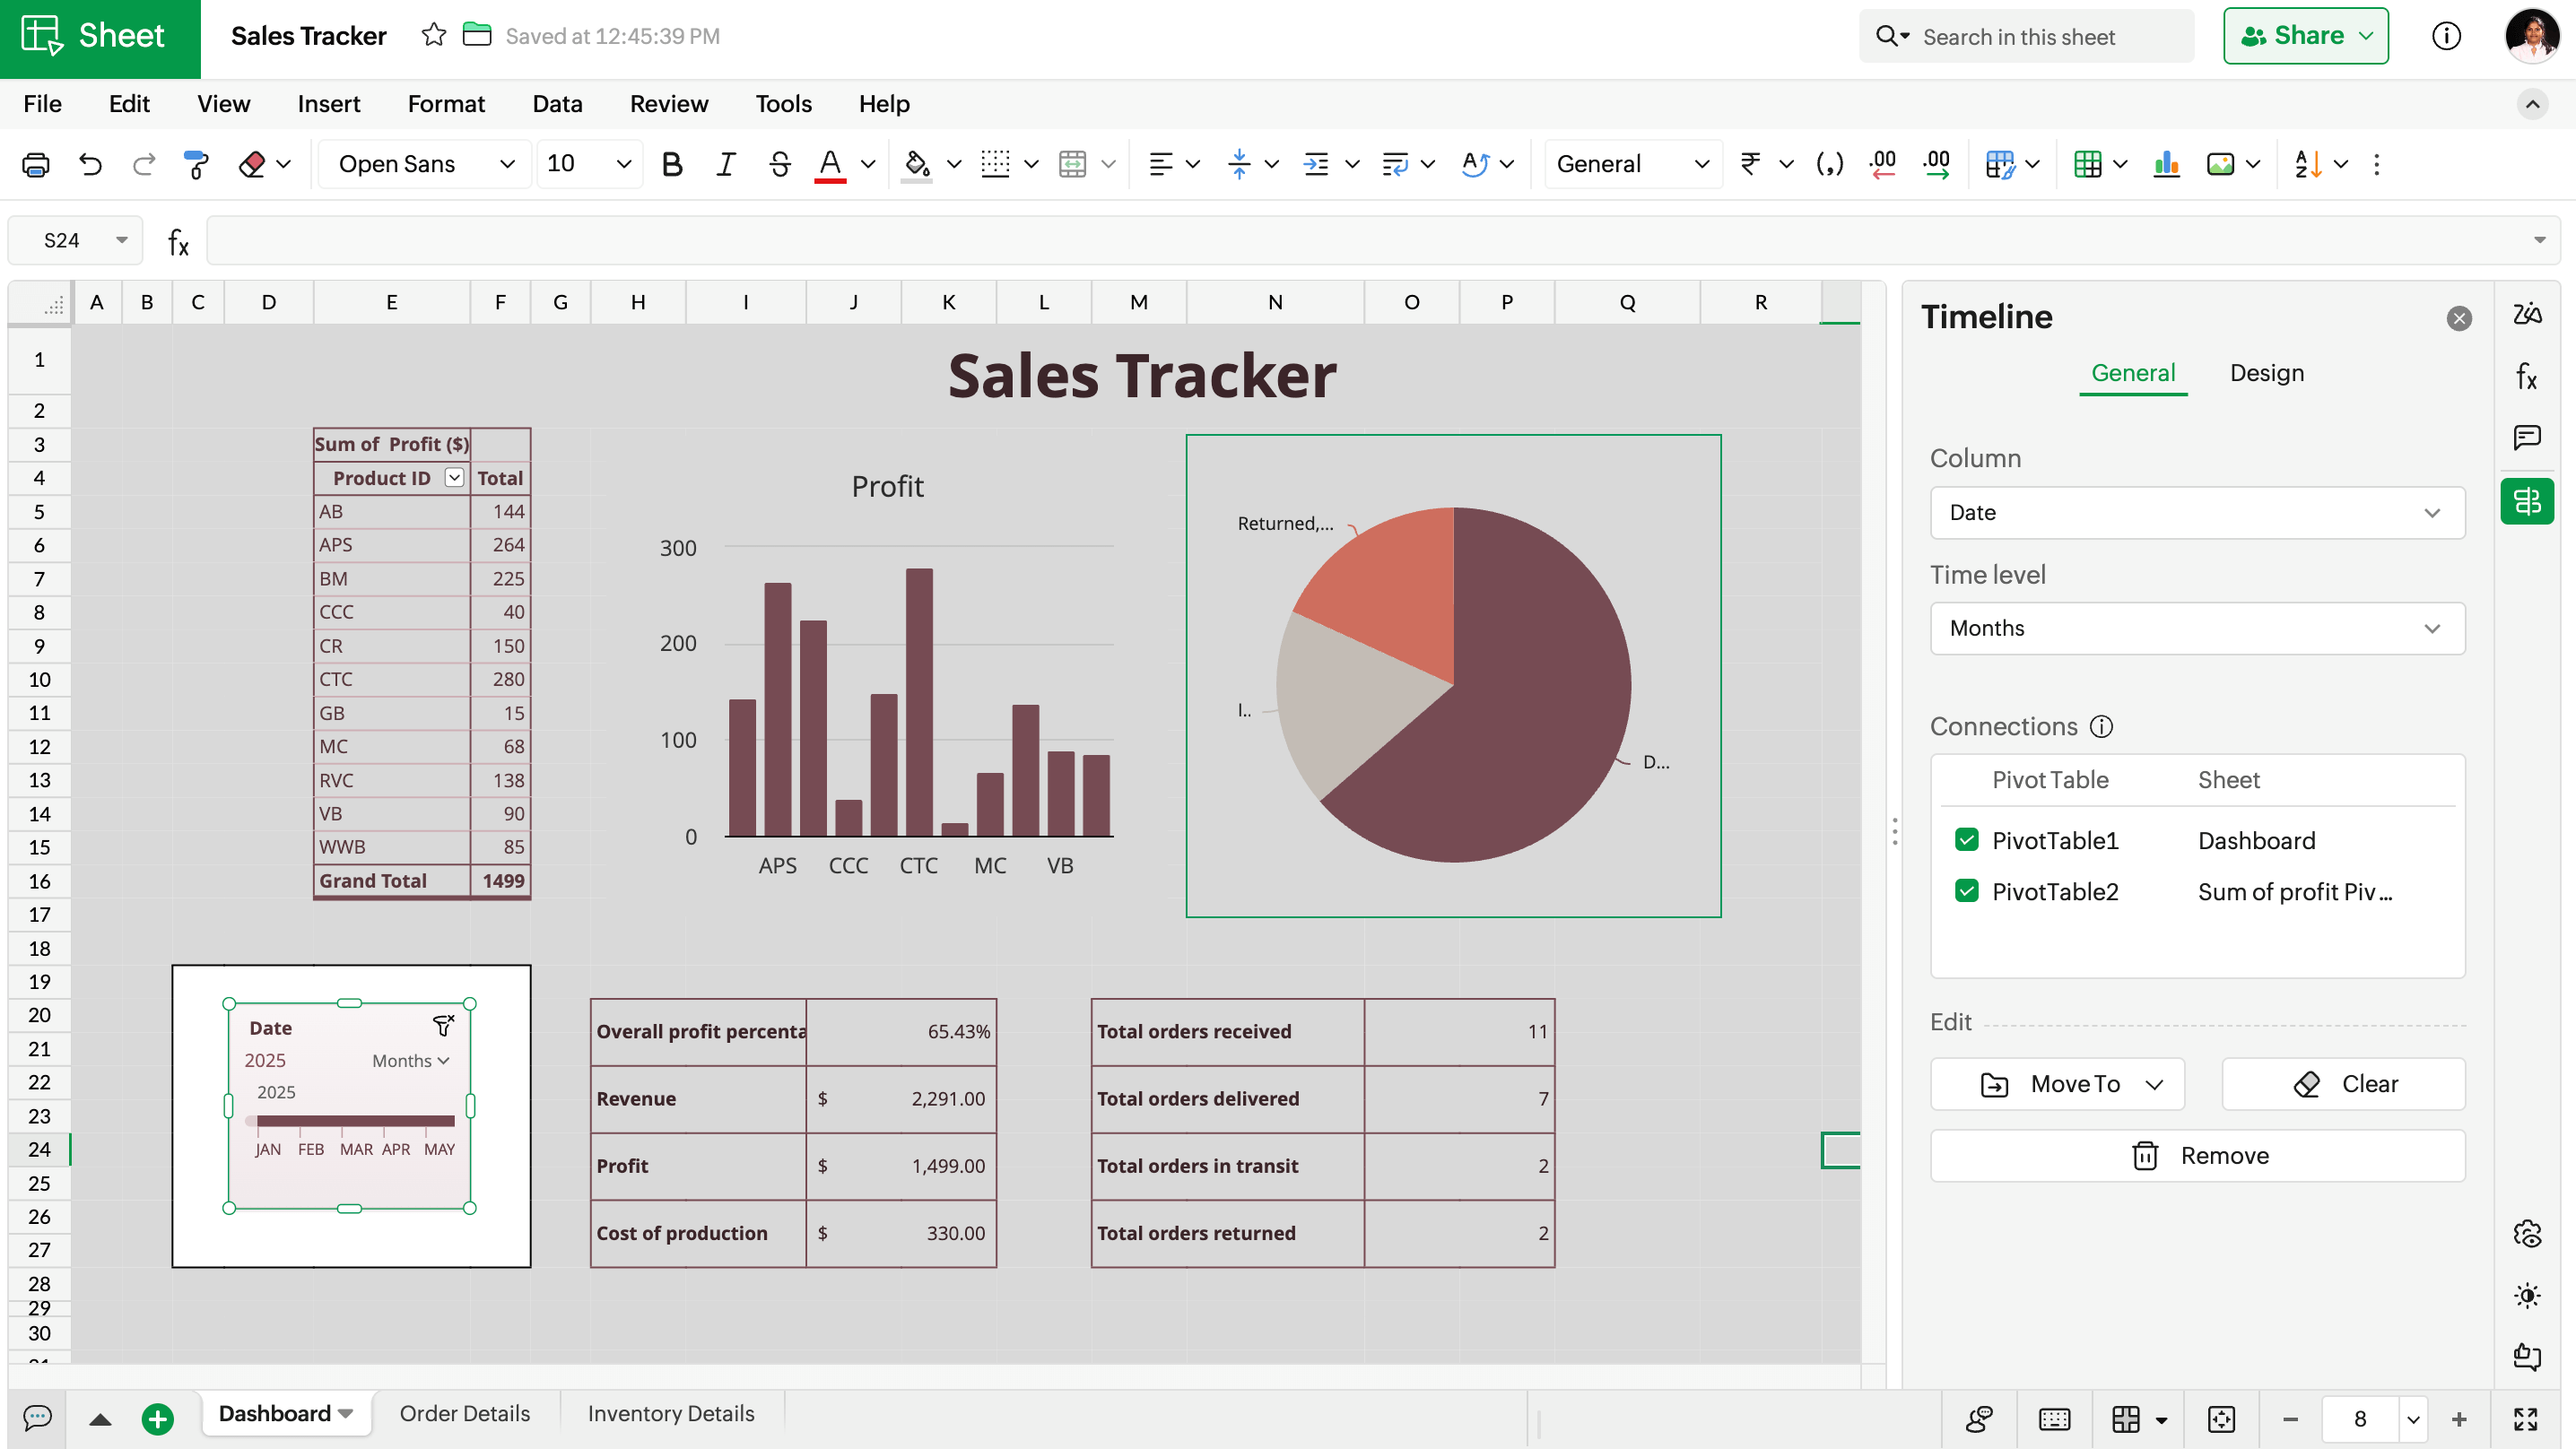
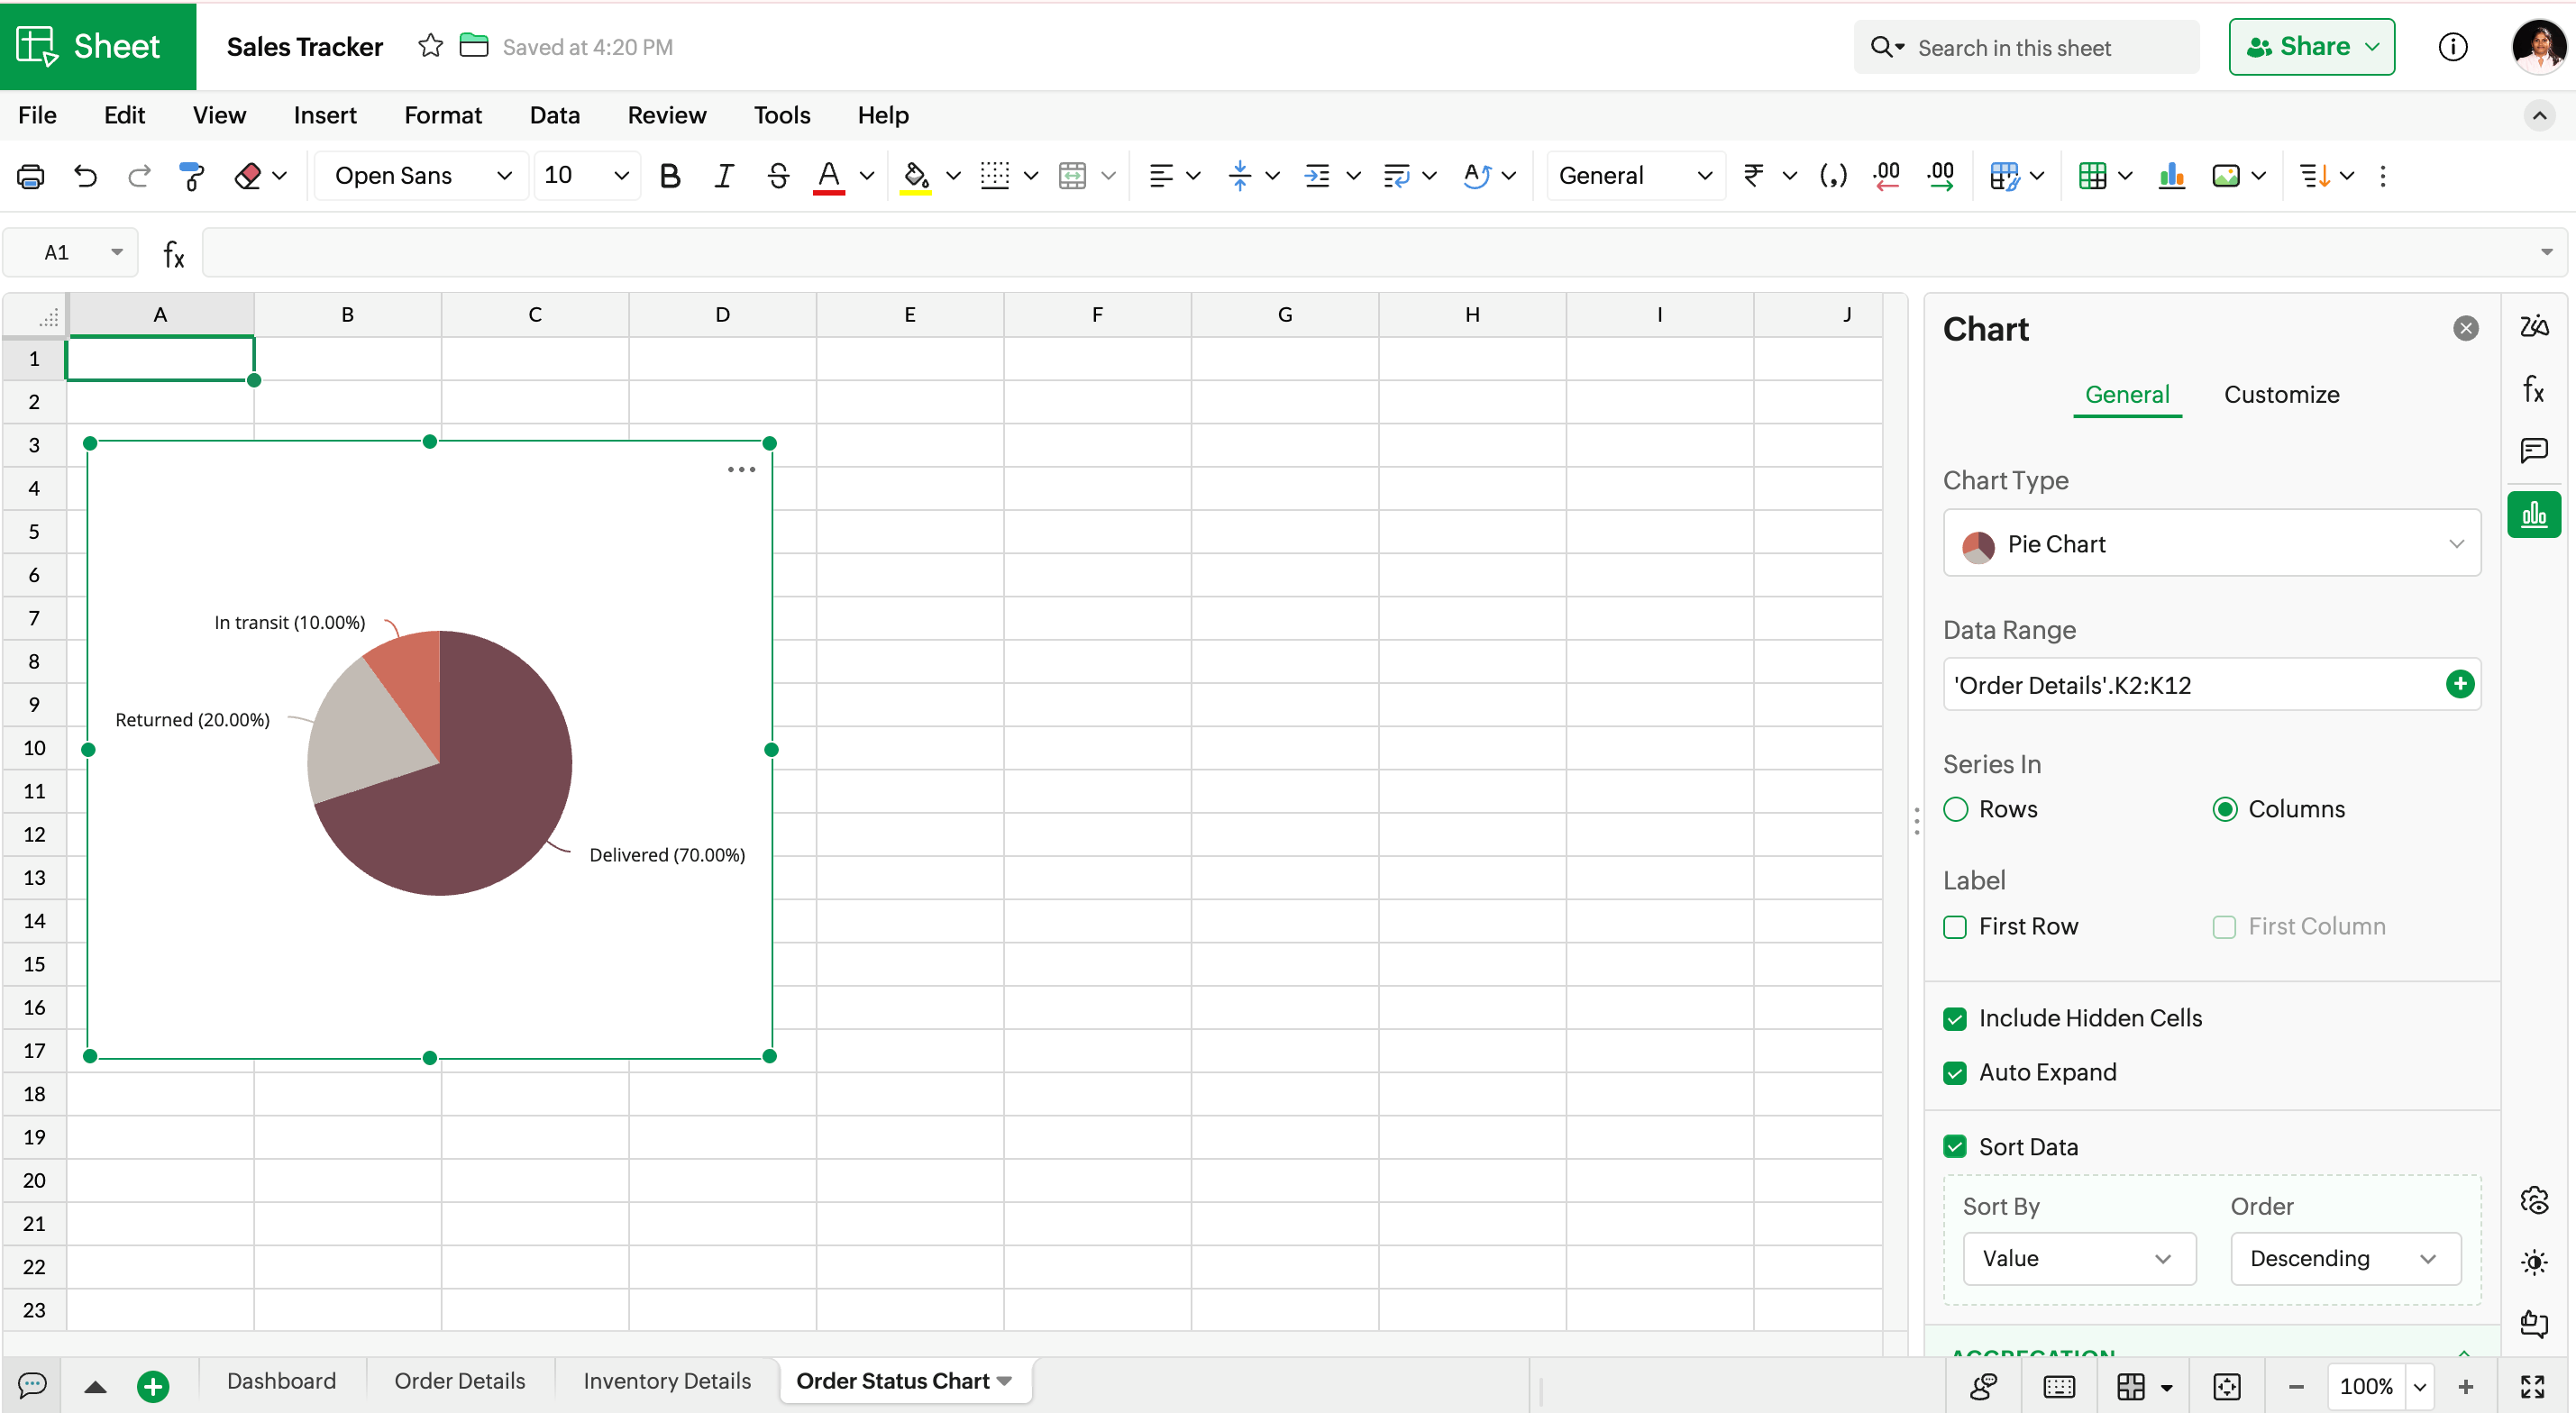
Order Status Chart: To track how our orders are moving, I have added a pie chart that shows how many products have been delivered, remain in transit, and have been returned. It helps the team take faster action to resolve delayed shipments and returns.
Step 5: Add the performance overview to the dashboard
This section provides the summary of my sales performance. This includes:
Overall profit percentage: =I23/I21
Overall revenue: =SUM('Order details'.I2:I12)
Total cost of production: =SUM('Order details'.F2:F12)
Total profit made: =SUM('Order details'.H2:H12)
Total orders received: =COUNT('Order details'.E2:E12)
Total orders delivered:=COUNTIF('Order details'.K2:K65536;"Delivered")
Total orders in transit: =COUNTIF('Order details'.K$1:K$65536;"In Transit")
Total orders returned: =COUNTIF('Order details'.K$1:K$65536;"Returned")
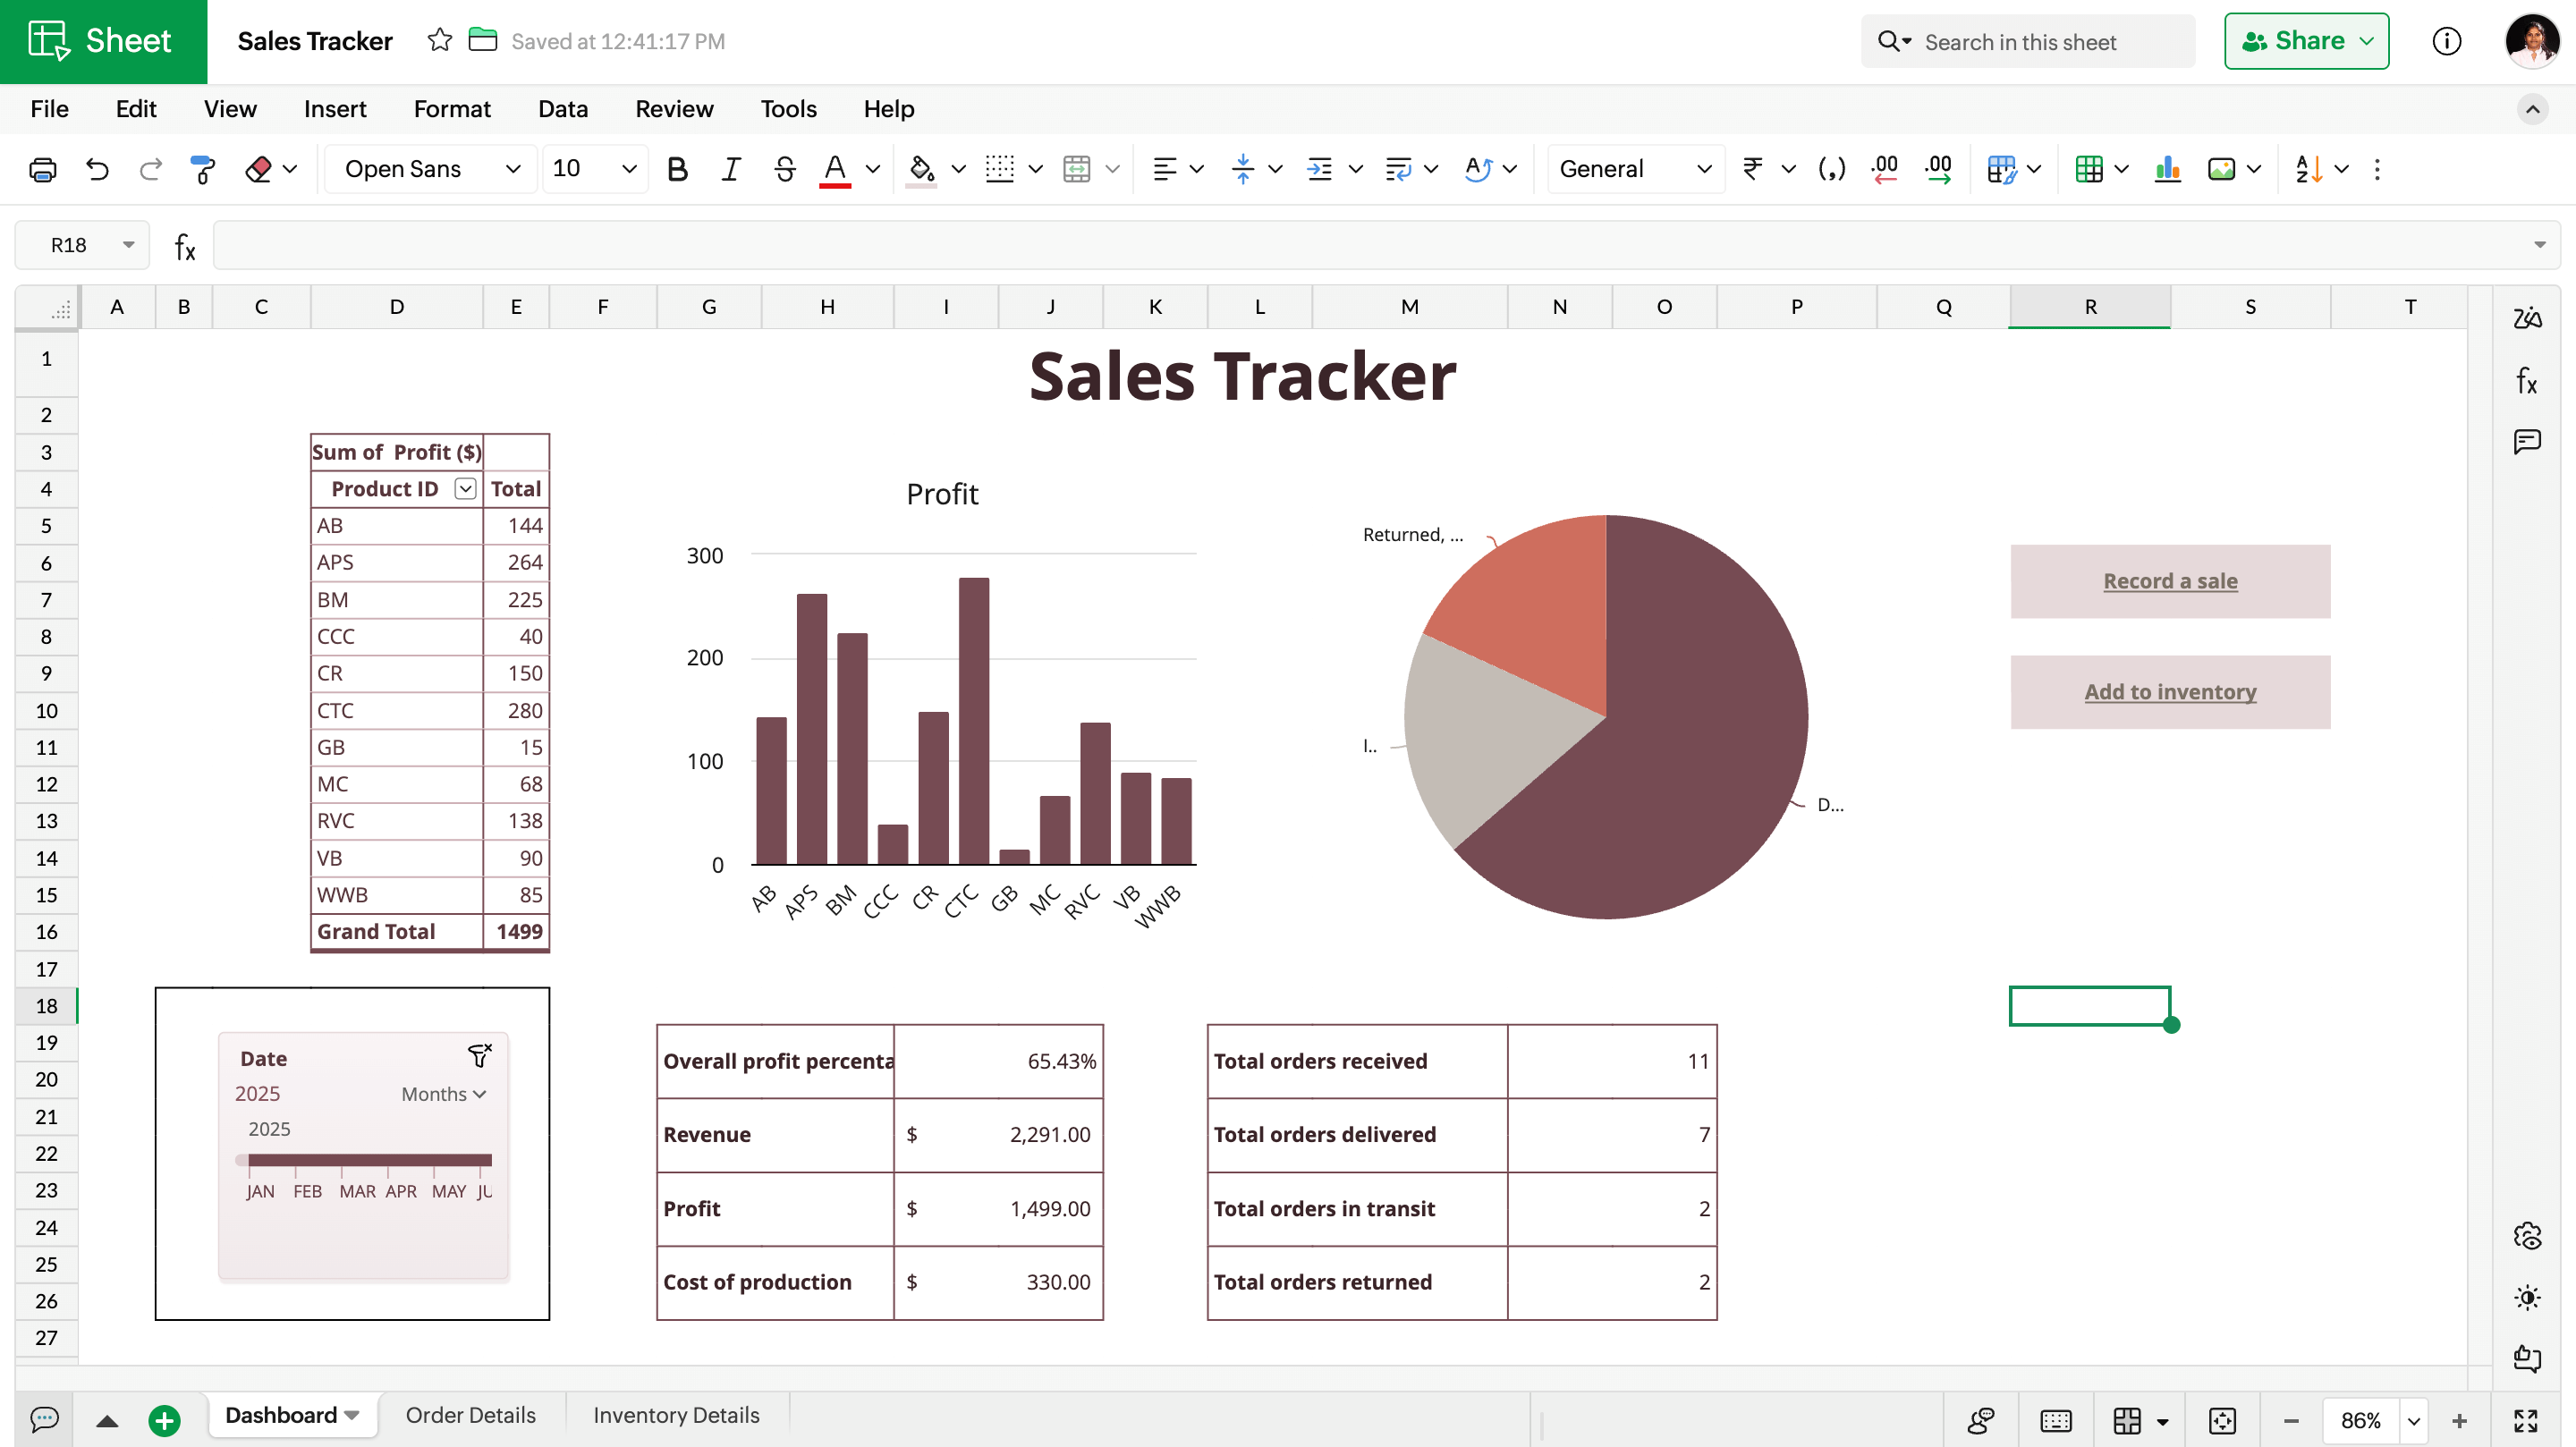
Tip: Add hyperlinks to other sheets in your dashboard to access new entries in other sheets easily.
Start tracking your sales in Zoho Sheet
This simple and effective online sales tracker makes data entry interactive and free of cost. You don't need to be a spreadsheet power user to create this simple solution for all your data entry problems. With automation and chart customization, it's easy to stay on top of your sales performance.
You can also manage this entire sales tracker using a mobile spreadsheet app, making it easier to update orders, track inventory, and review performance on the go.
Whether you want to use the free online sales tracker template, customize it, or create a new one, Zoho Sheet gives you the flexibility to track your orders the way that works best for you.
Here is the Online Sales Tracker I built for you to try it out.
 Yazhini Devi R
Yazhini is a content marketer and user education specialist at Zoho Sheet. She also handles her team’s social media and runs webinars. She enjoys working with spreadsheets and uses them to plan almost everything, from daily routines to events and birthday celebrations. She’s always ready to plan the next one—even when there isn’t one yet.