Exporting a Dashboard
Zoho Analytics lets you export dashboards so you can view them offline, share them with others, or preserve a snapshot of your data. You can export a dashboard in multiple formats, depending on how you intend to use it. Each format comes with its own set of customization options to control how the content is structured and presented.
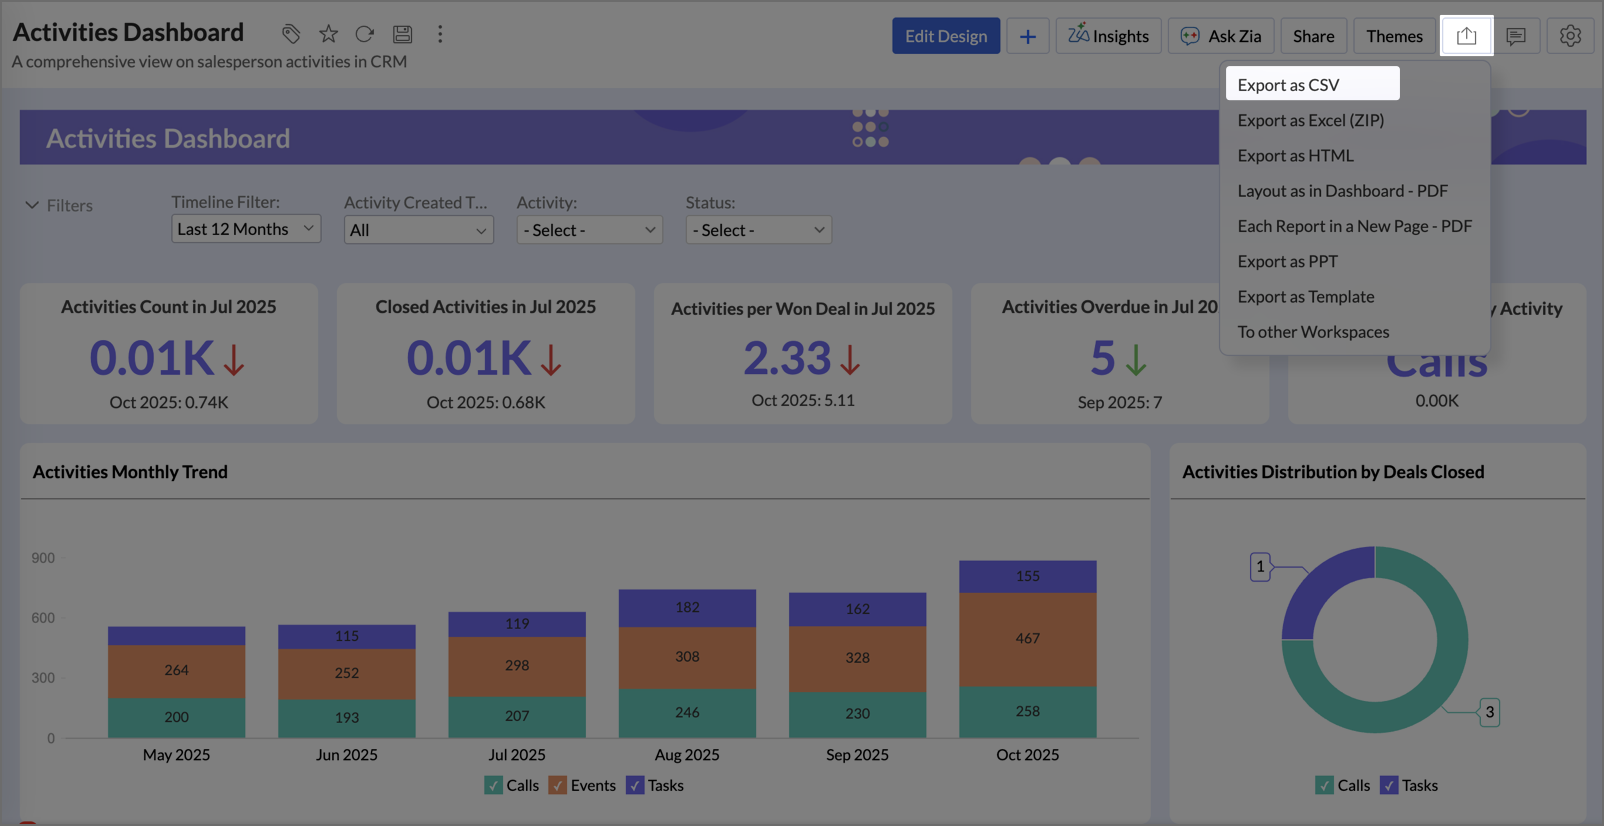
Dashboards can be exported in any of the following formats:
Beyond file exports, Zoho Analytics also lets you save a dashboard as a reusable template or move it directly into another workspace within the platform.
Exporting as CSV
Exporting a dashboard as CSV lets you download the underlying data in a structured, tabular format that can be opened in spreadsheet tools or used for further analysis.
To export as CSV:
- Open the dashboard.
- Click the Export icon and select Export as CSV.
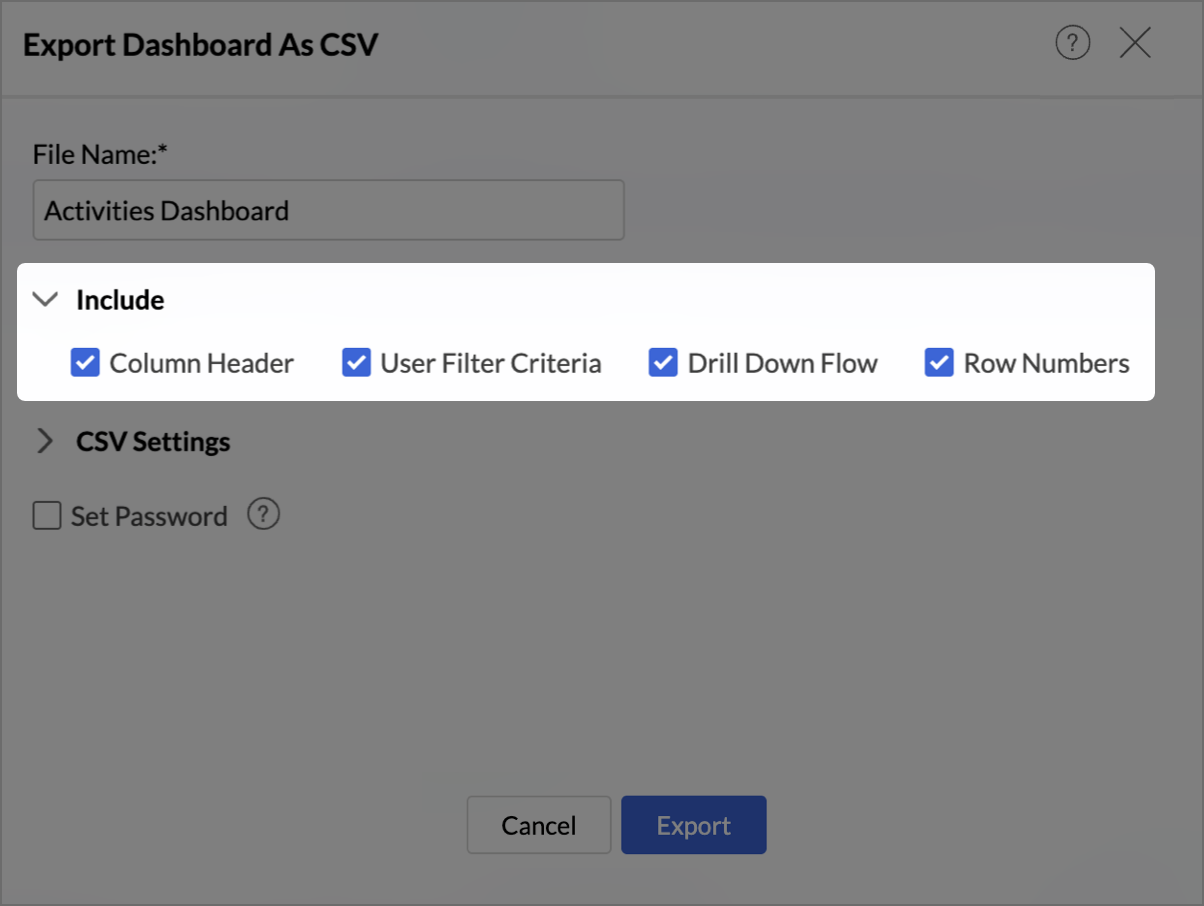
- In the Export as CSV dialog, enter a name for the file in the File Name field.
- Configure the Include and Format options as needed (described below).
- Optionally, enable password protection. To learn more about Password Protection, click here.
- Click Export.

Include Options
You can control what additional information is included alongside the data:
- Column Header: Adds column names as the first row of the CSV file.
- User Filter Criteria: Includes any user filters currently applied to the dashboard.
- Drill Down Flow: Captures the drill-down hierarchy in the exported data.
- Row Numbers: Adds a row number column to the exported data.

Format Options
These settings control how the data is structured within the CSV file:
- Column Separator: Defines how columns are separated.
Available Options: Comma, Tab, Semicolon, Space, Pipe. - Record Separator: Defines how rows are separated.
Available Options: Windows (CRLF), Linux (LF), Mac (CR). - Text Qualifier: Defines how text values are enclosed.
Available Options: Single Quote (') or Double Quote (").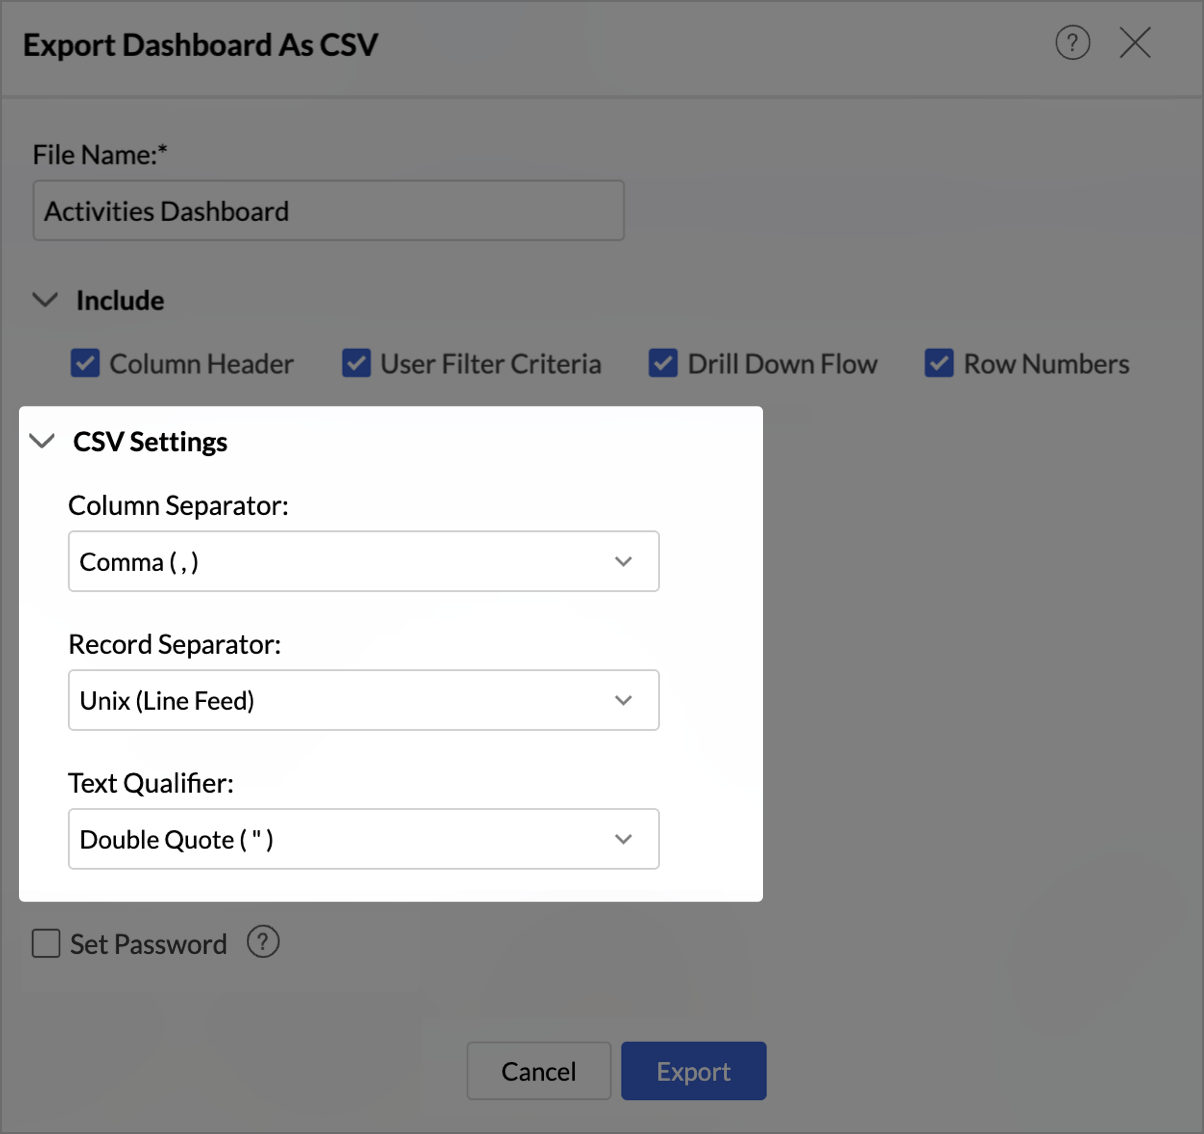

Exporting as Excel
Exporting a dashboard as Excel creates a ZIP file containing the dashboard data in a spreadsheet format. This is useful when you need the data in a structured, editable format compatible with Microsoft Excel.
To export as Excel:
- Open the dashboard.
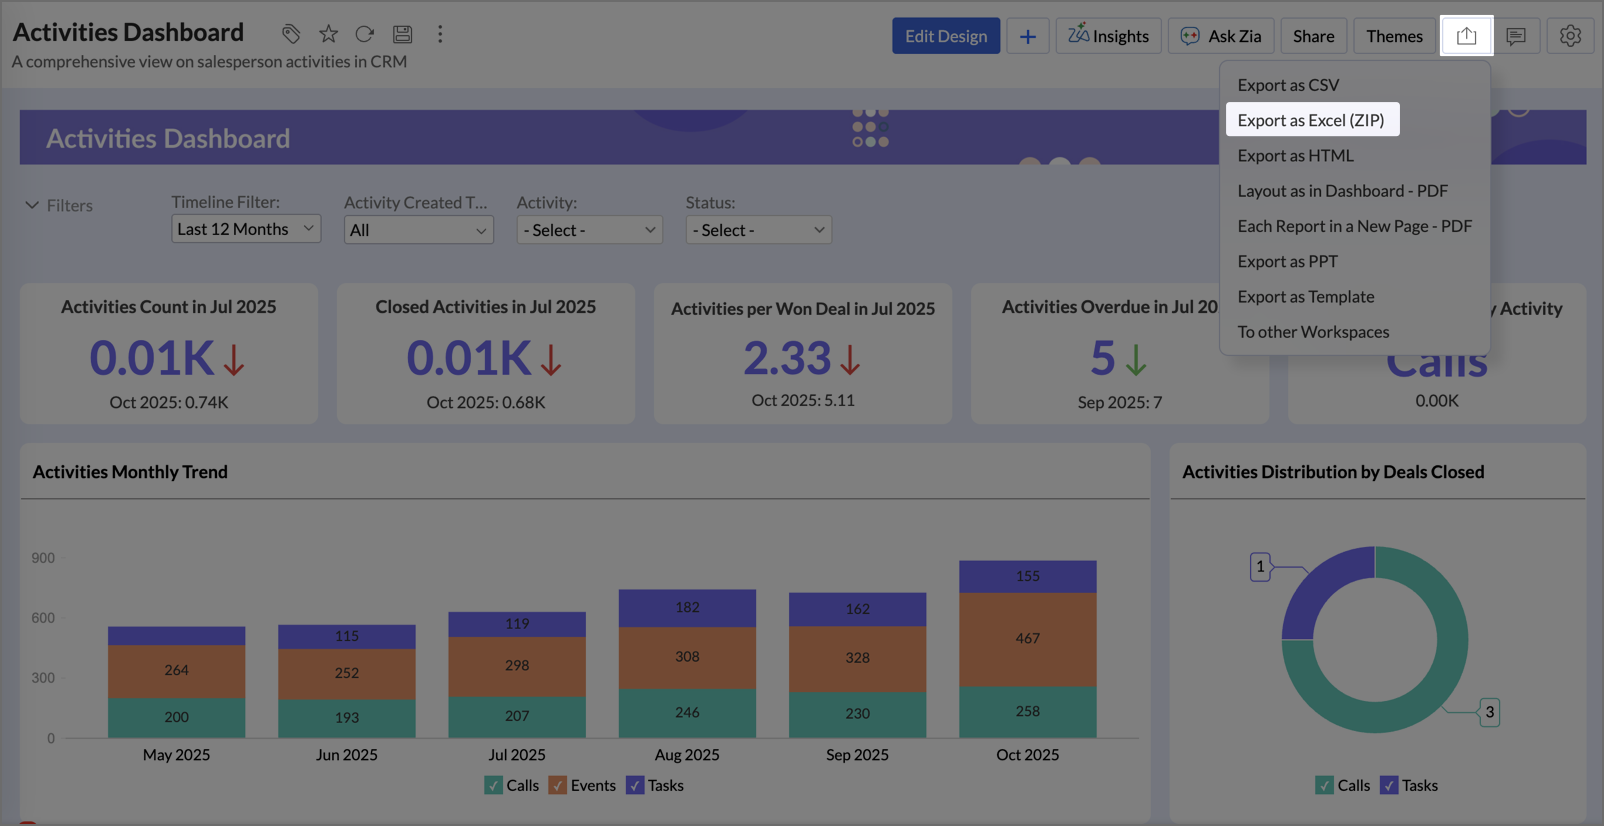
- Click the Export icon and select Export as Excel (ZIP).
- In the Export as Excel dialog, enter a name in the File Name field.
- Select the Export Format: .xlsx or .xls from the drop-down.
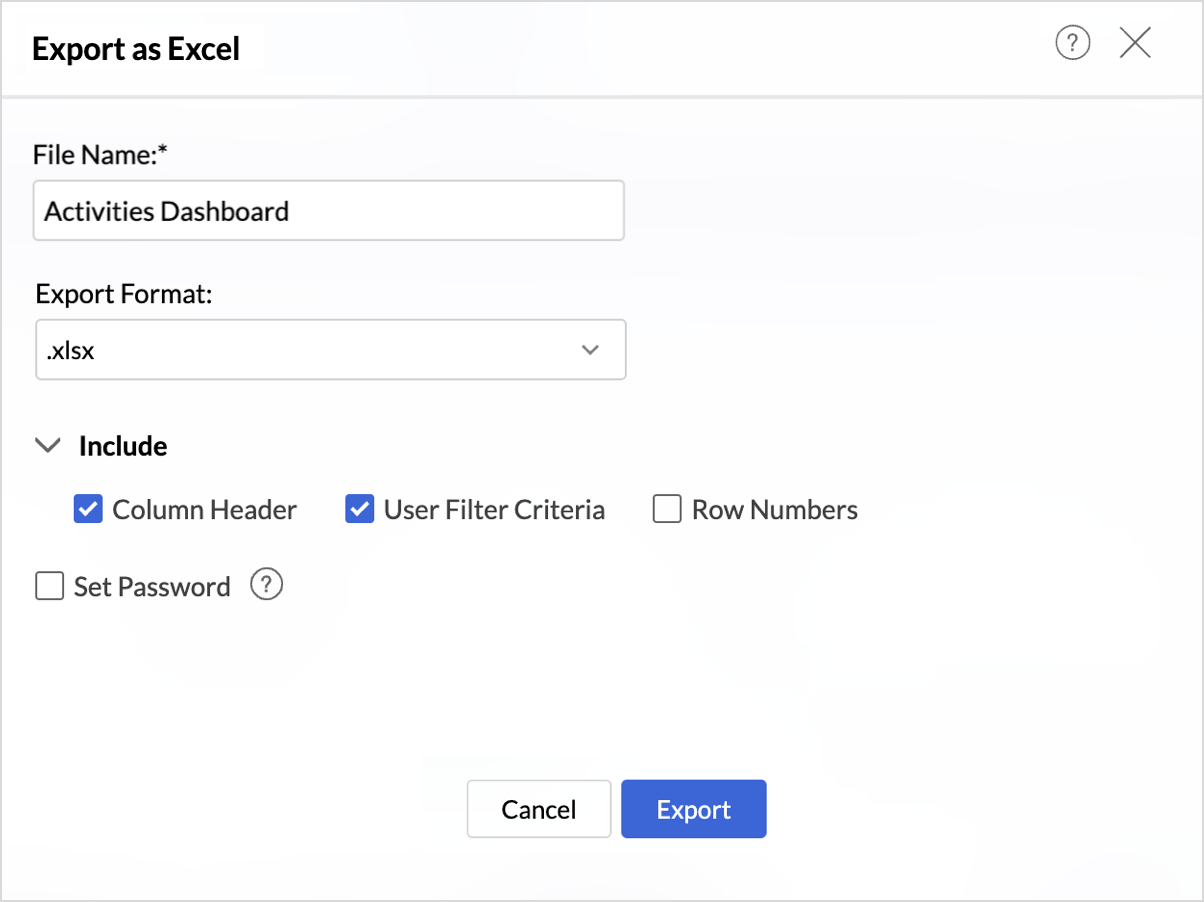
- Configure the Include options as needed (described below).
- Optionally, enable password protection. To learn more about Password Protection, click here.
- Click Export.


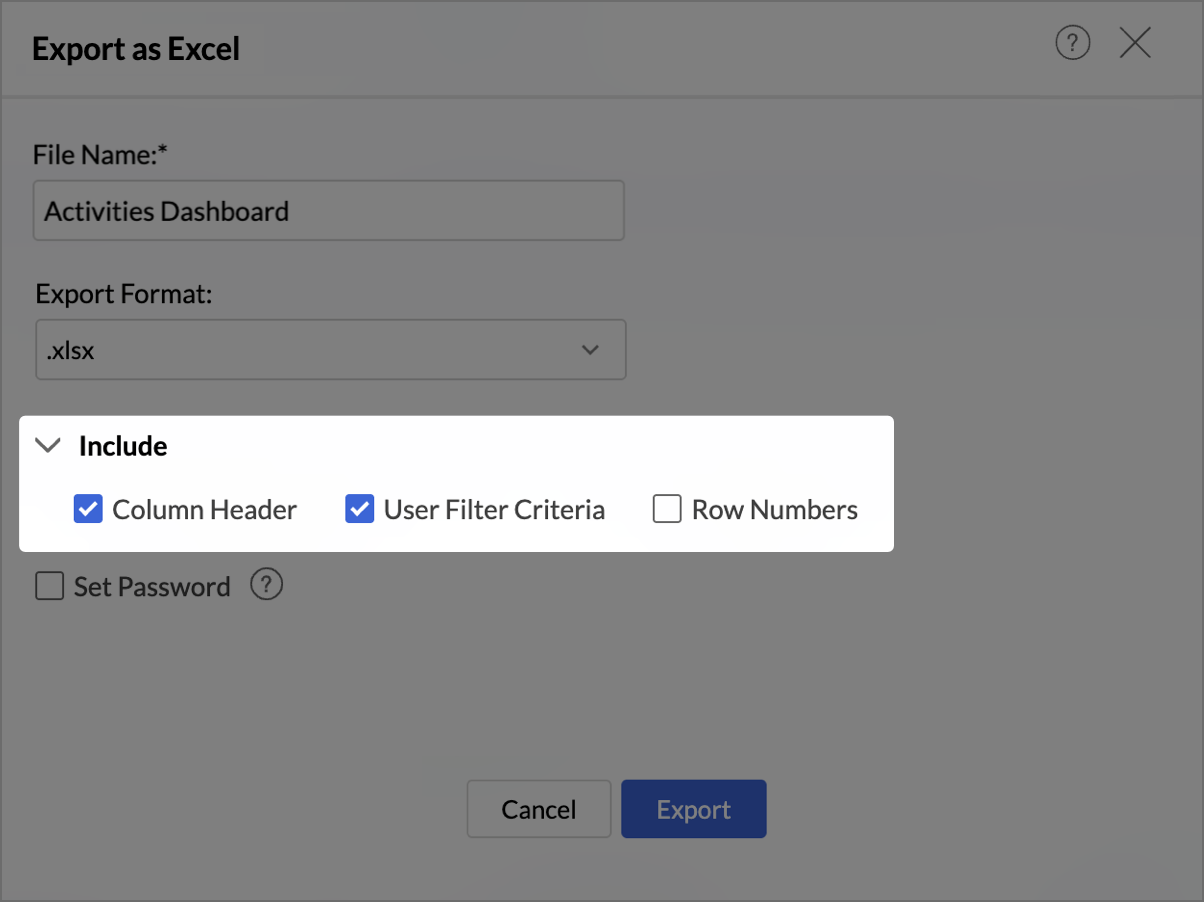
Include Options
- Column Header: Adds column names as the first row in each sheet.
- User Filter Criteria: Includes any user filters currently applied to the dashboard.
- Row Numbers: Adds a row number column to the exported data.

Note: The exported file is delivered as a ZIP archive containing the Excel file(s).
Exporting as PPT
Exporting a dashboard as a PPT creates a presentation where each view in the dashboard is placed on an individual slide. This is useful for sharing dashboards in meetings or presentations.
To export as PPT:
- Open the dashboard you want to export.
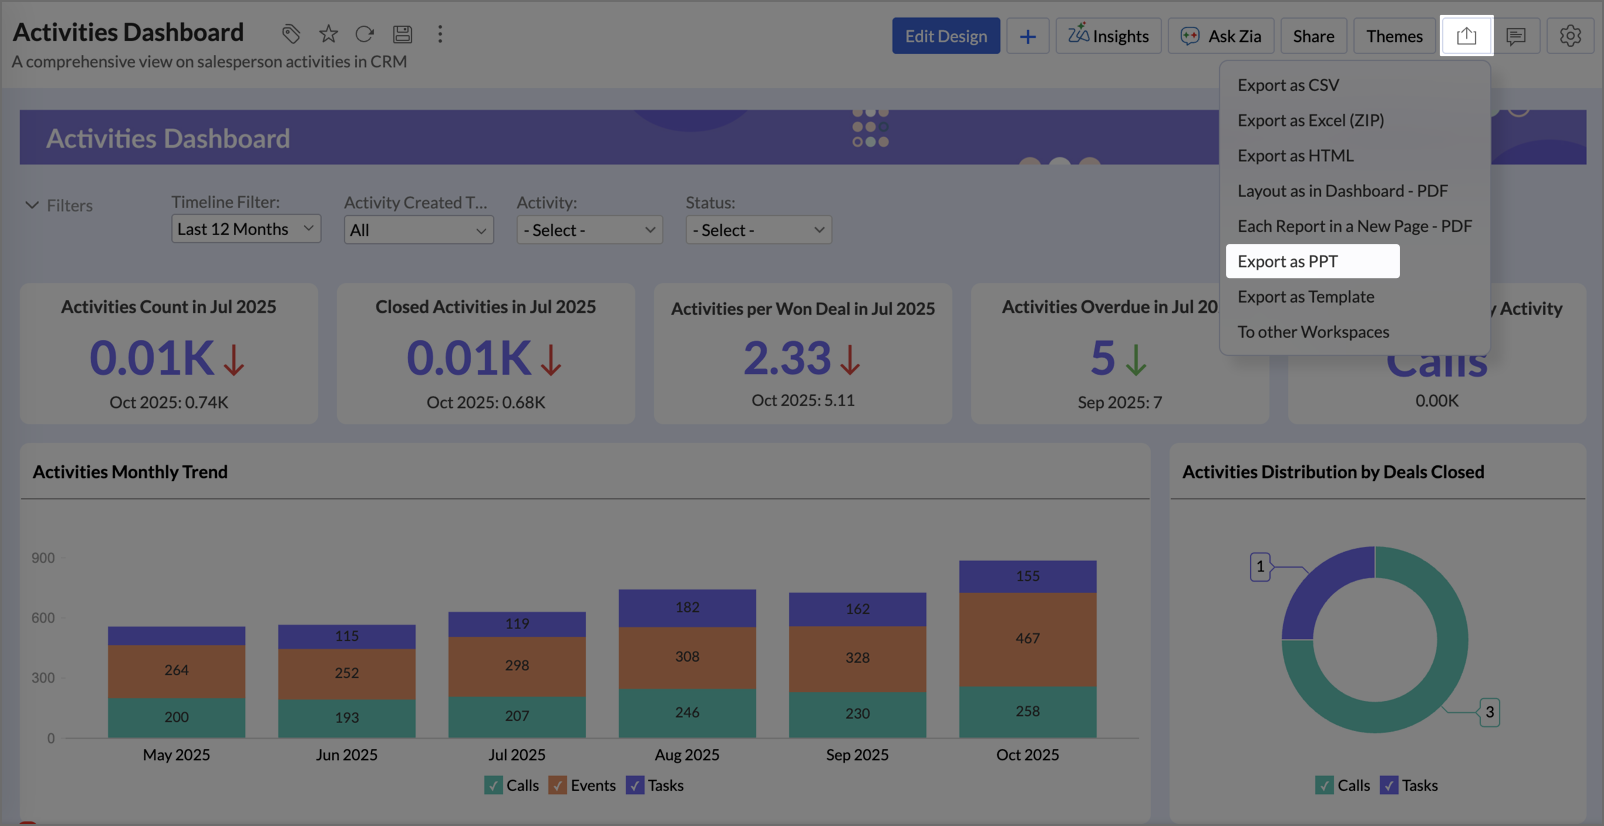
- Click the Export icon and select Export as PPT.
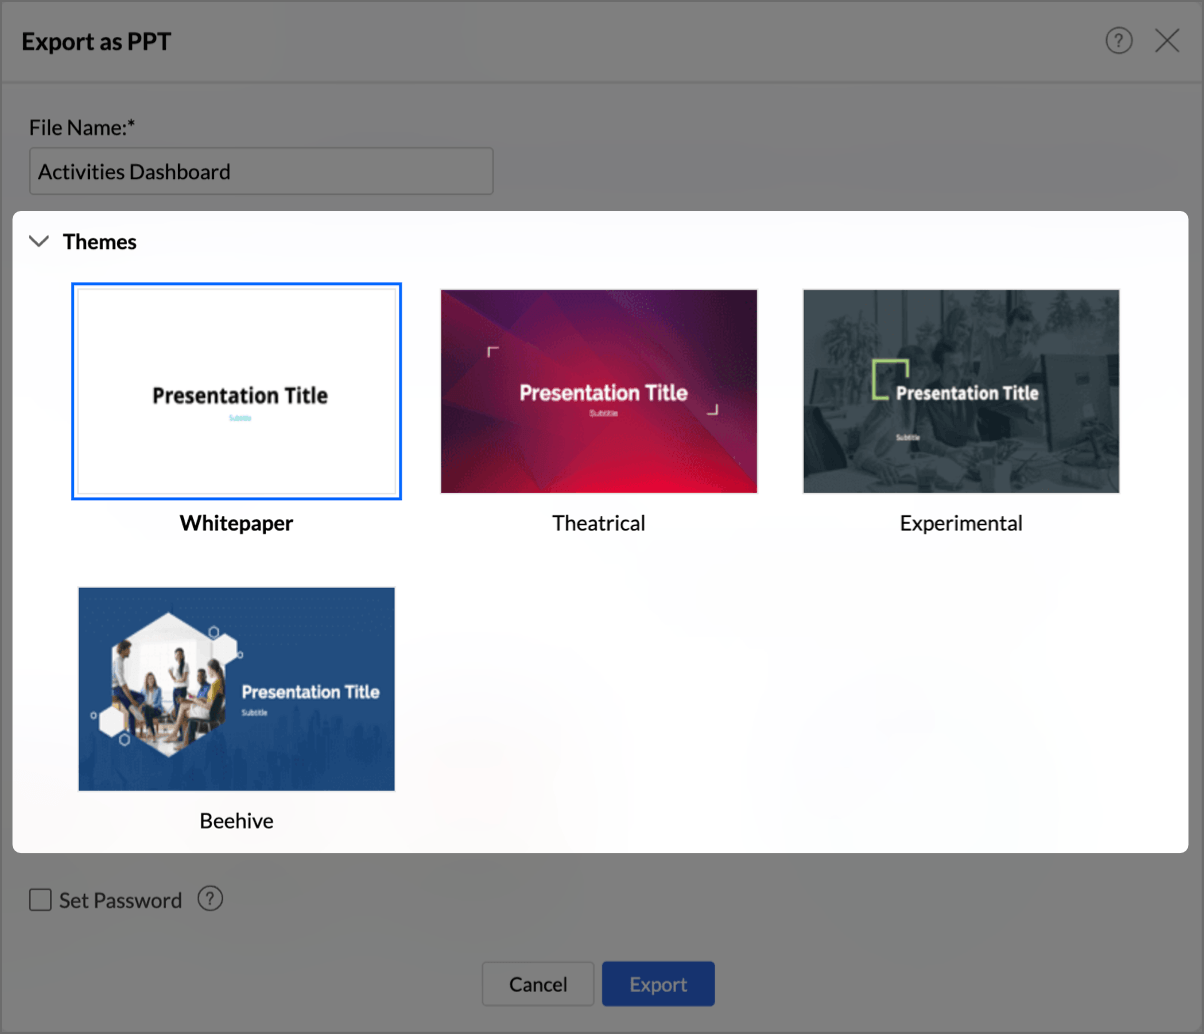
- In the Export as PPT dialog, enter a name in the File Name field.
- Click the Themes drop-down and select a template for the presentation.
- Optionally, enable password protection (see Password Protection).
- Click Export.


Note:
- Each view in the dashboard is exported as a separate slide.
- A maximum of 25 views can be exported from a single dashboard.
- For dashboards with multiple tabs, each tab is exported as a separate PPT file.
Exporting as HTML
Exporting as HTML creates a zipped HTML file of the dashboard, which can be opened in any browser without needing access to Zoho Analytics.
To export as HTML:
- Open the dashboard.
- Click the Export icon and select Export as HTML.
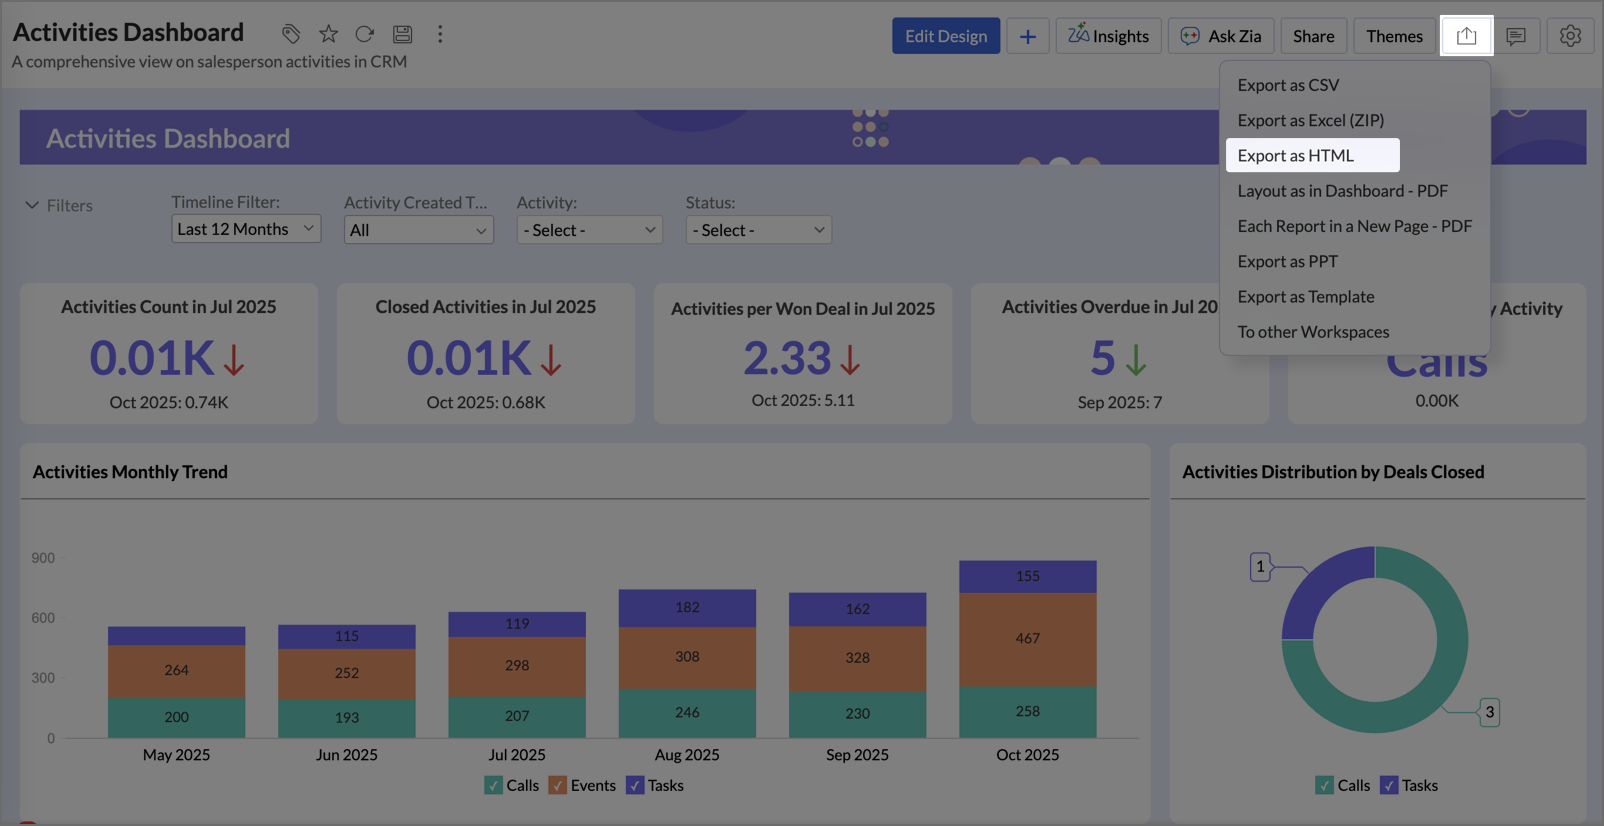
- In the Export as HTML dialog, enter a name in the File Name field.
- Configure the layout and display options as needed (described below).
- Optionally, enable password protection (see Password Protection).
- Click Export.

Layout Options
- Title and Description: Choose where the dashboard title and description appear in the exported file.
Available Options: At Top, At Bottom, or None. - Column Width Ratio: Controls how column widths are set for tabular reports. Available Options:
- Proportionate width as in the report
- Equal width for all columns
- Auto adjust based on the data
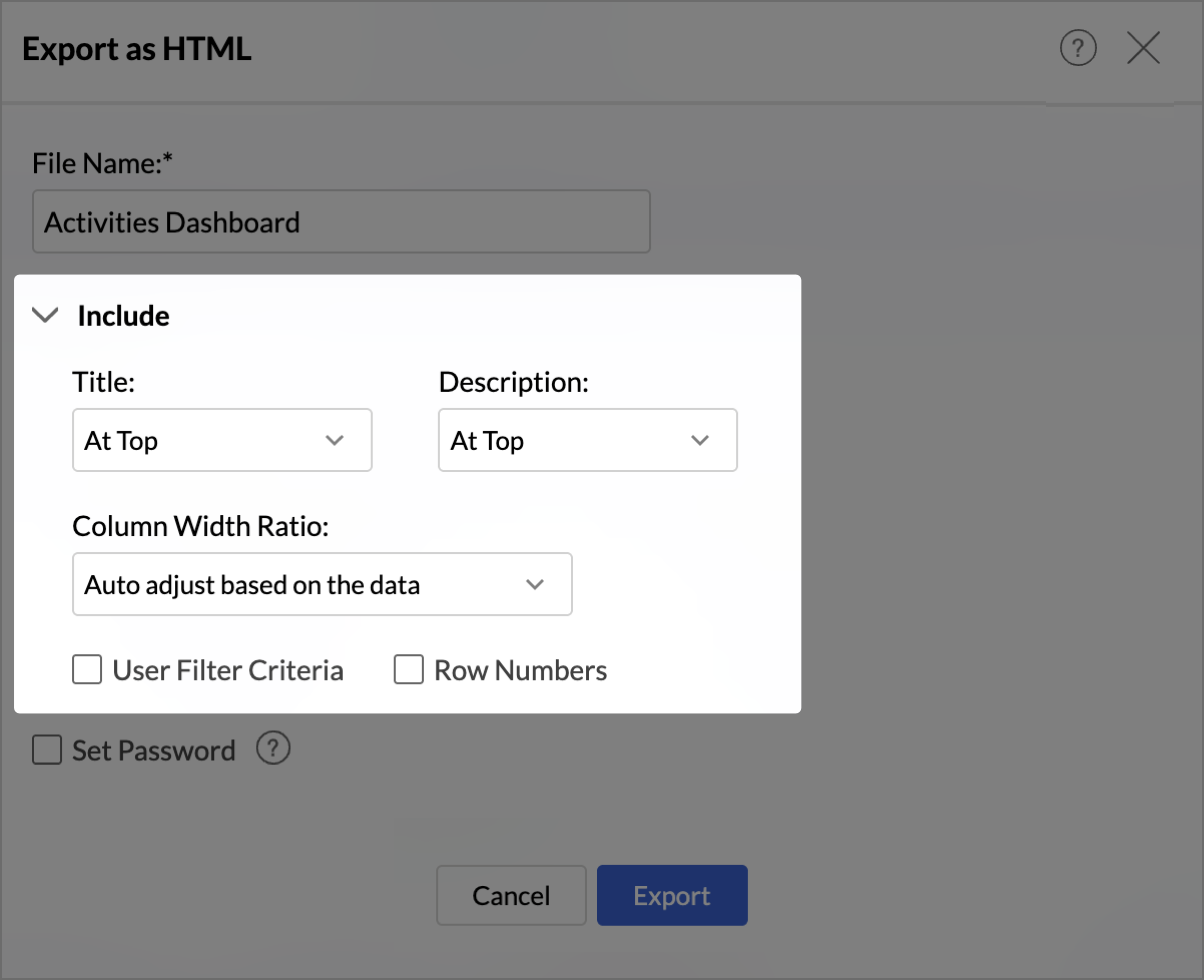

Other Options
- User Filter Criteria: Labels any user filters currently applied to the dashboard.
- Row Numbers: Includes row numbers in tabular reports.
Exporting as PDF
Zoho Analytics supports two PDF export layouts, each suited for different types of dashboards. Both are accessible from the Export icon.
Layout as in Dashboard
This layout exports the dashboard as it visually appears preserving the arrangement and positioning of all widgets and charts.
Note: This layout is optimized for dashboards containing charts and KPI widgets. Exporting dashboards with large table-based reports in this layout may fail.
To export with Layout as in Dashboard:
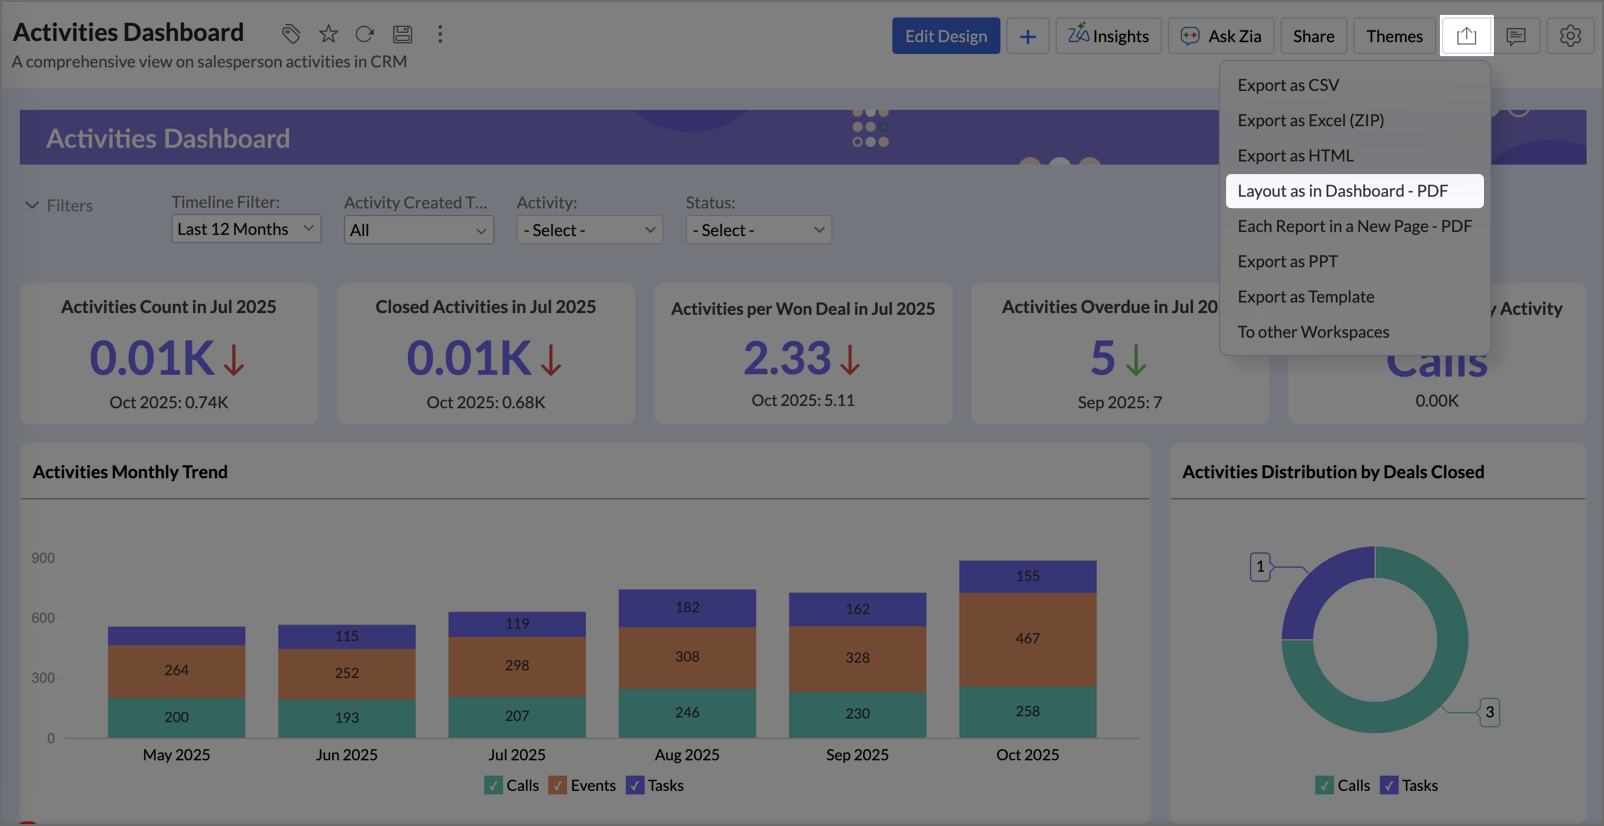
- Open the dashboard.
- Click the Export icon and select Layout as in Dashboard – PDF.
- In the Export as PDF dialog, enter a name in the File Name field.
- Configure the settings as needed (described below).
- Optionally, enable password protection (see Password Protection).
- Click Export.
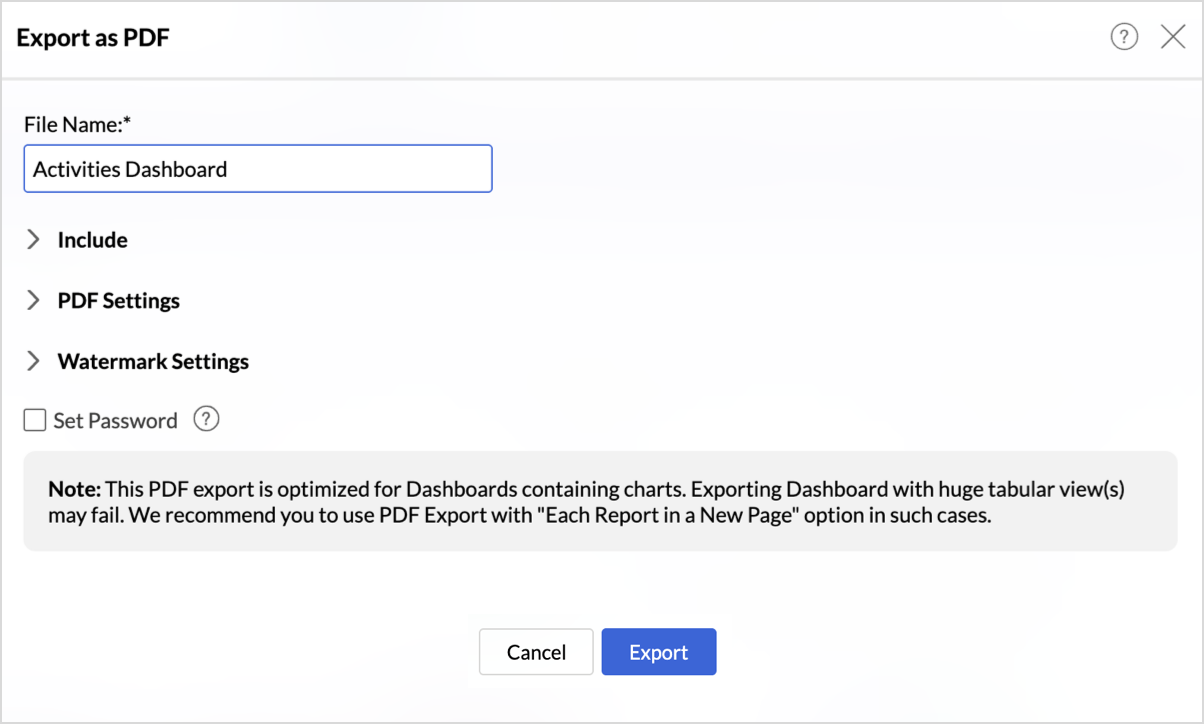


Settings
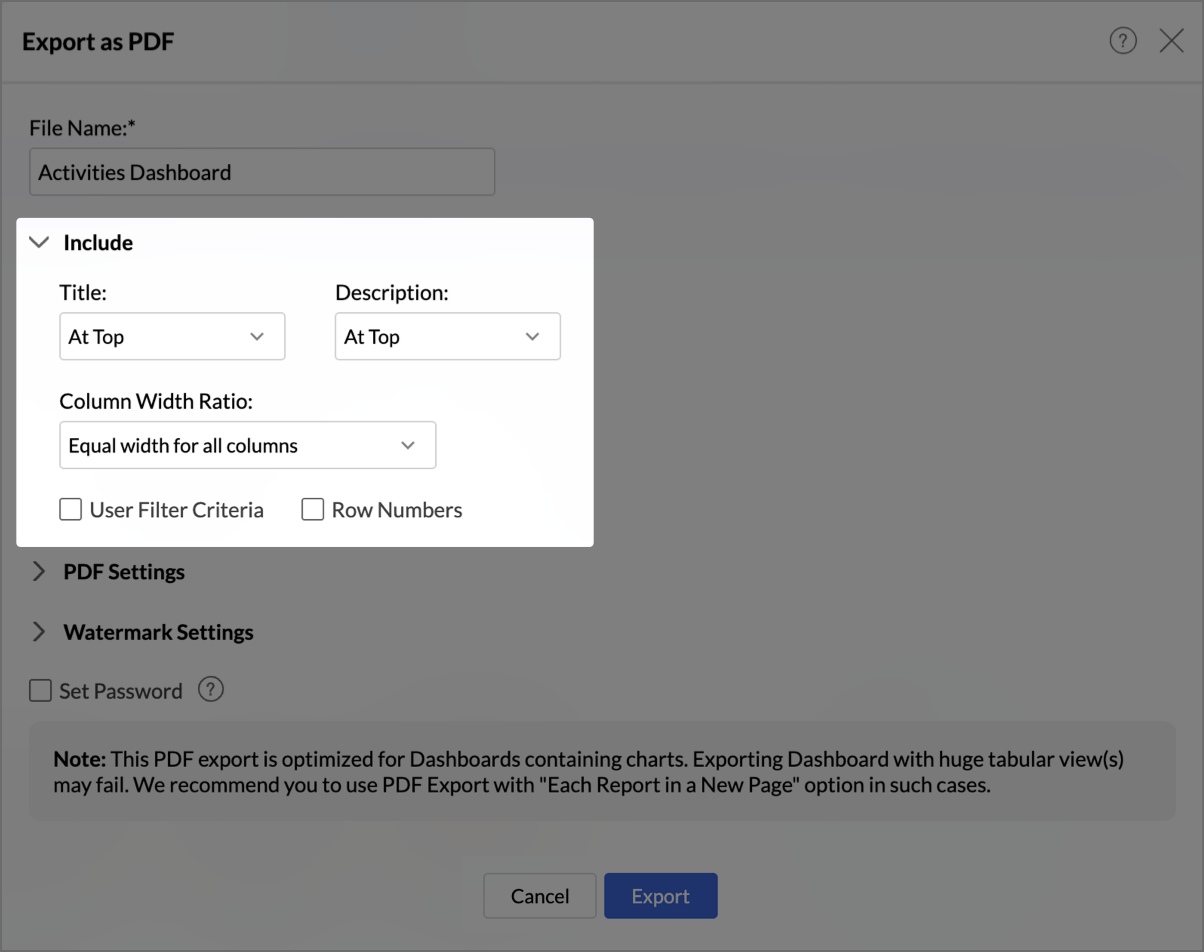
Include Options
- Title and Description: Choose where the title and description appear: At Top, At Bottom, or None.
- Column Width Ratio: Set how column widths are handled for tabular reports: Proportionate, Equal, or Auto.
- User Filter Criteria: Labels any applied user filters.
- Row Numbers: Includes row numbers in tabular reports.

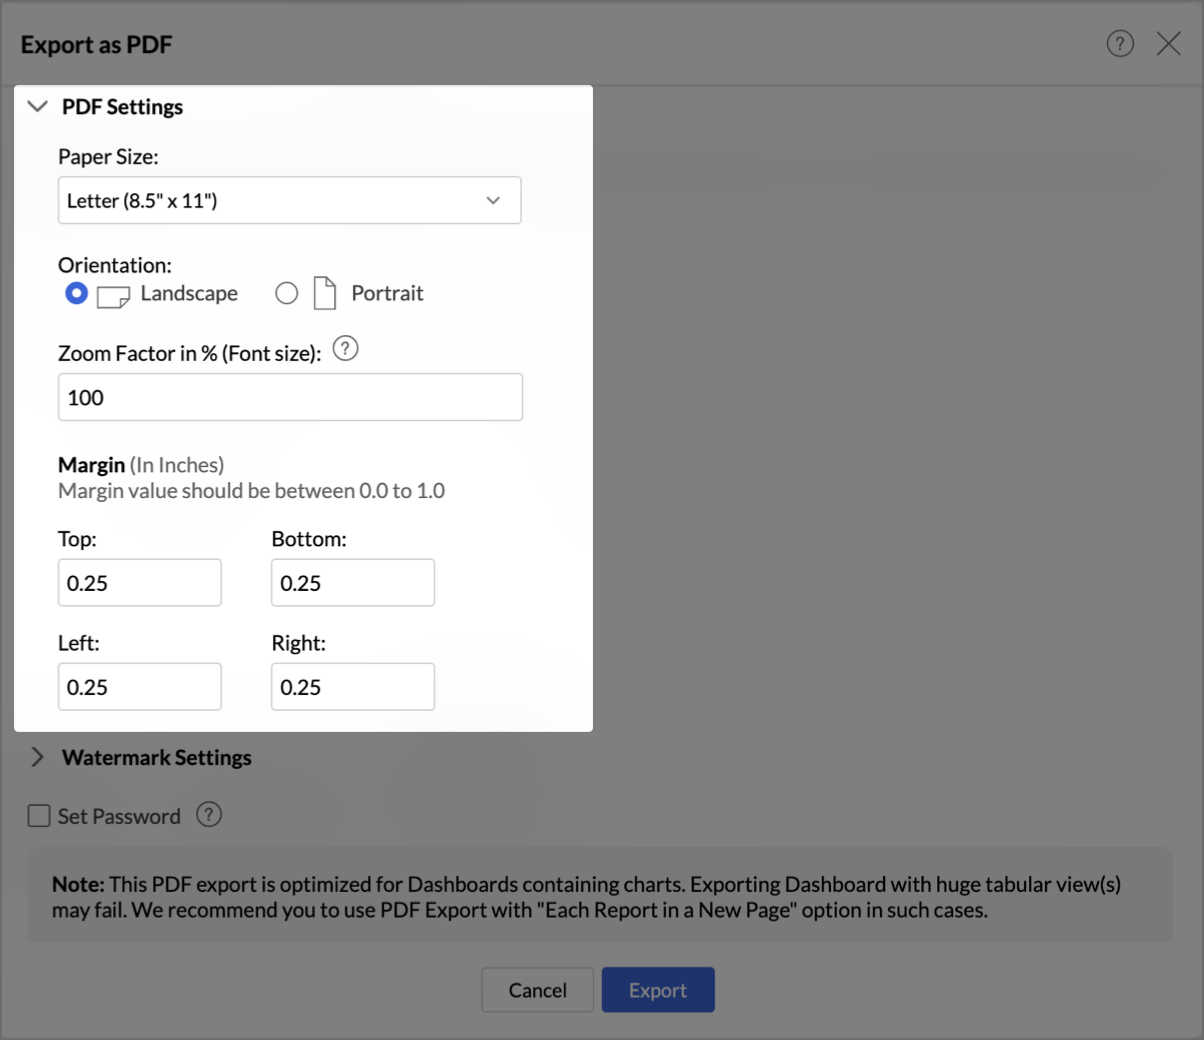
PDF Settings
- Paper Size: Choose from Letter (8.5"×11"), Legal (8.5"×14"), Tabloid (11"×17"), A3, A4, or Auto (sized by column count).
- Orientation: Set as Portrait or Landscape.
- Zoom Factor: Adjusts the font size percentage to improve readability.
- Margin: Set the page margin in inches. Accepted range: 0.0 to 1.0.

Each Report in a New Page
This layout exports the dashboard in a single-column format, with each report placed on a new page. It is the recommended layout for dashboards with tabular reports or when you need a more document-like output.
This layout supports the following additional capabilities:
- Table of Contents
- Header and Footer on each page
- Larger file sizes
- Display of filter criteria applied at both the dashboard and report level
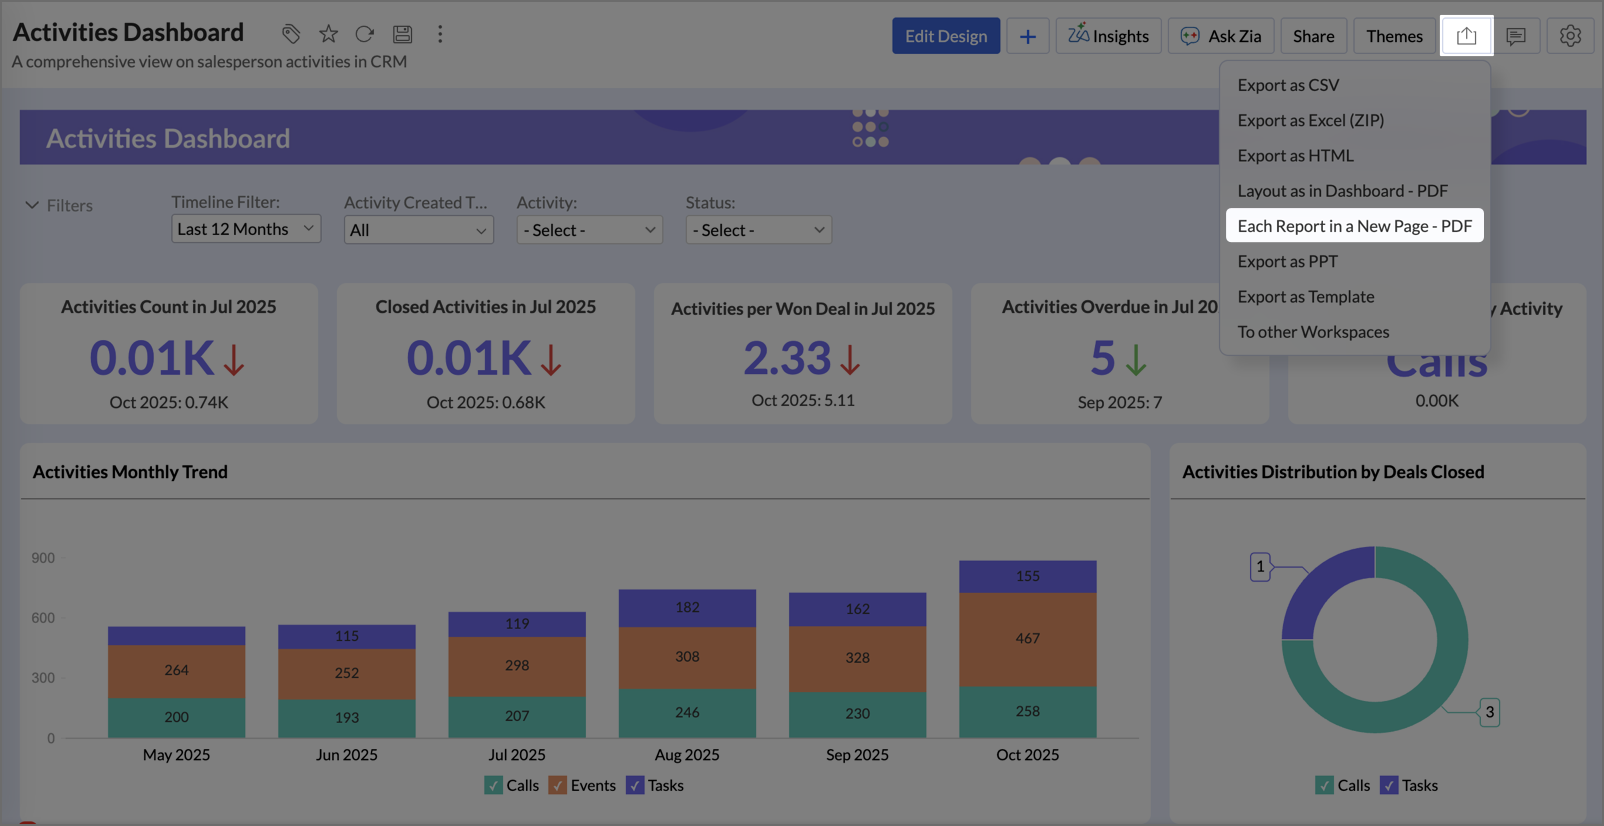
To export with Each Report in a New Page:
- Open the dashboard.
- Click the Export icon and select Each Report in a New Page – PDF.
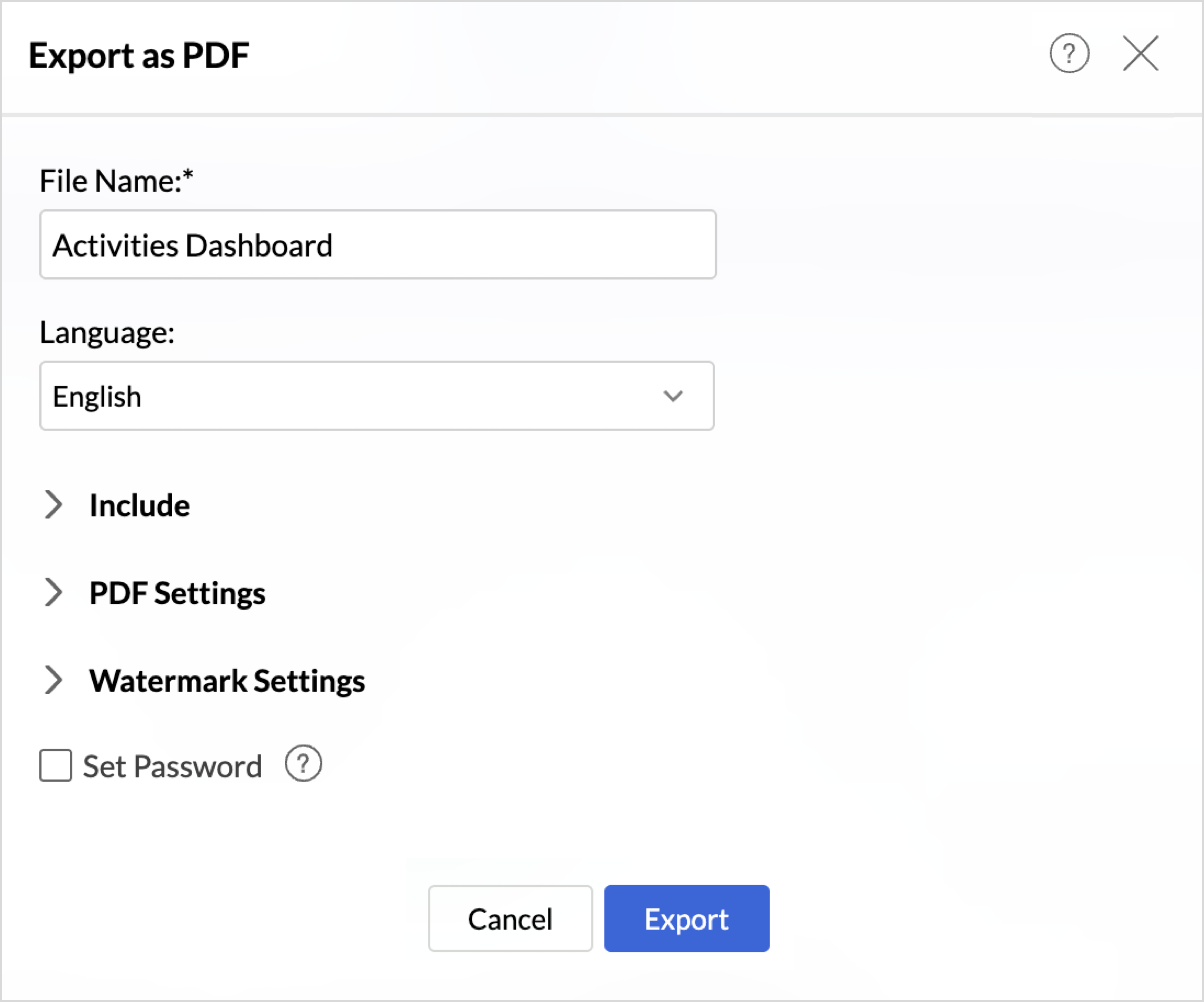
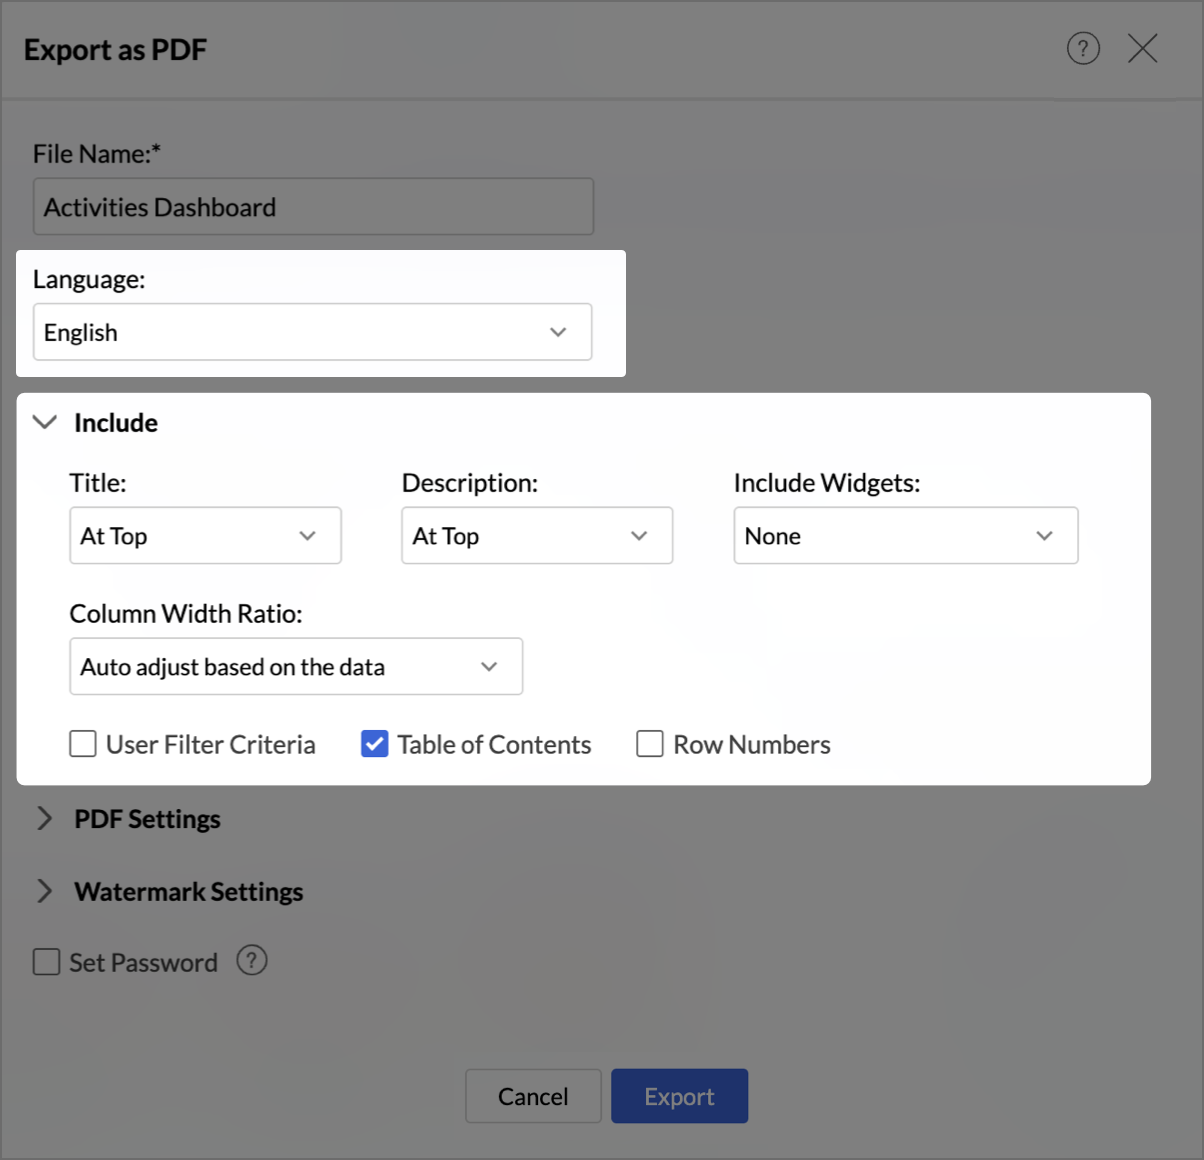
- In the Export as PDF dialog, enter a name in the File Name field.
- Configure the settings as needed (described below).
- Optionally, enable password protection (see Password Protection).
- Click Export.


Settings
Include Options
- Language: Select the language for the exported PDF.
Supported options: English, Chinese, Japanese, European, Korean, Arabic, Hebrew. - Title and Description: Choose where the title and description appear - At Top, At Bottom, or None.
- Include Widgets: Choose how widgets are handled in the export:
- None: Widgets are not included.
- Each in new page: Each widget is placed on a new page.
- Associate to nearest report: Each widget is grouped with its nearest report.
- Column Width Ratio: Set how column widths are handled: Proportionate, Equal, or Auto.
- User Filter Criteria: Labels any applied user filters.
- Table of Contents: Includes a table of contents in the exported PDF.
- Row Numbers: Includes row numbers in tabular reports.

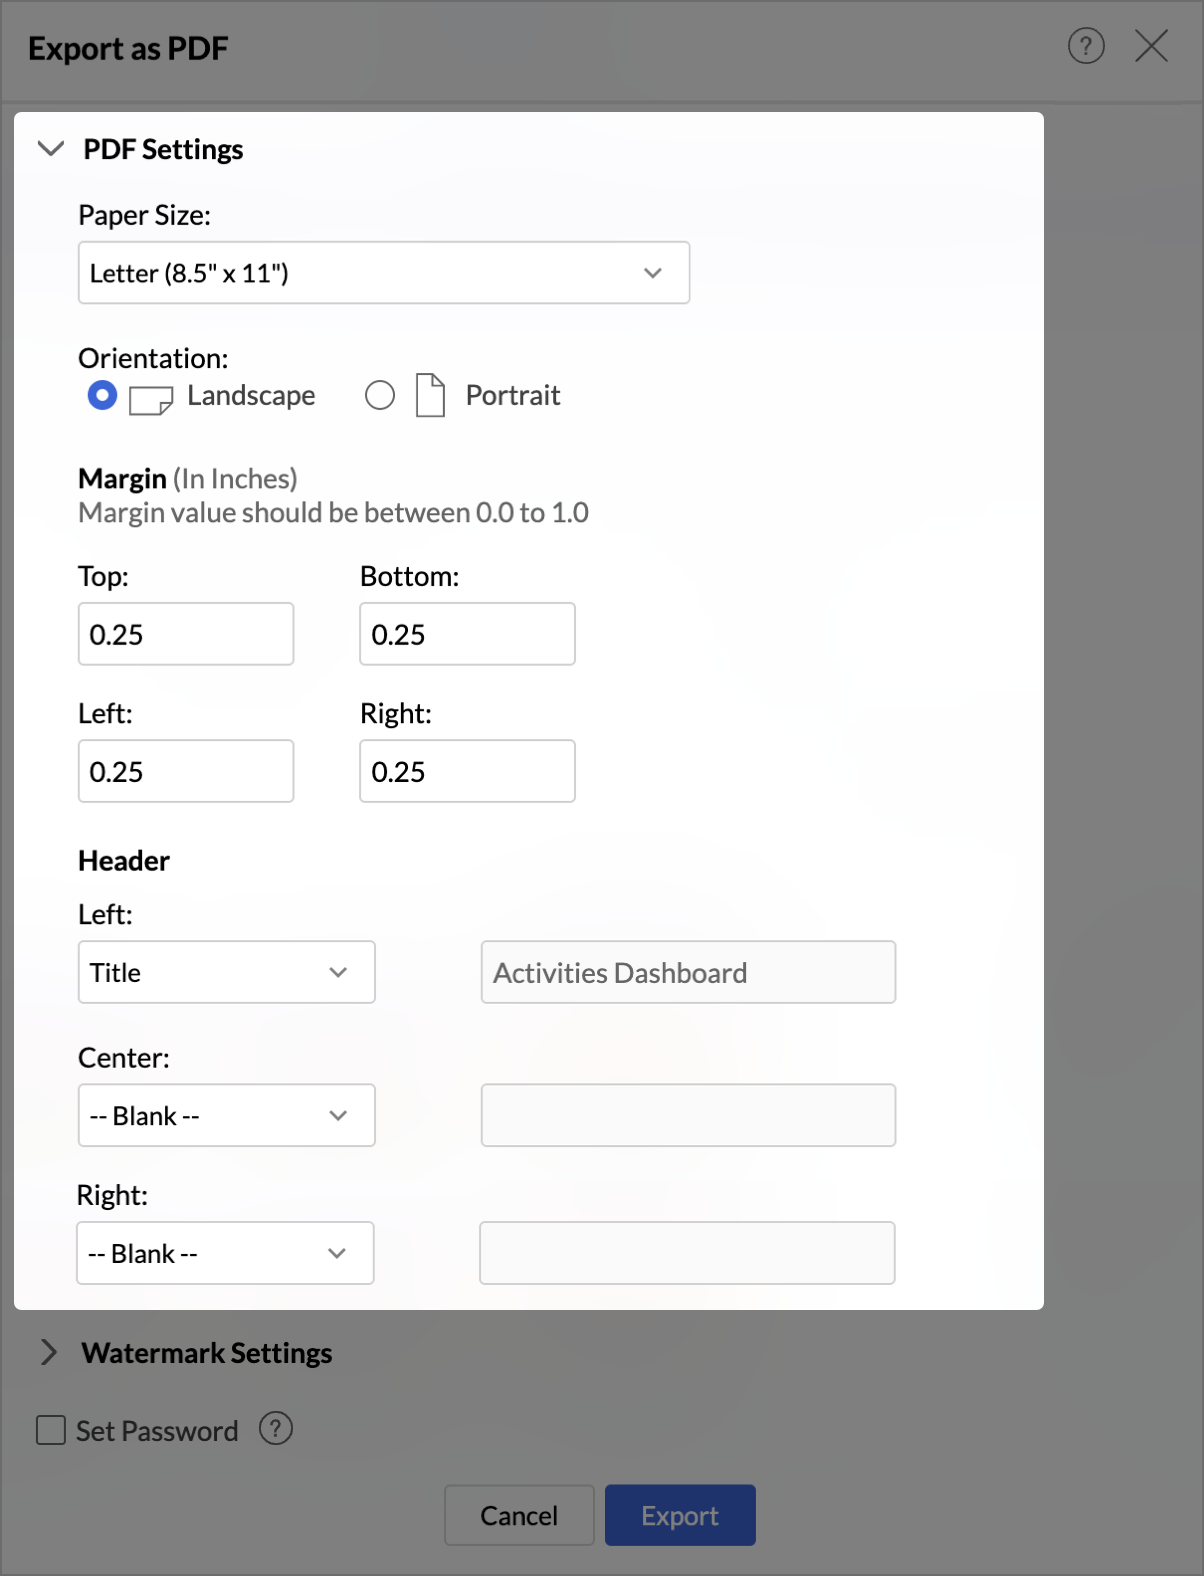
PDF Settings
- Paper Size: Choose from Letter, Legal, Tabloid, A3, A4, or Auto.
- Orientation: Set as Portrait or Landscape.
- Margin: Set the page margin in inches. Accepted range: 0.0 to 1.0.
- Header and Footer: Each page can include a header and footer. Both have three sections — Left, Center, and Right — each of which can independently display one of the following:
- Blank
- Title
- Date & Time
- Page #
- Page # of #
- Custom Text

Password Protection
All export formats support password protection. To secure an exported file:
- In the export dialog, select the Set Password checkbox.
- Enter and confirm the password in the provided fields.
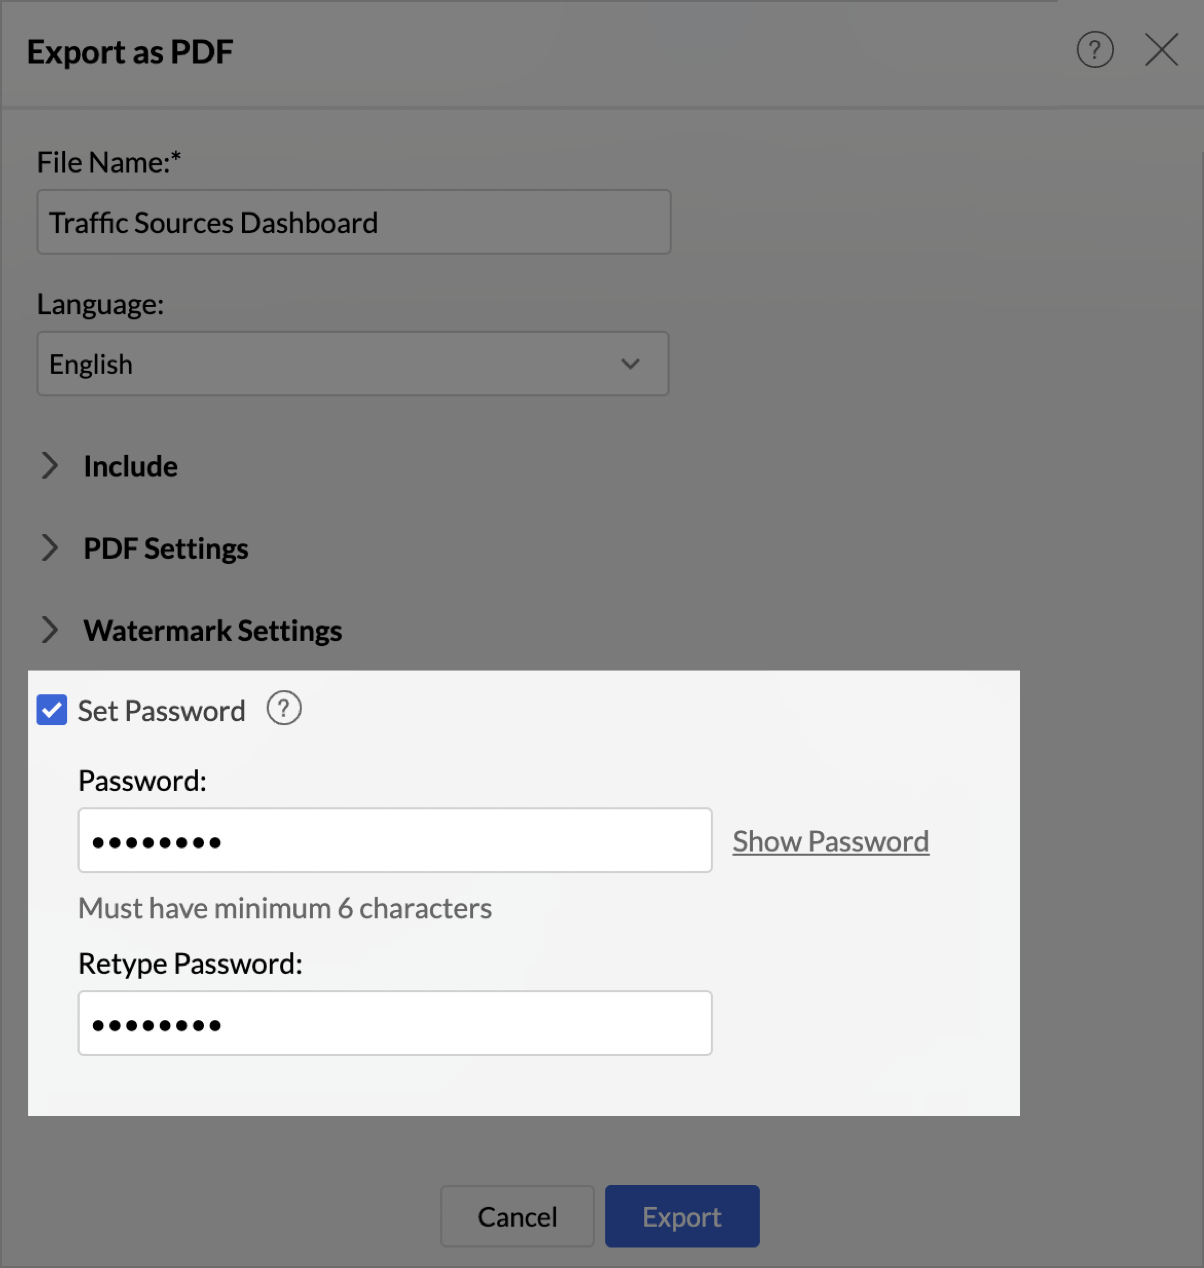
- Proceed with the export as usual.

The recipient will need to enter the password to open the exported file.
Adding a Watermark
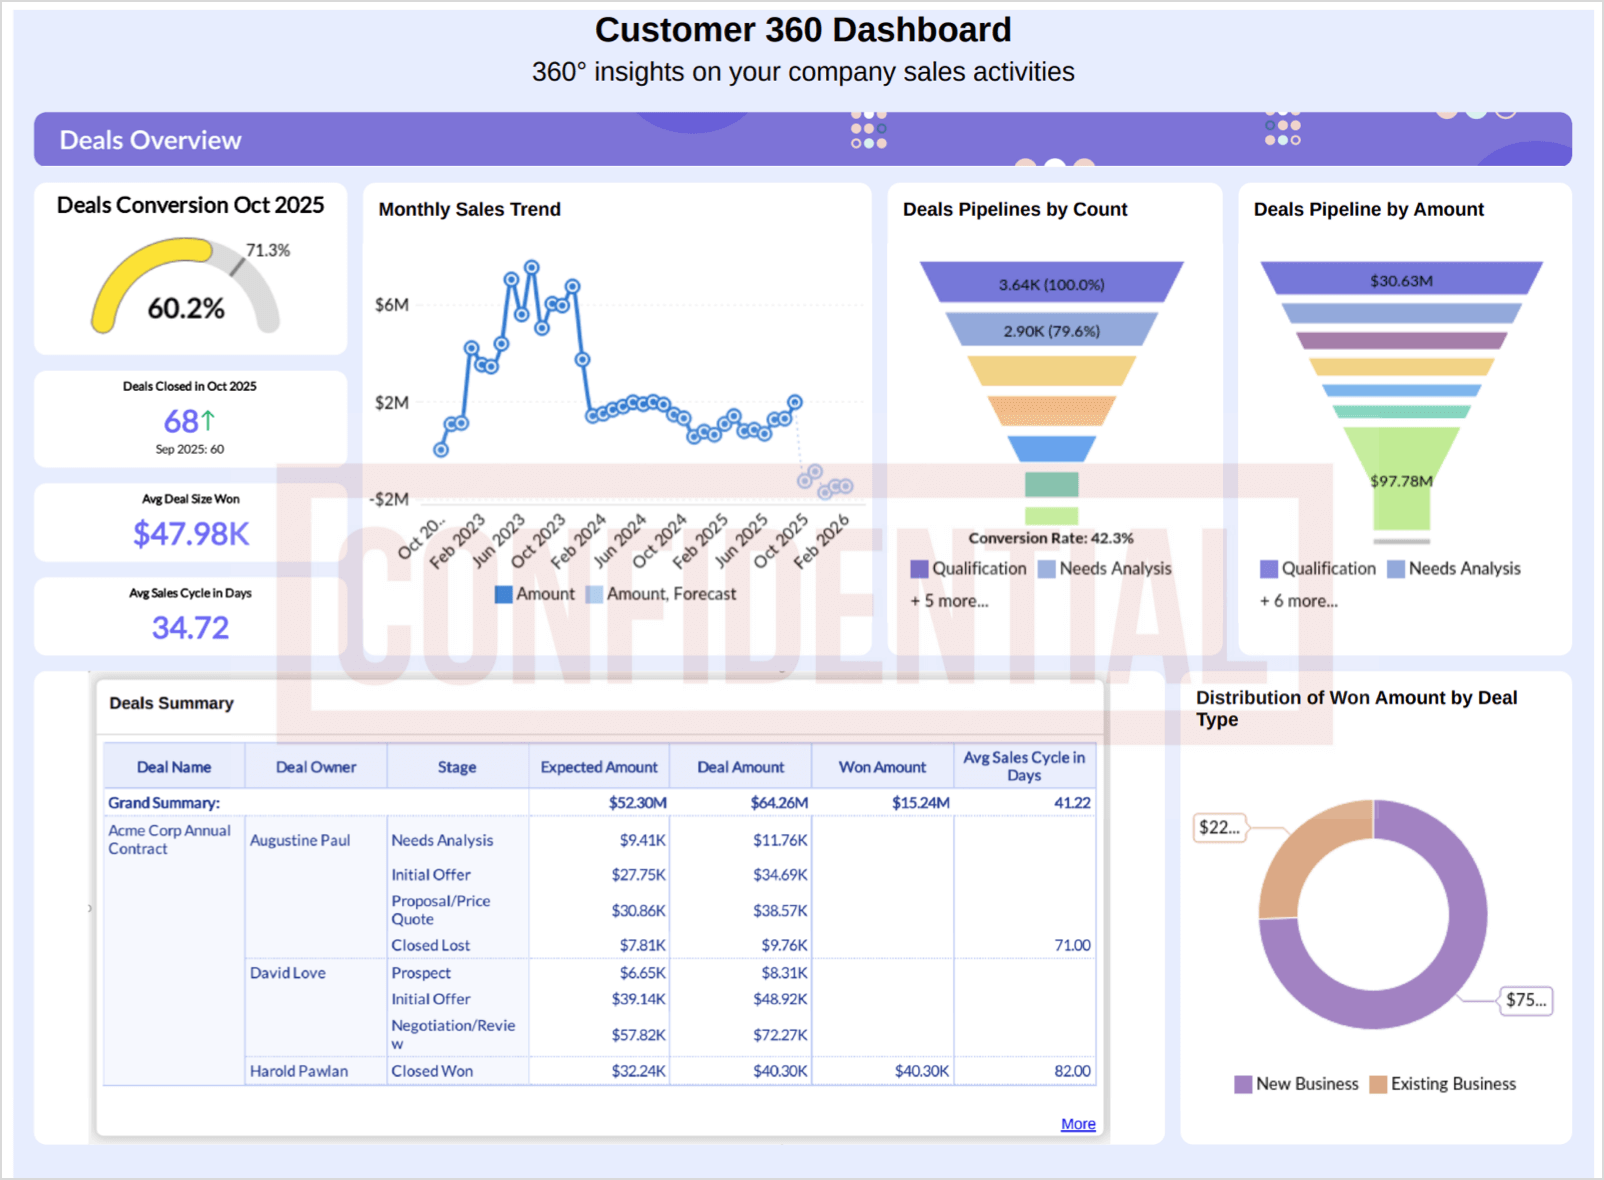
When exporting dashboard as PDF (either layout), you can add a watermark to establish ownership or enhance the visual presentation of the exported file. Watermarks can be text or image-based and are fully customizable.
Text Watermark
- In the Export as PDF dialog, go to Watermark Settings.
- Select Text.
- Enter the watermark text in the Text as Watermark field.
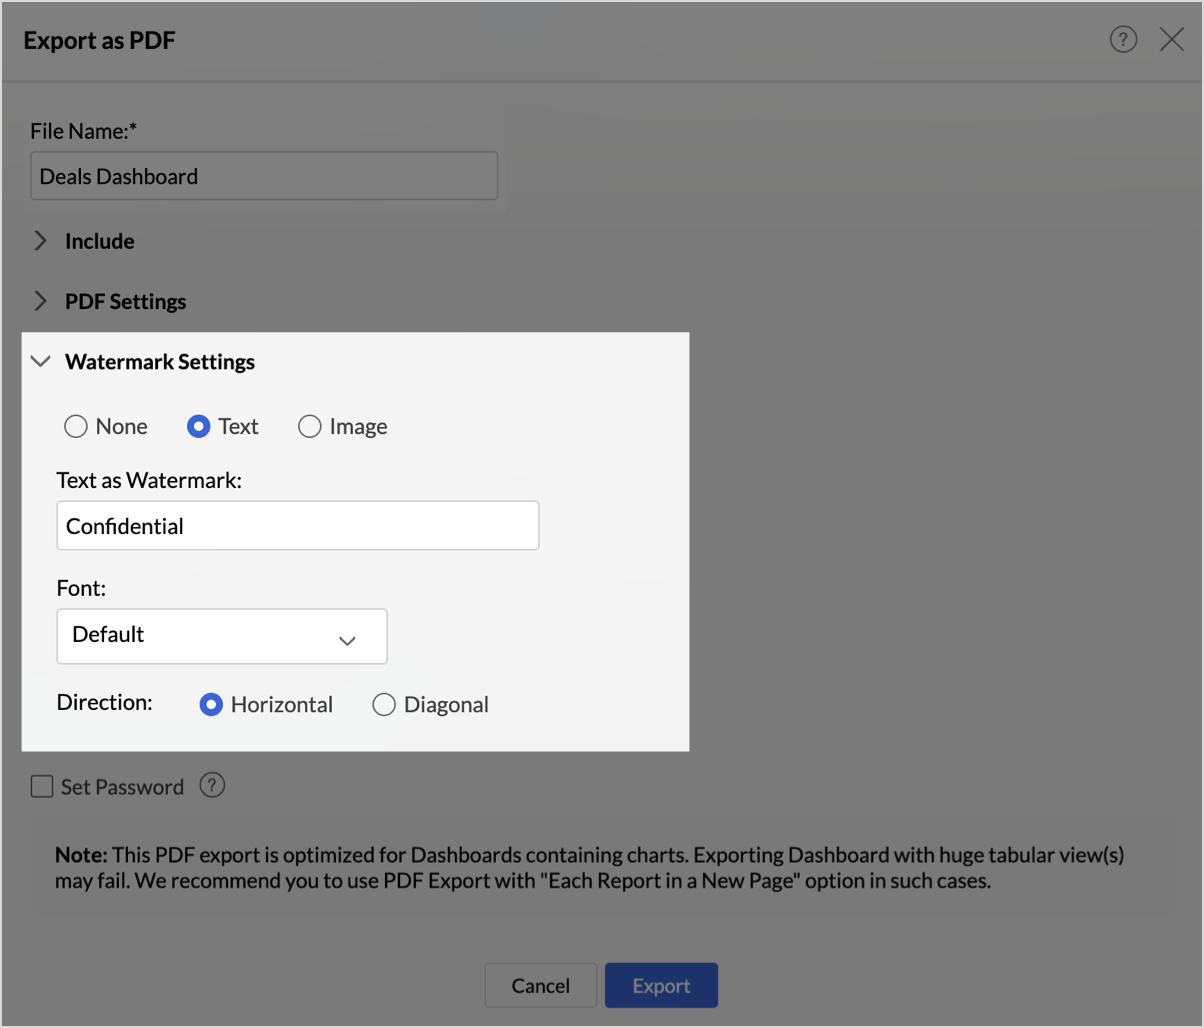
- Customize the font style, size, and formatting as needed.
- Set the Direction: Horizontal or Diagonal.
- Click Export.
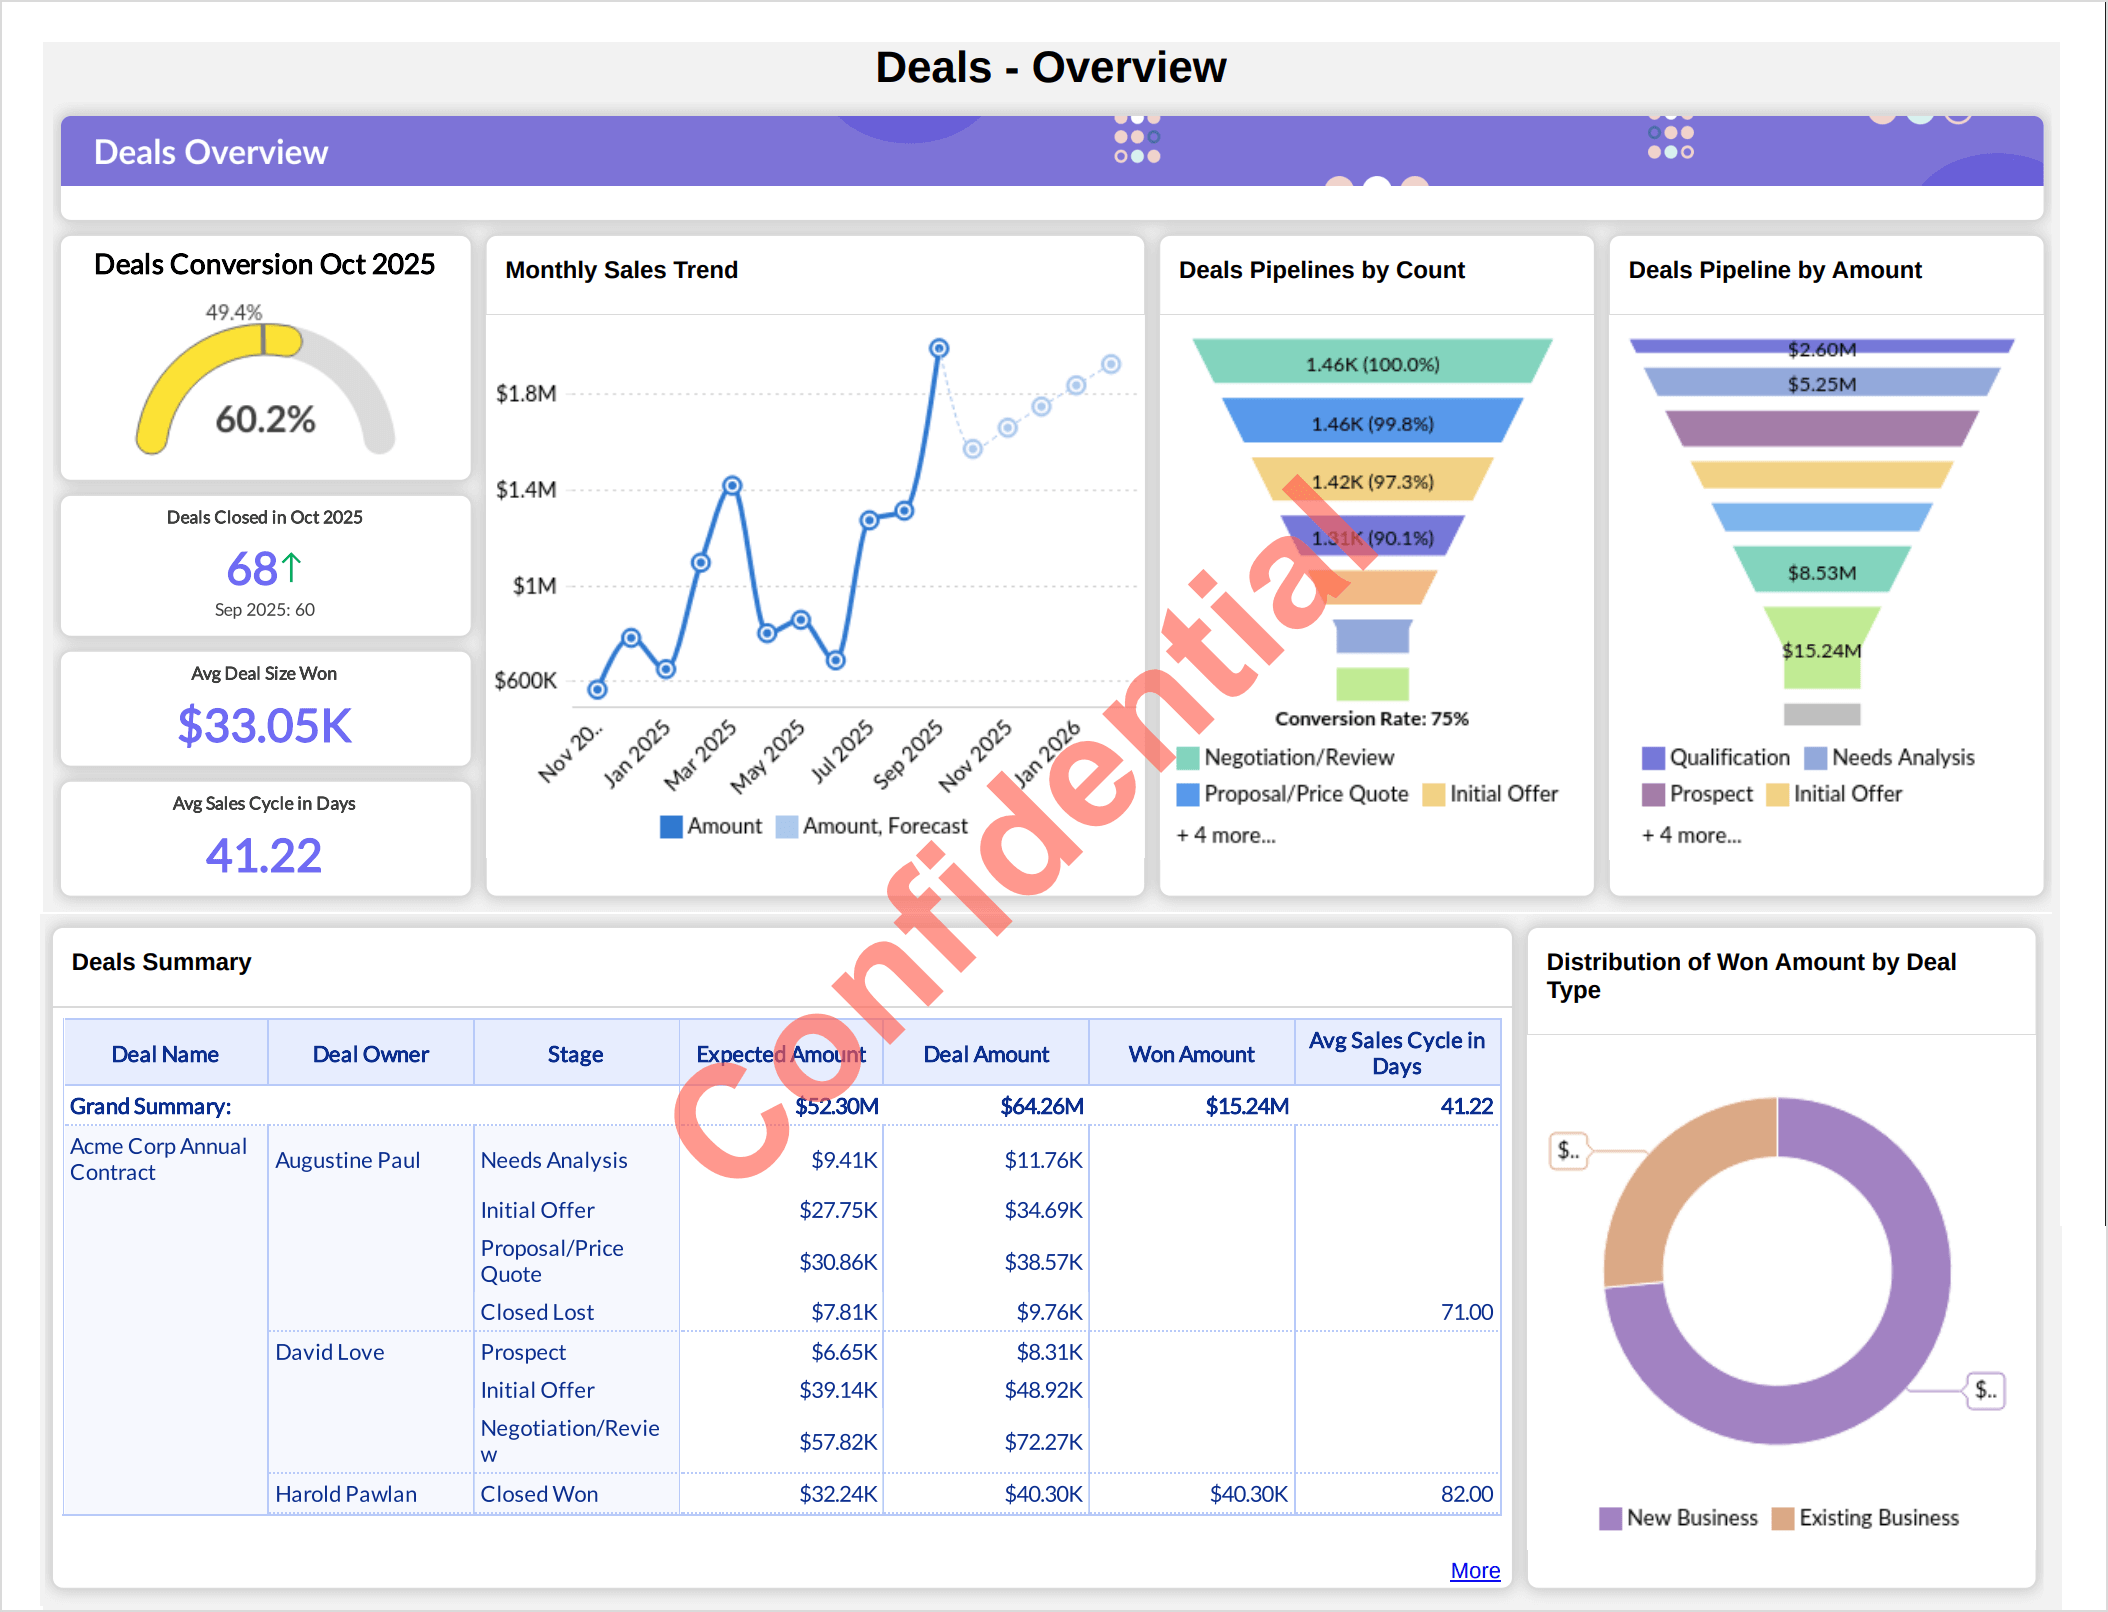


Image Watermark
- In the Export as PDF dialog, go to Watermark Settings.
- Select Image.
- Click Add Image and upload the image file.
Supported formats: .jpeg, .jpg, .png.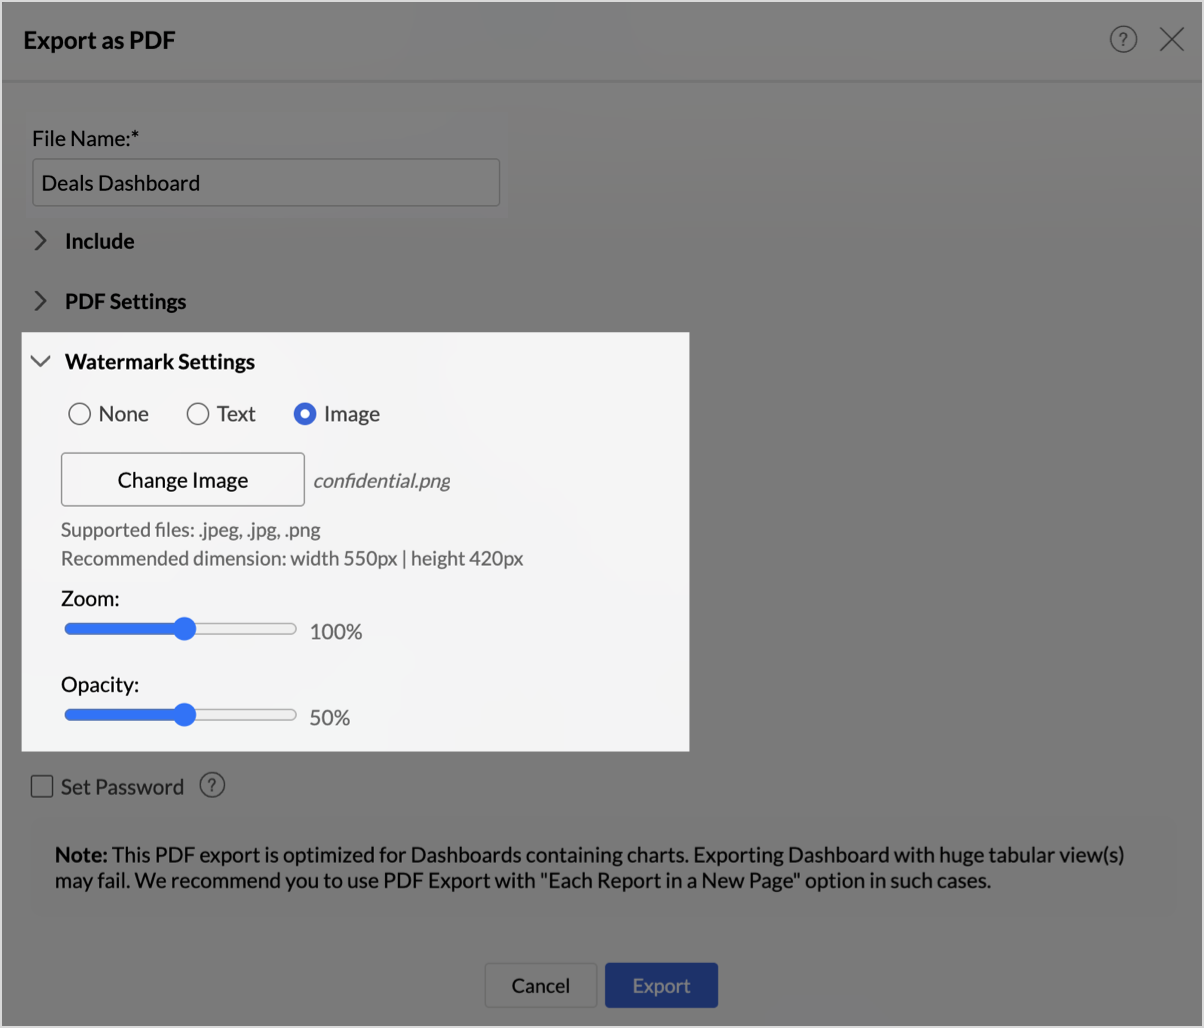
- Use the Zoom slider (0–200%) to adjust the image size.
- Use the Opacity slider (0–100%) to control the watermark's transparency.
- Click Export.


To replace the image, click Change Image. To remove it, click the remove icon next to the uploaded file name.
Other Export Options
In addition to file-based exports, Zoho Analytics provides two options to export dashboards within the platform itself - as a reusable template or directly into another workspace. Unlike the file export formats, they transfer the structure and design of your dashboard for reuse elsewhere in Zoho Analytics.
Exporting as a Template
Exporting as a template saves the design and layout of your dashboard, including reports and tables as a reusable .atpt file, without including the underlying data. This is useful when you want to replicate a consistent dashboard structure across different teams or departments without rebuilding it from scratch. You can import the template into another workspace to maintain a uniform layout and design across multiple dashboards.
To learn more, refer to the Export as Template documentation.
Exporting to Other Workspaces
Exporting to other workspaces lets you copy the design blueprint of your dashboard along with its associated reports and data models, directly into another workspace within Zoho Analytics. This is ideal when you have a similar data structure in another workspace and want to avoid recreating views manually. You can export to workspaces across your own or shared organizations, provided you have administrator privileges in the destination workspace.
To learn more, refer to the Export to Other Workspaces documentation.