Create Business Dashboards Online in Minutes
Business dashboards are a very useful tool for visualization and analysis of data. Create insightful business dashboards and track your key performance indicators (KPIs) using our online dashboard creator. Share your dashboards with colleagues for easier data analysis and collaboration.
Sign up in less than 60 seconds

Track key metrics with insightful business dashboards
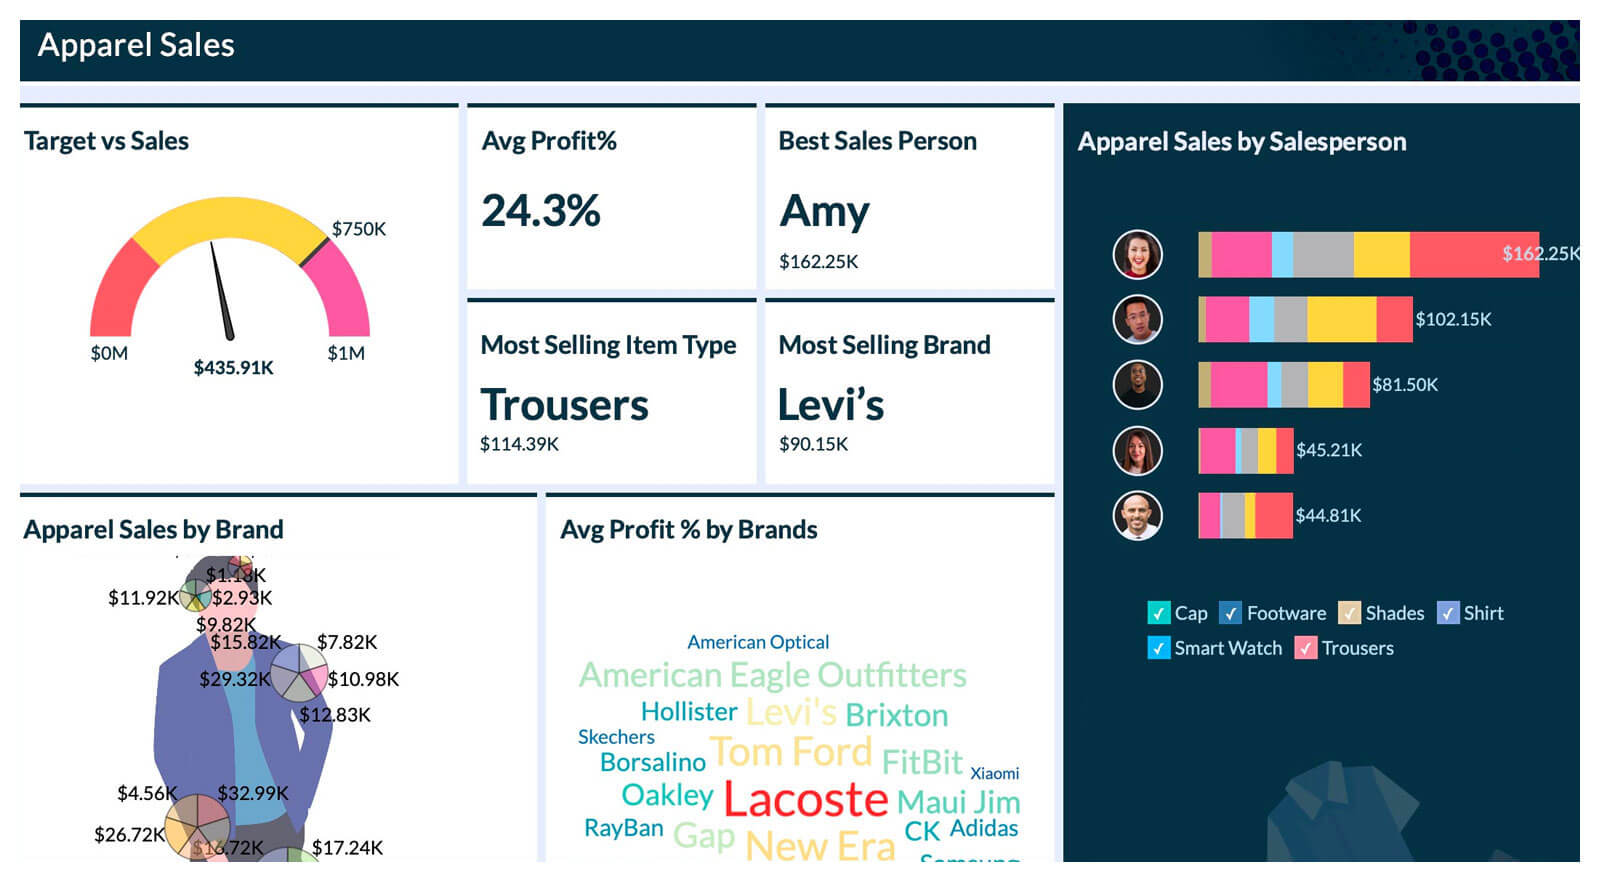
Create insightful KPI reports and BI dashboards by using a variety of visual elements like charts, widgets, pivots, summaries, and tables etc.,offered by any business intelligence software. Enrich your business dashboards with diverse data visualization elements to boost insights consumption and streamline decision-making.
Key features of our business dashboard software
Create professional business dashboards with ease
Build powerful business analytics dashboards in a flash with our easy-to-use drag-and-drop dashboard maker. Leverage powerful reporting components to create dashboards that provide valuable insights!
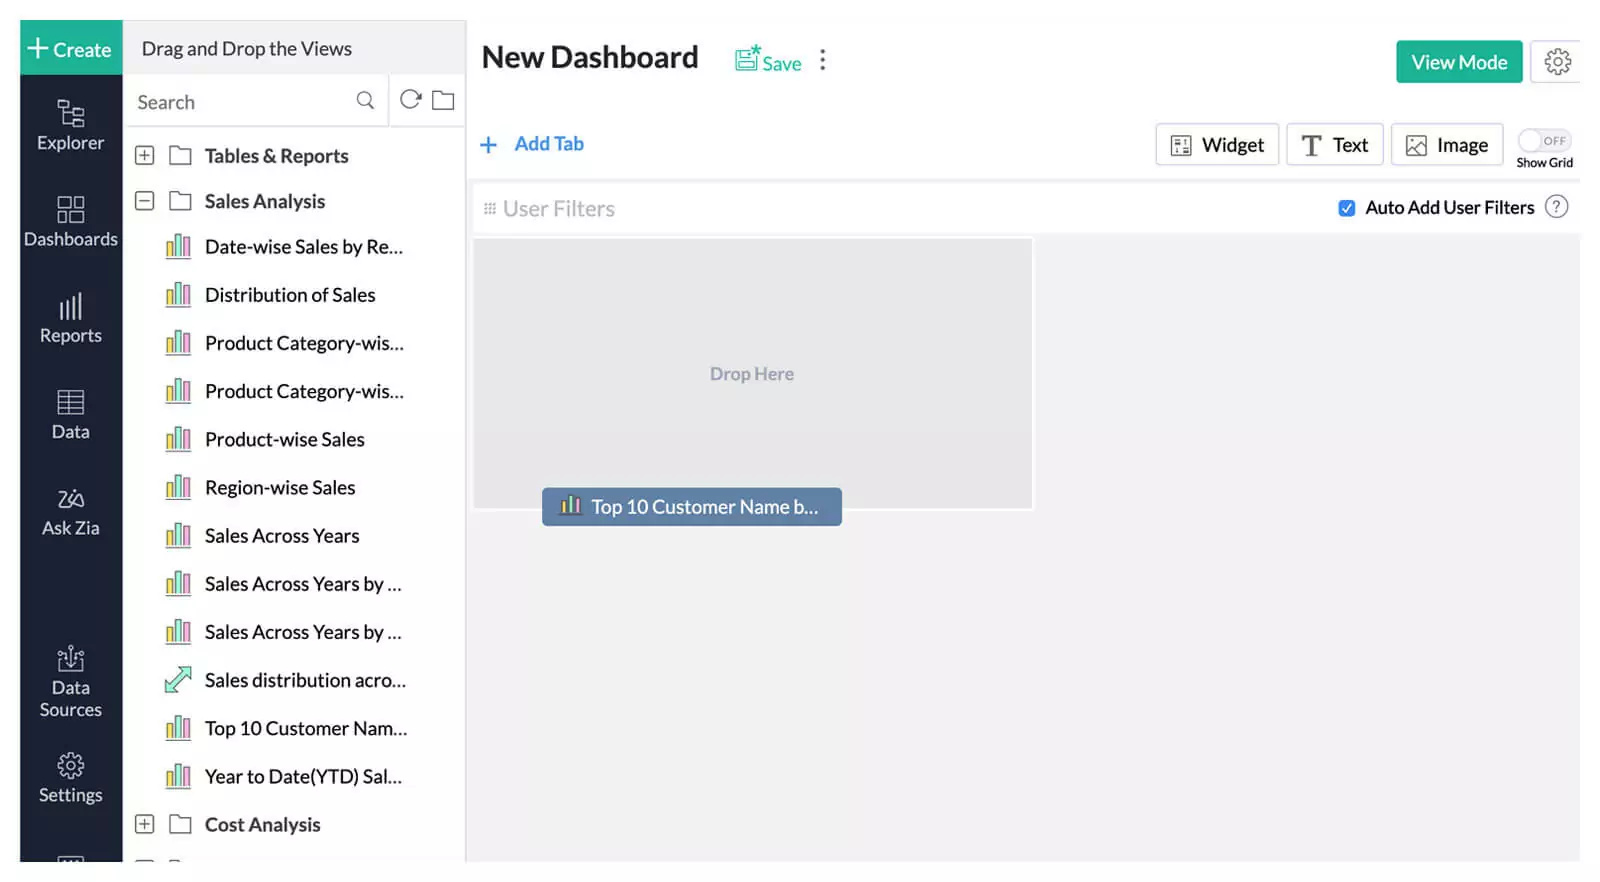
Wide range of reporting components
Use a variety of charts, pivot tables, KPI widgets, and tabular view components to create your dashboards online. Drill down into interactive dashboards for the insights you need.
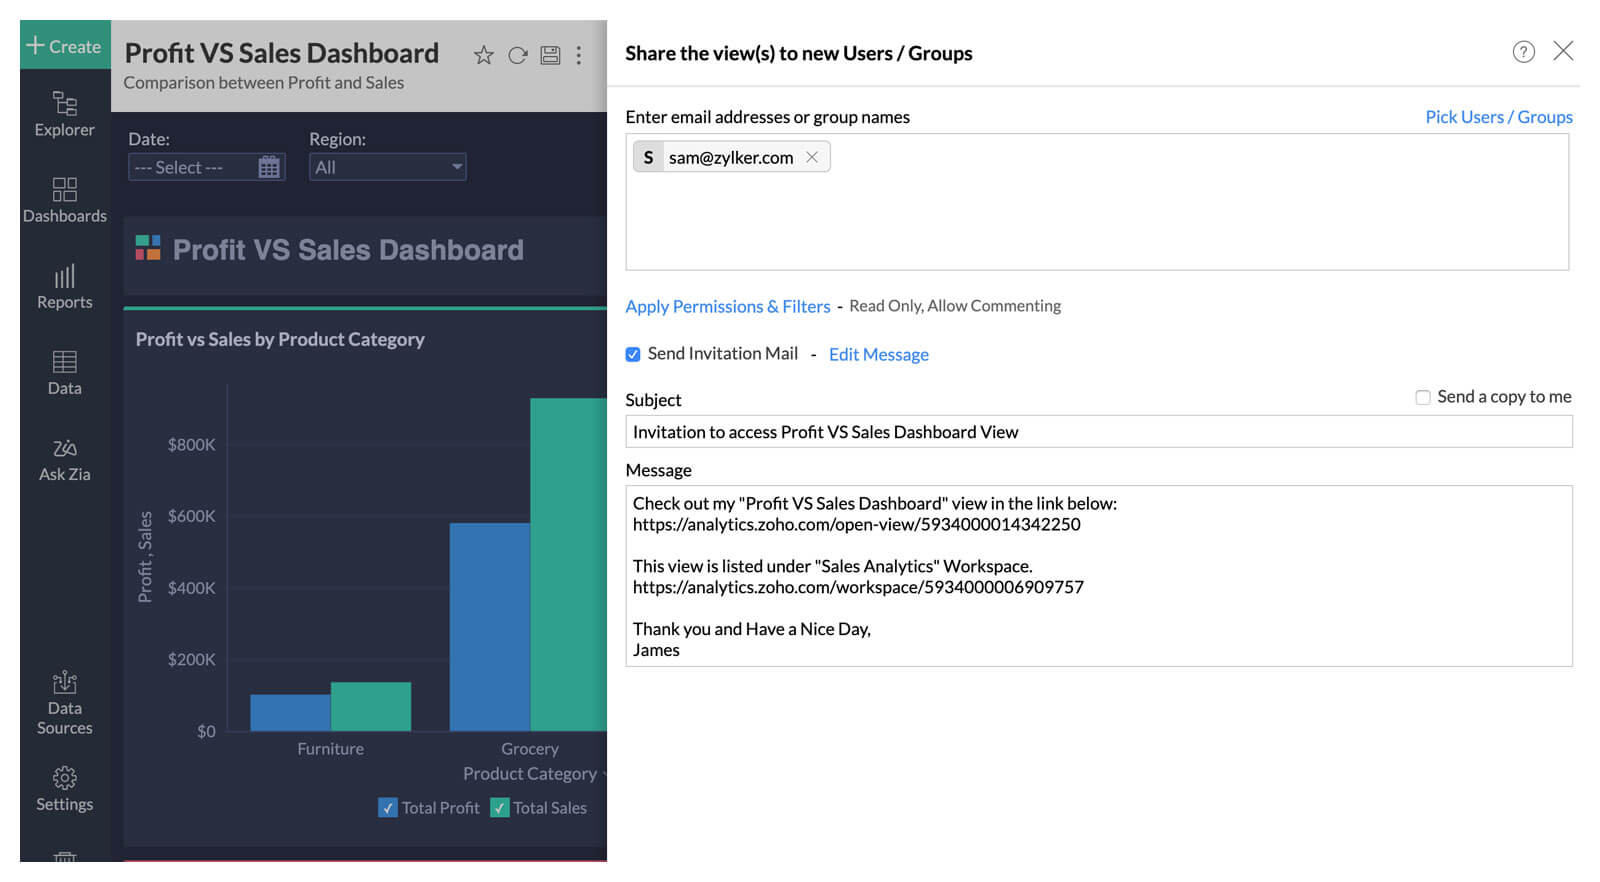
Share and embed
Collaborate on dashboard creation and make more informed decisions as a team, with our business dashboard software. Embed them across various online platforms for mass consumption and provide fine-grained access control.
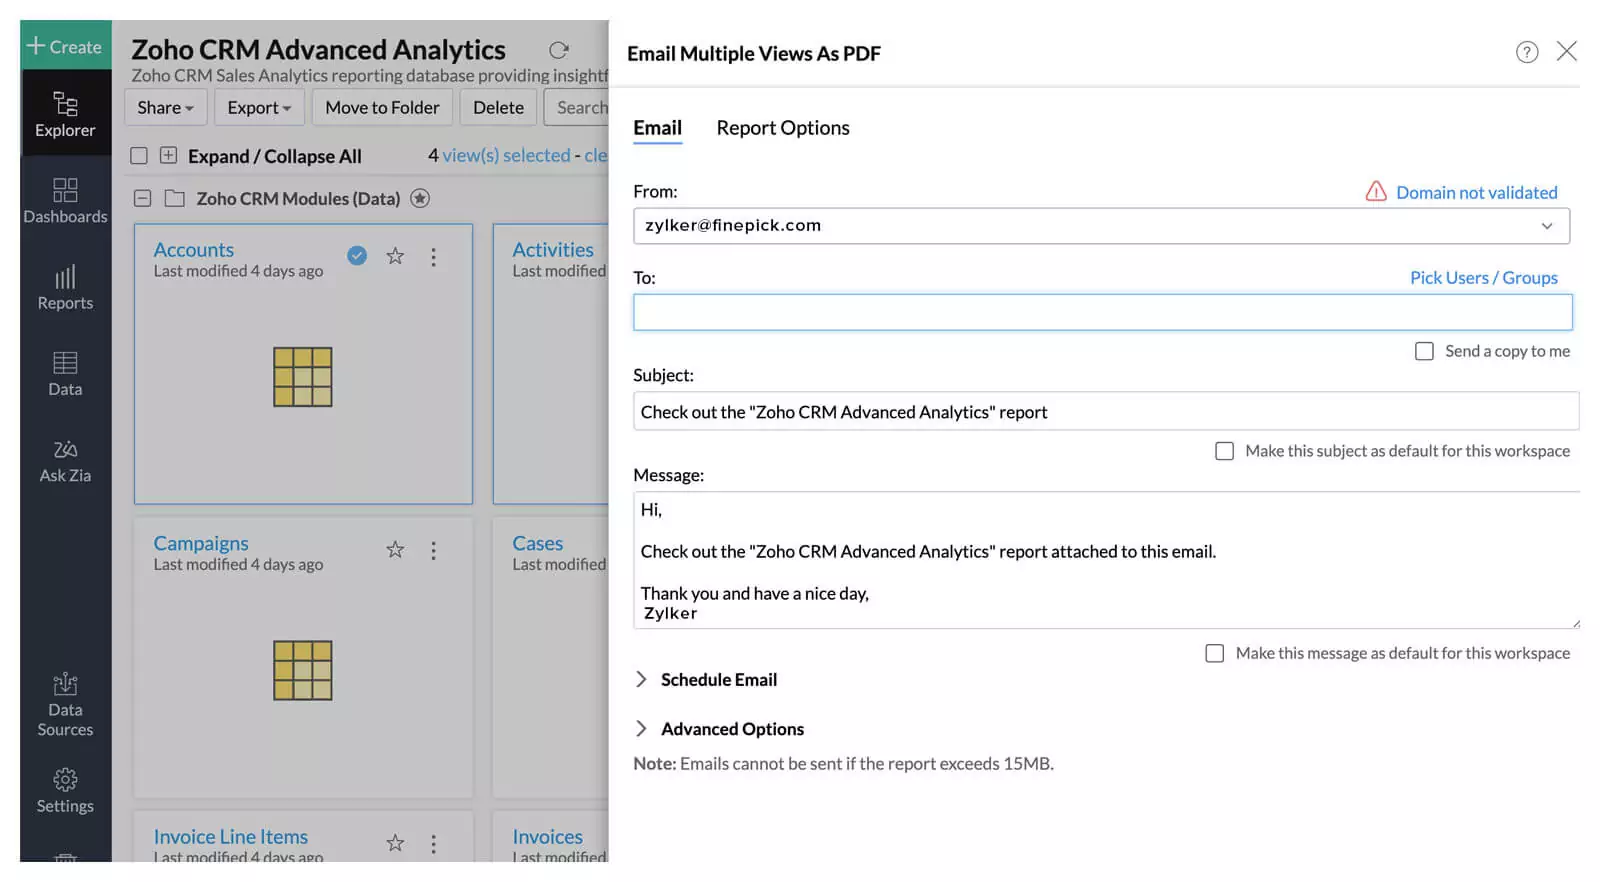
Export and email dashboards across teams
Schedule your dashboards to be emailed automatically. Export or print dashboards using our online dashboard creator, for offline access. Share reports with peers and stakeholders via white-label reporting.
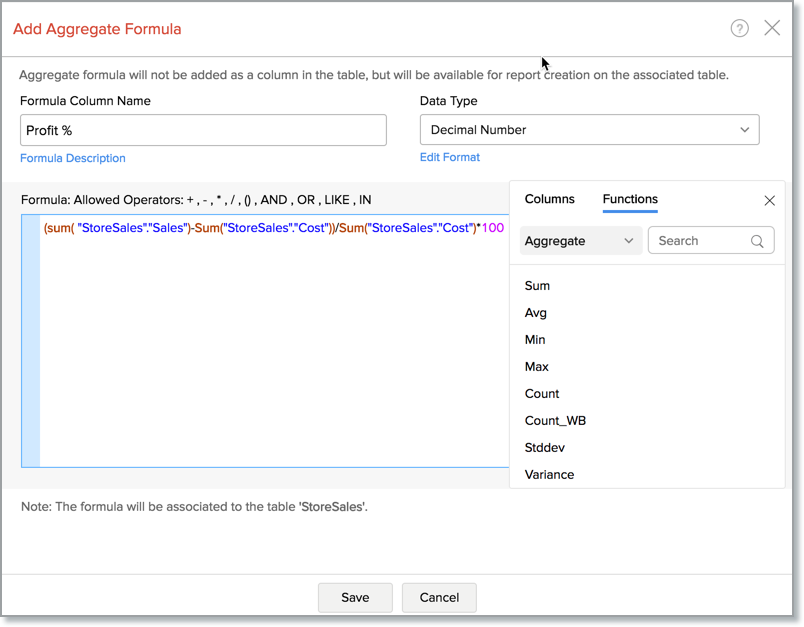
Understand raw data with deeper analytics
Build new calculations with an intuitive formula engine that offers extensive mathematical and statistical functions.

Accessible across all devices
Access the business performance dashboards you create from PCs, laptops, tablets, and mobile phones.
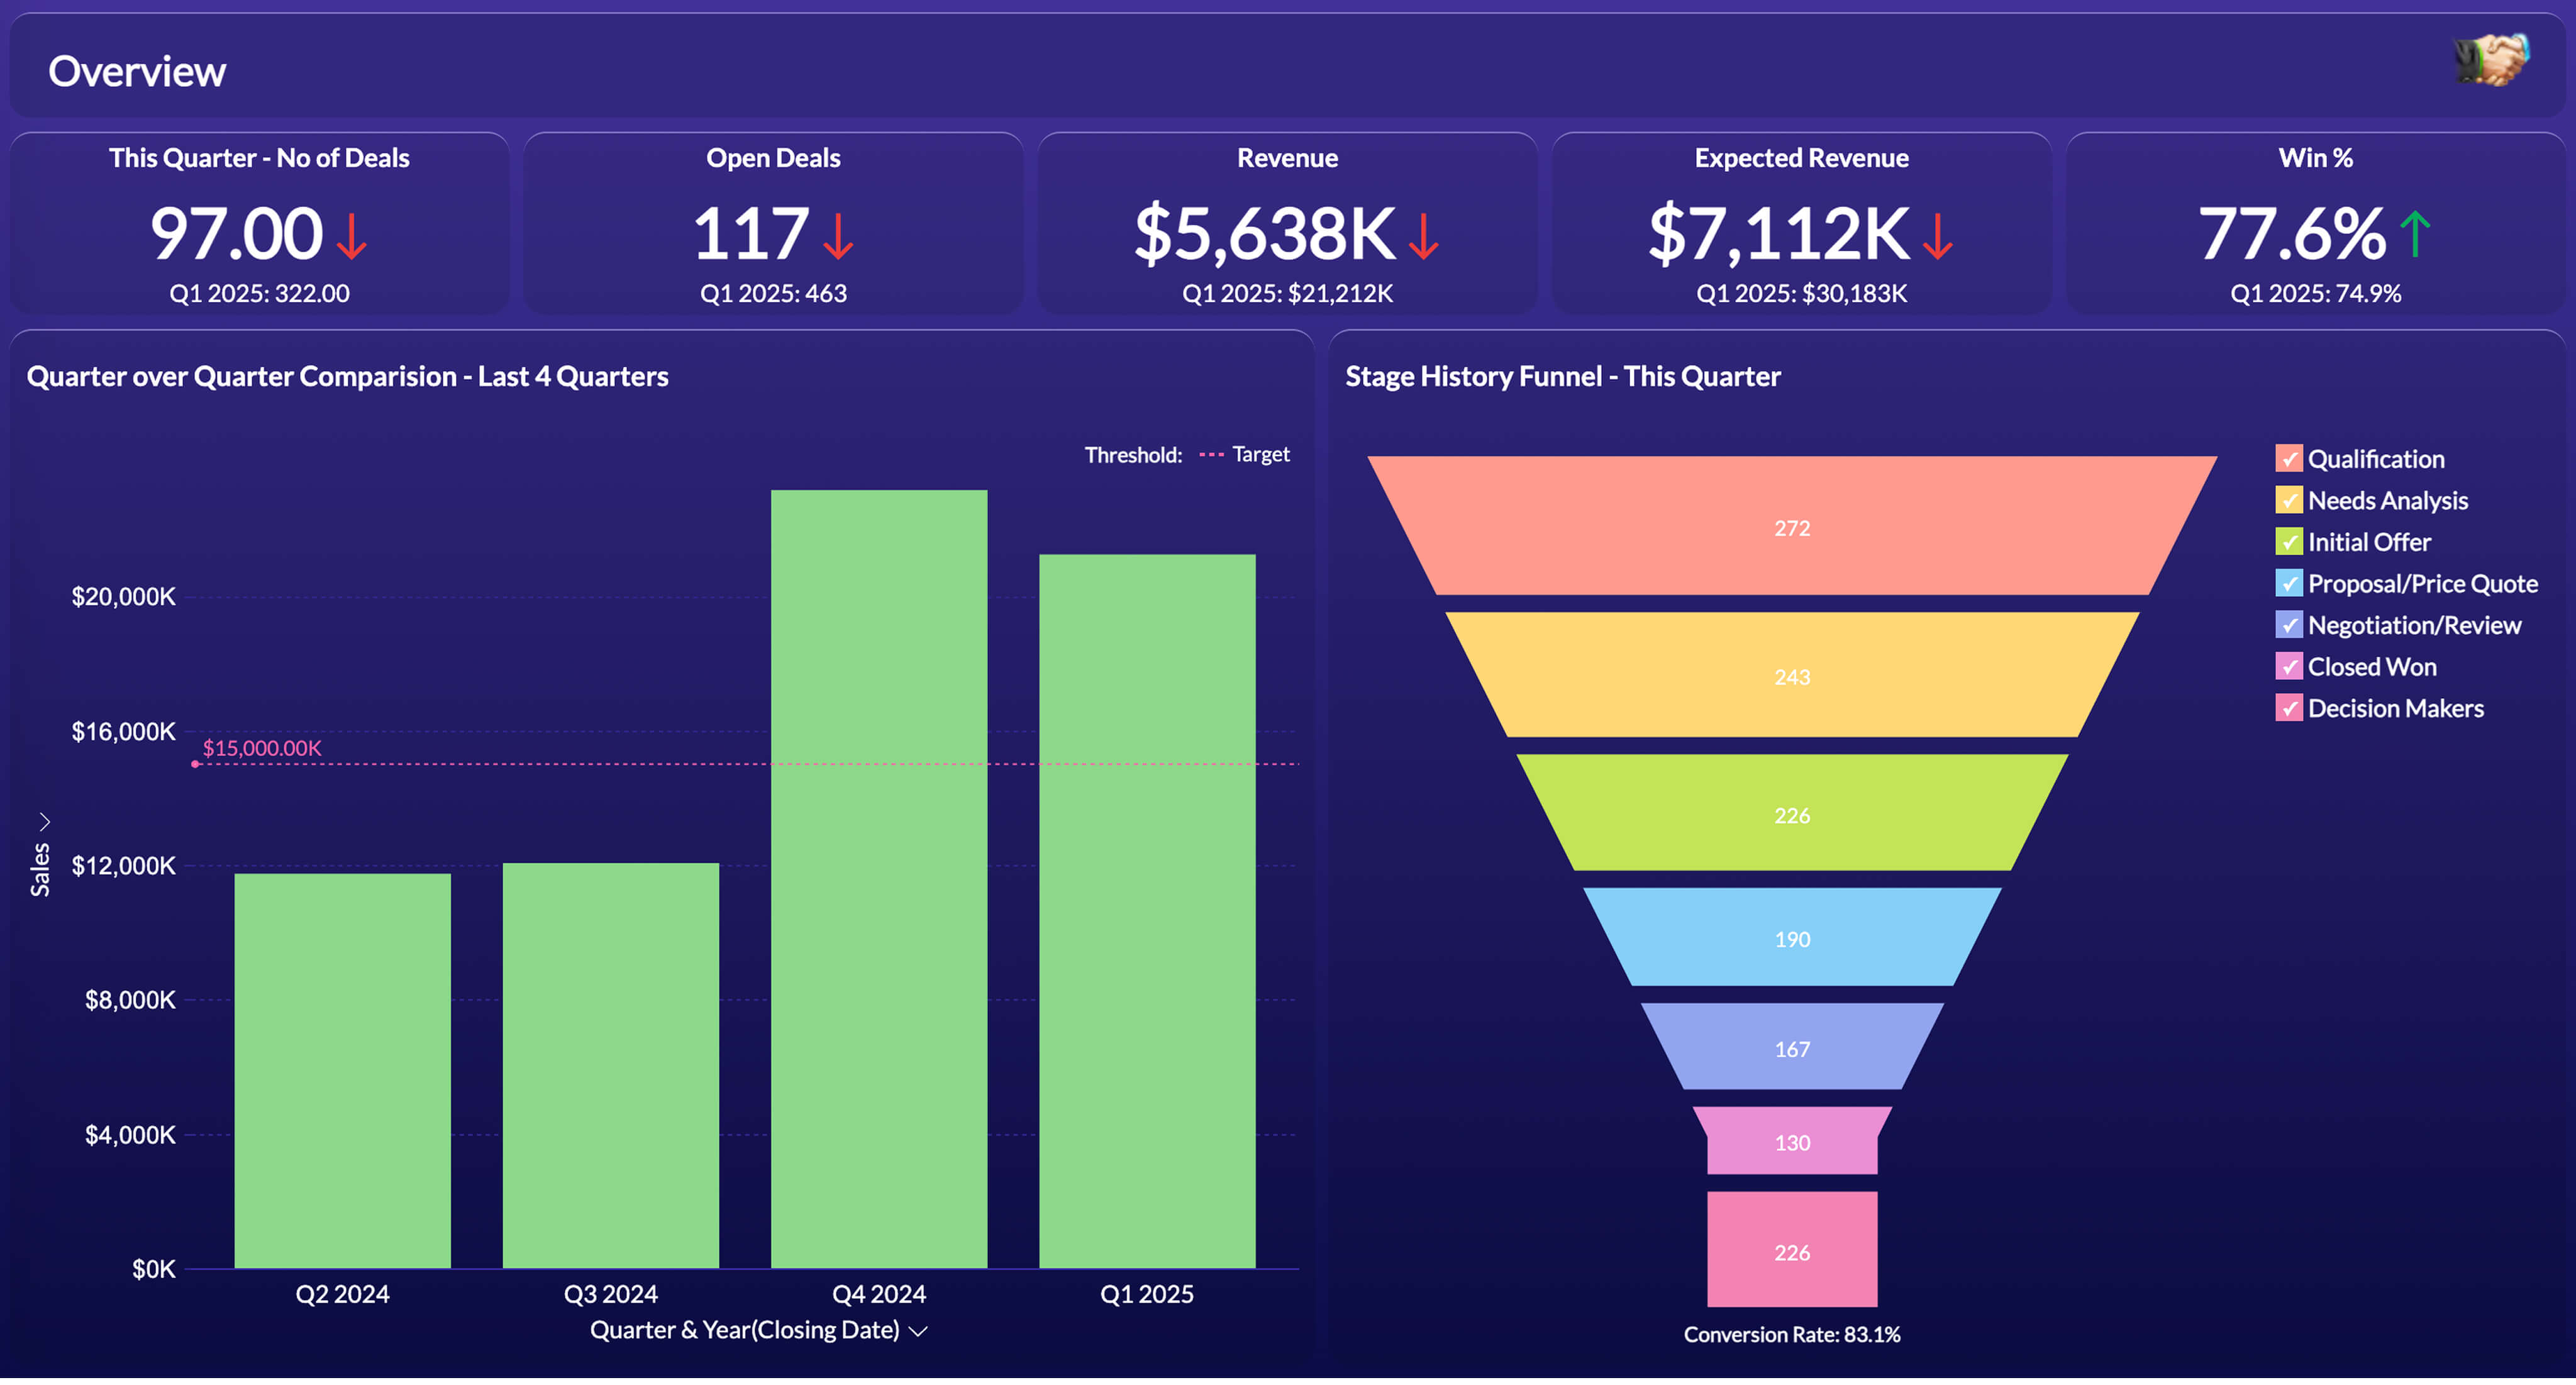
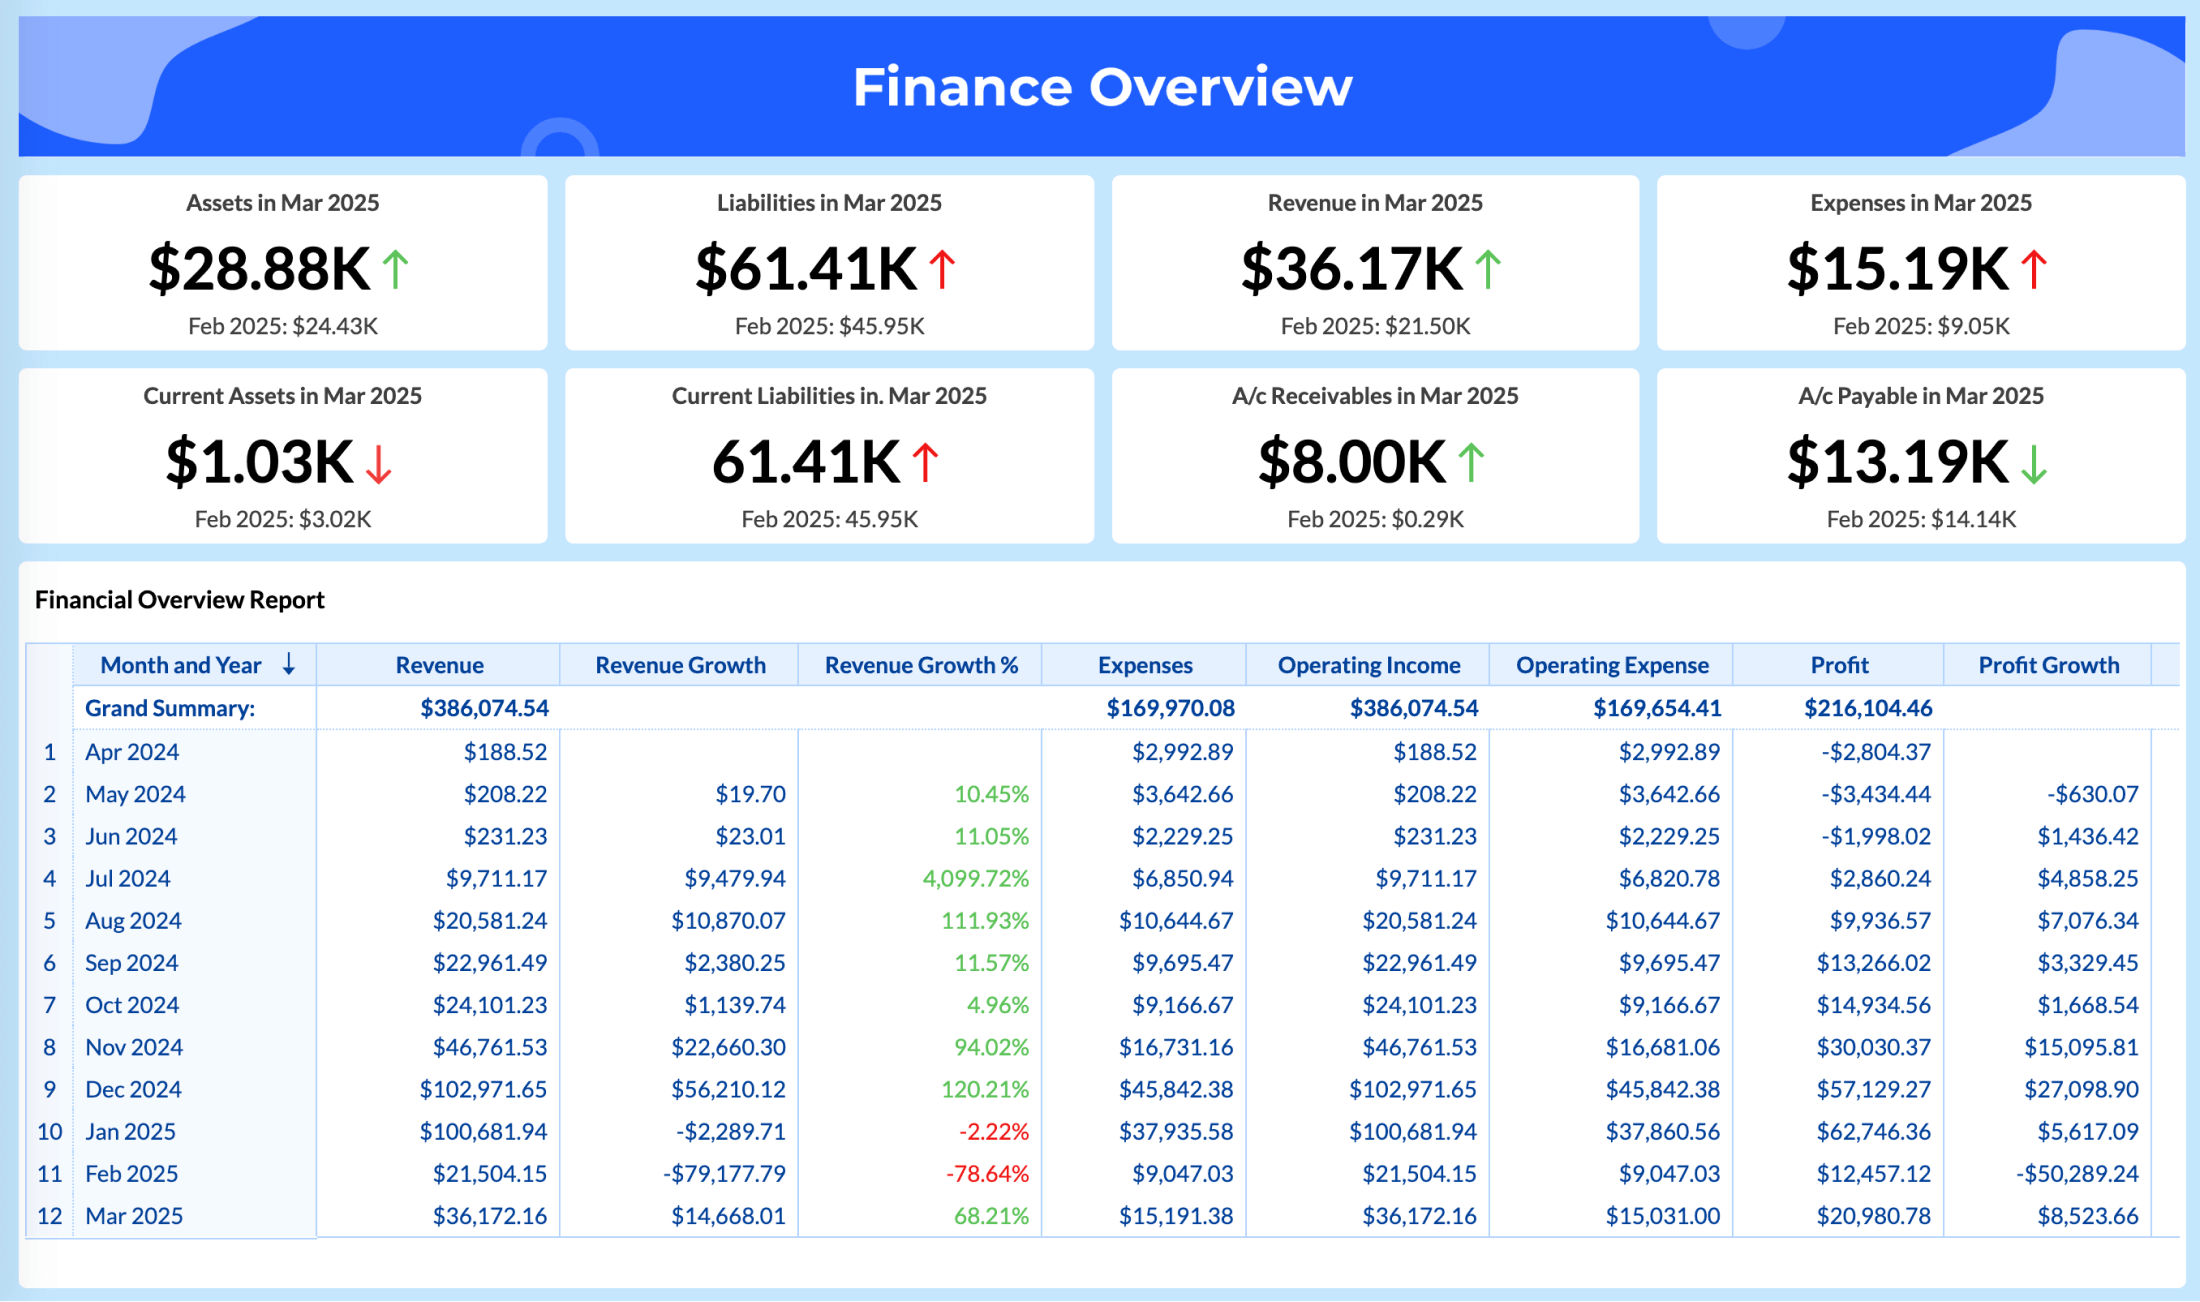
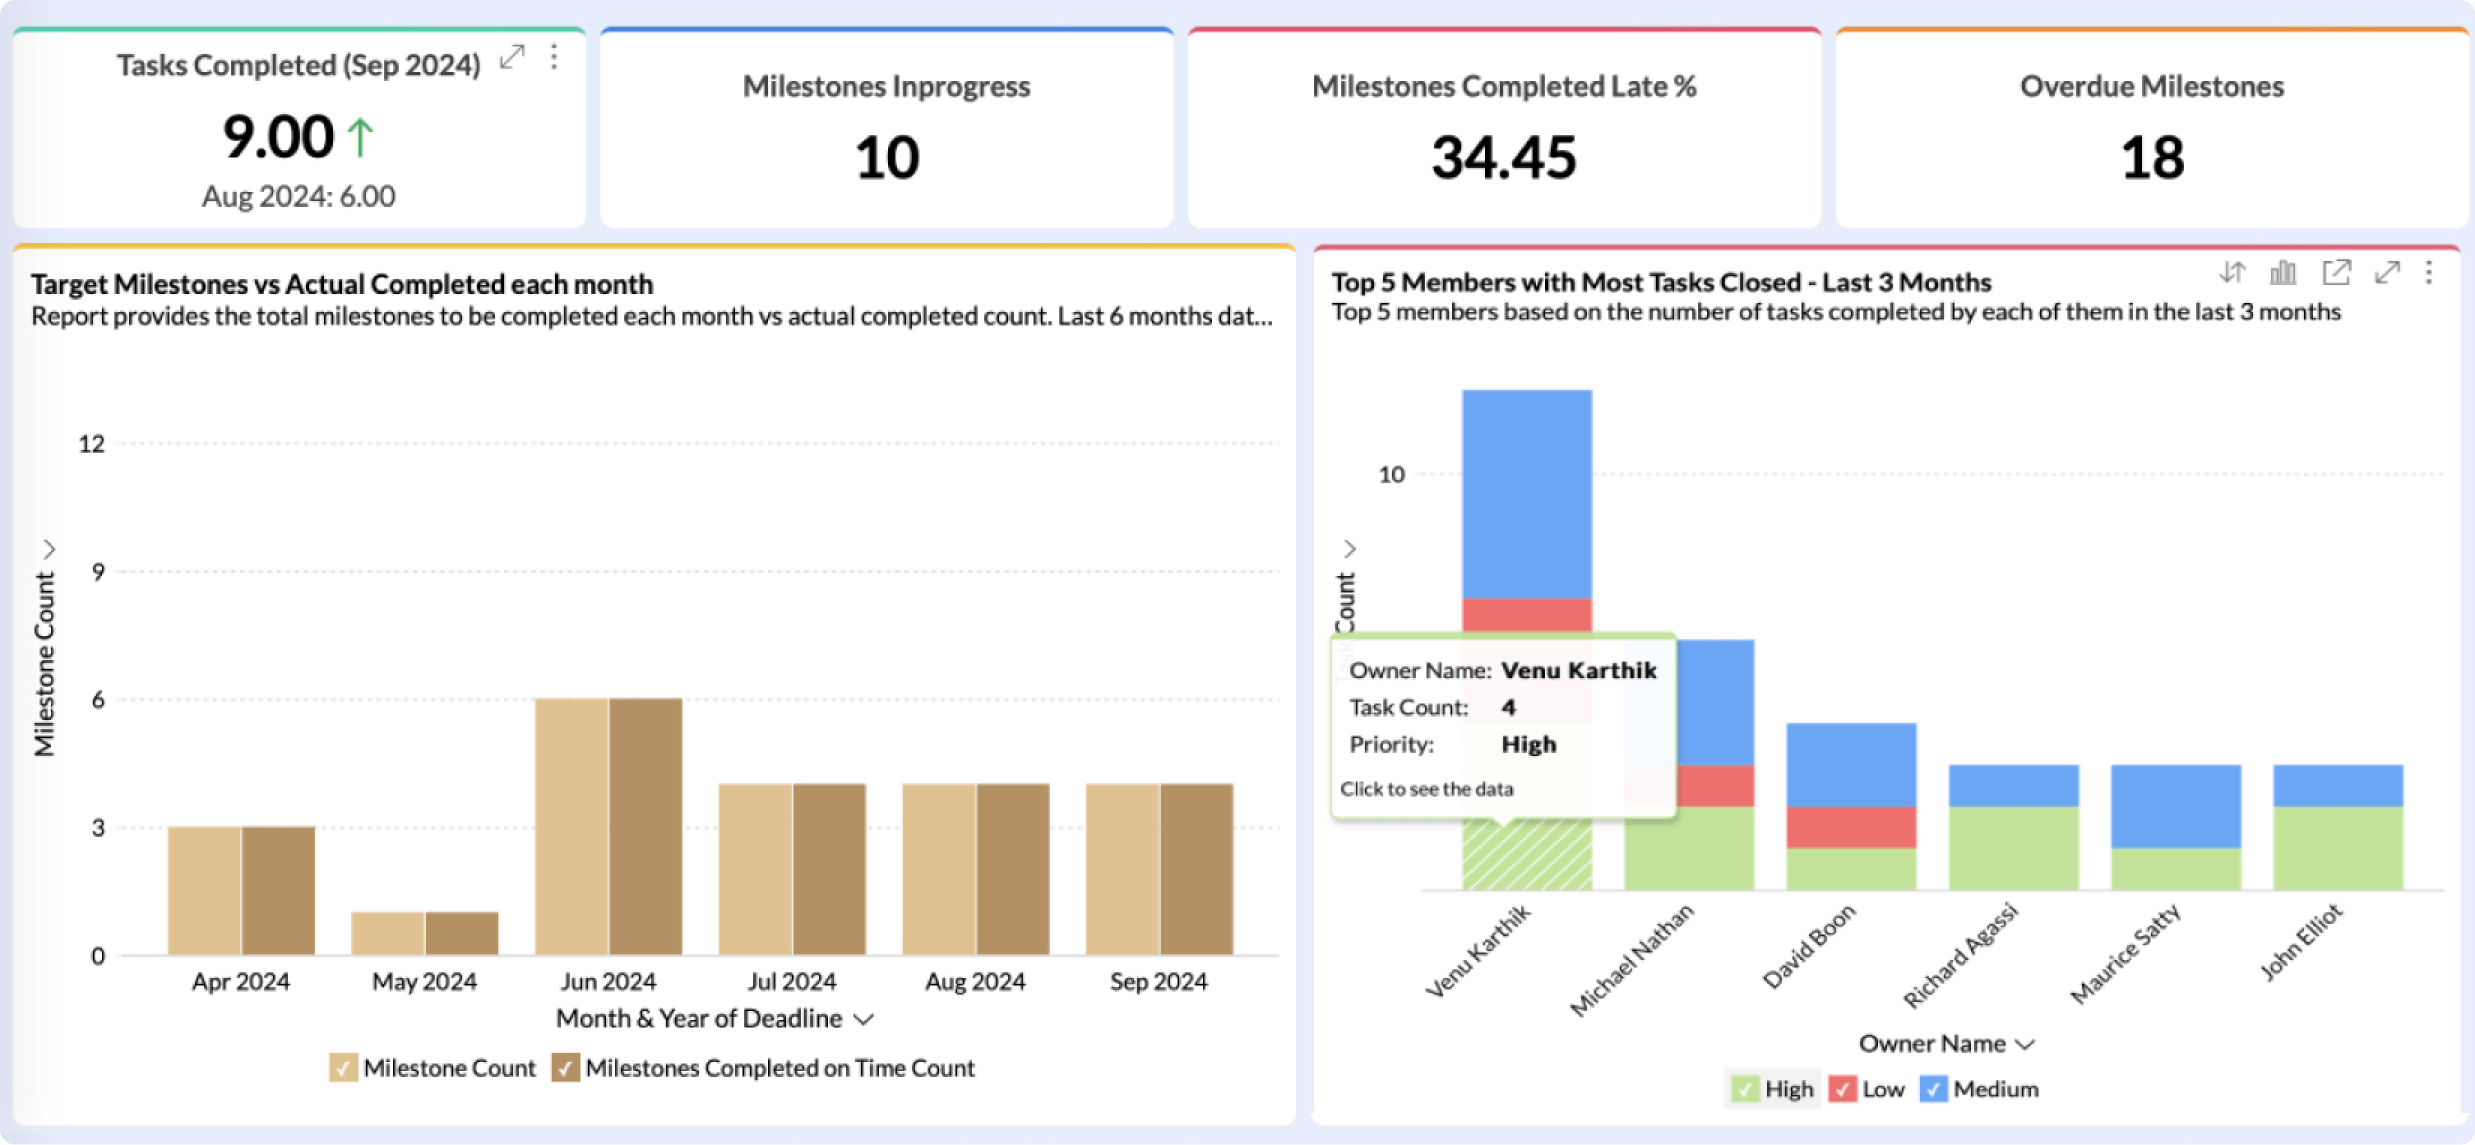
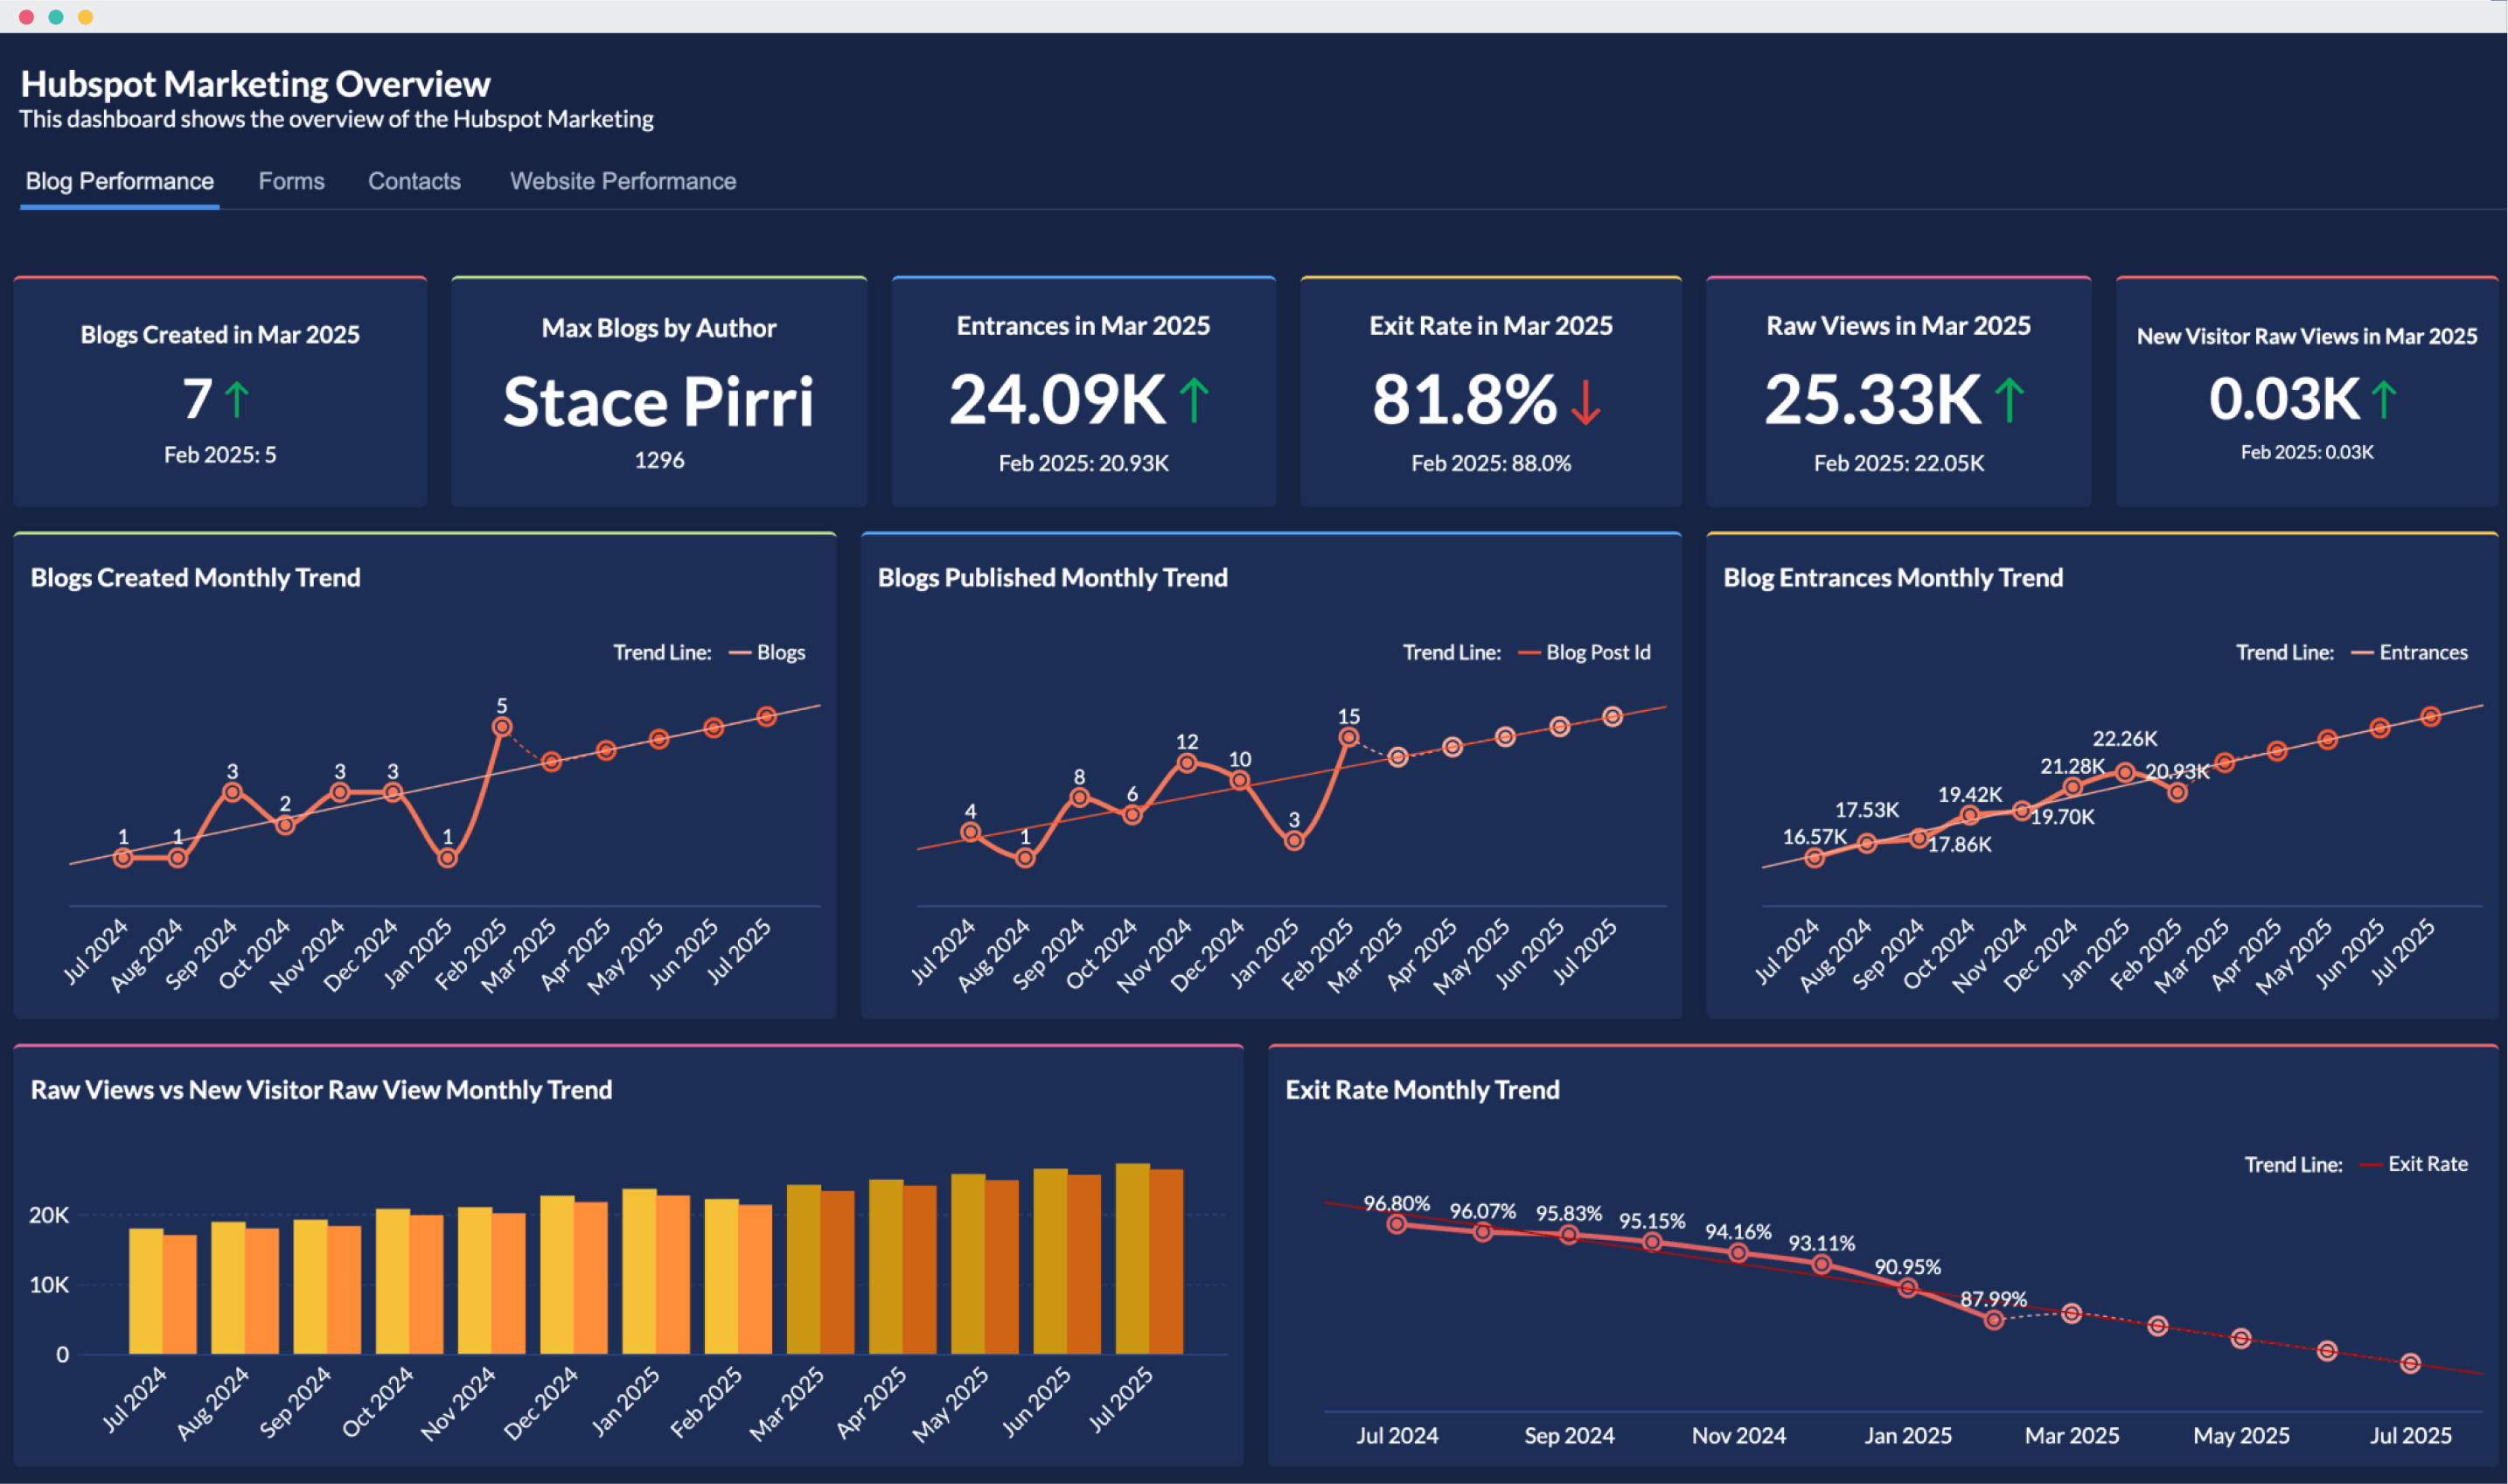
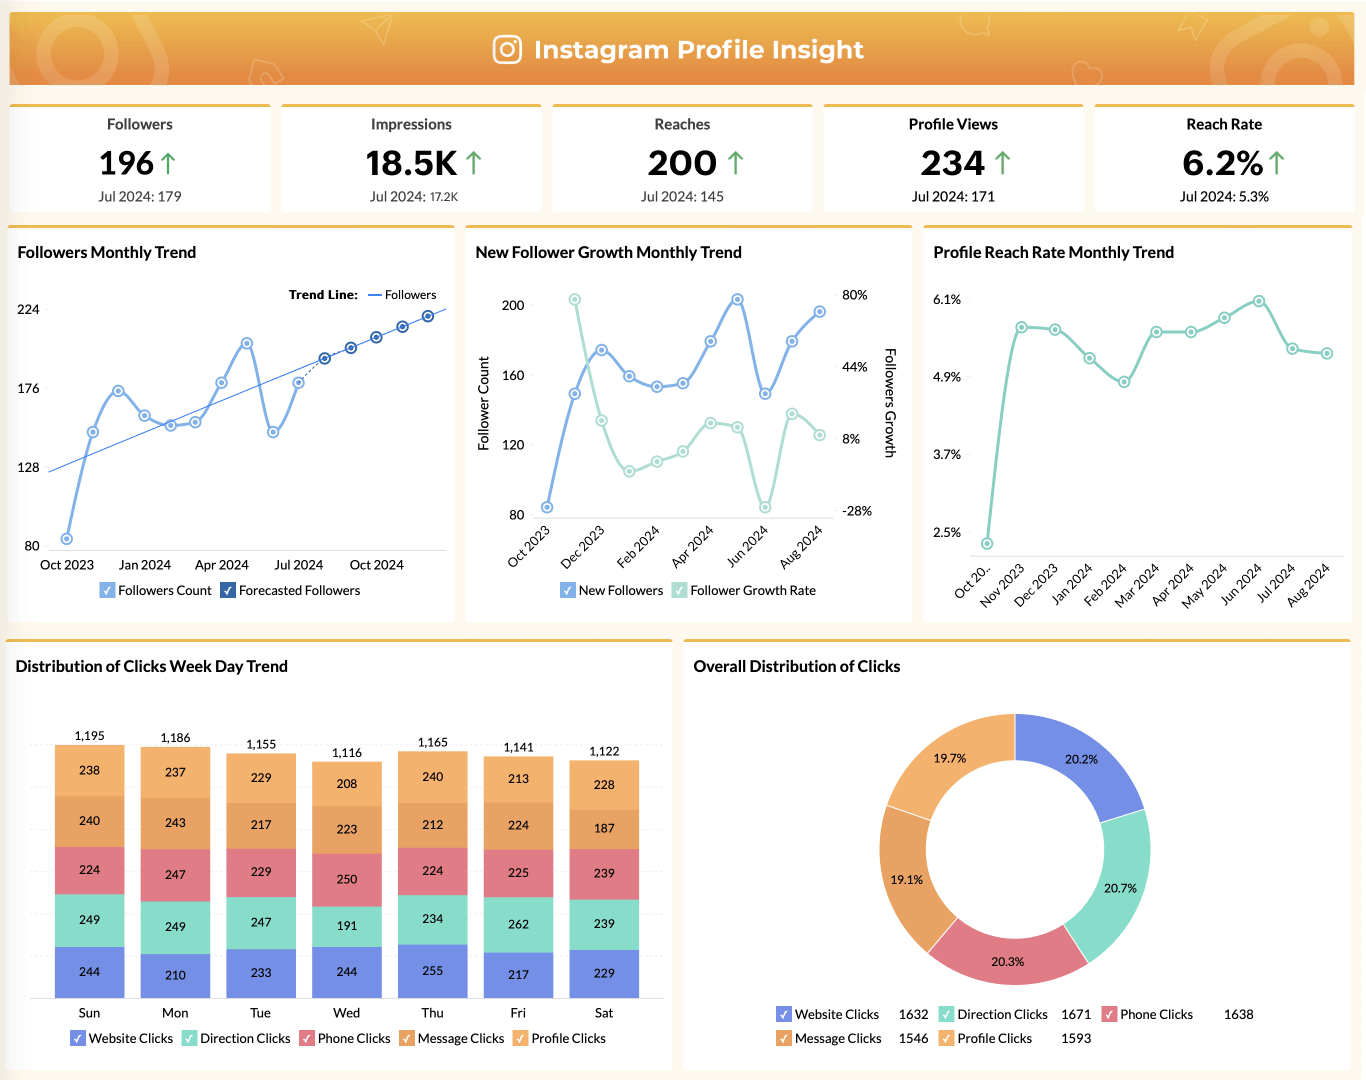
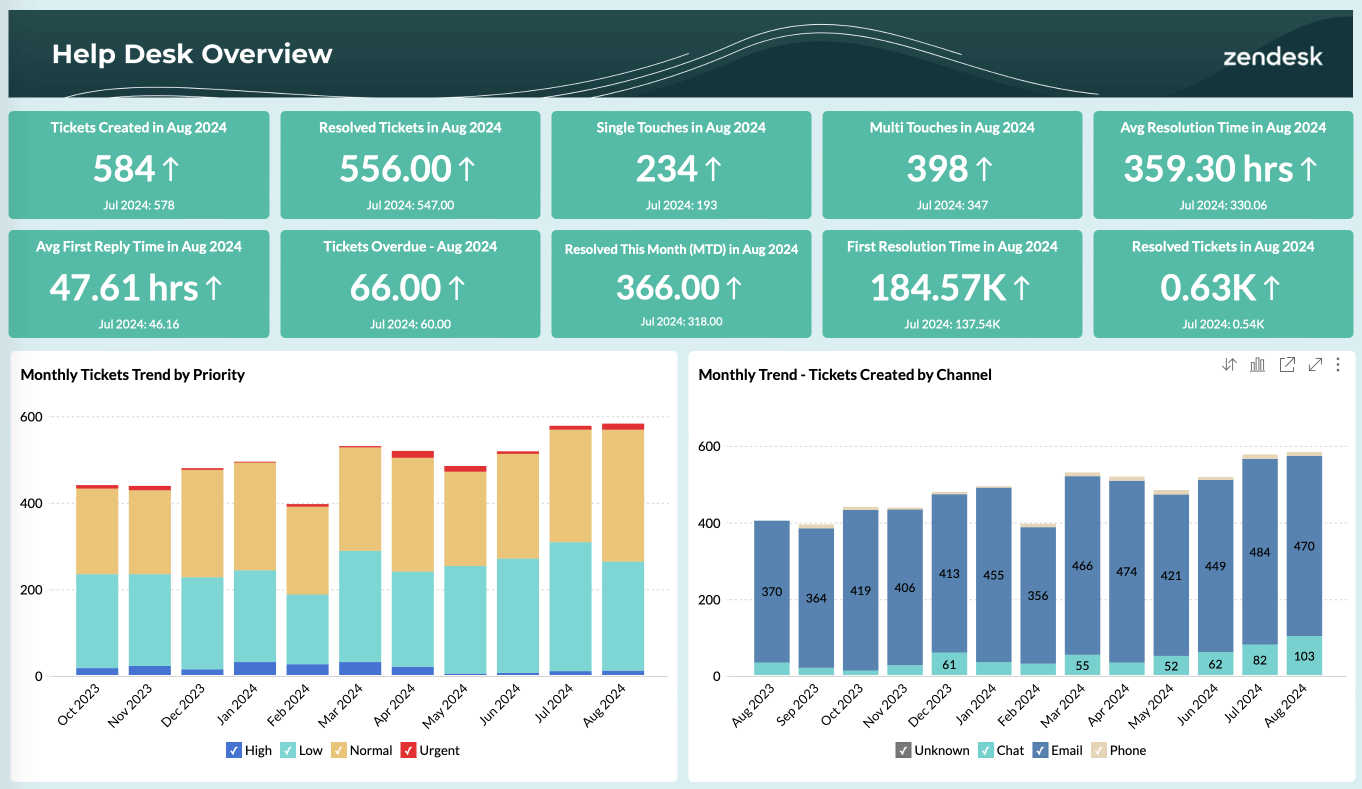
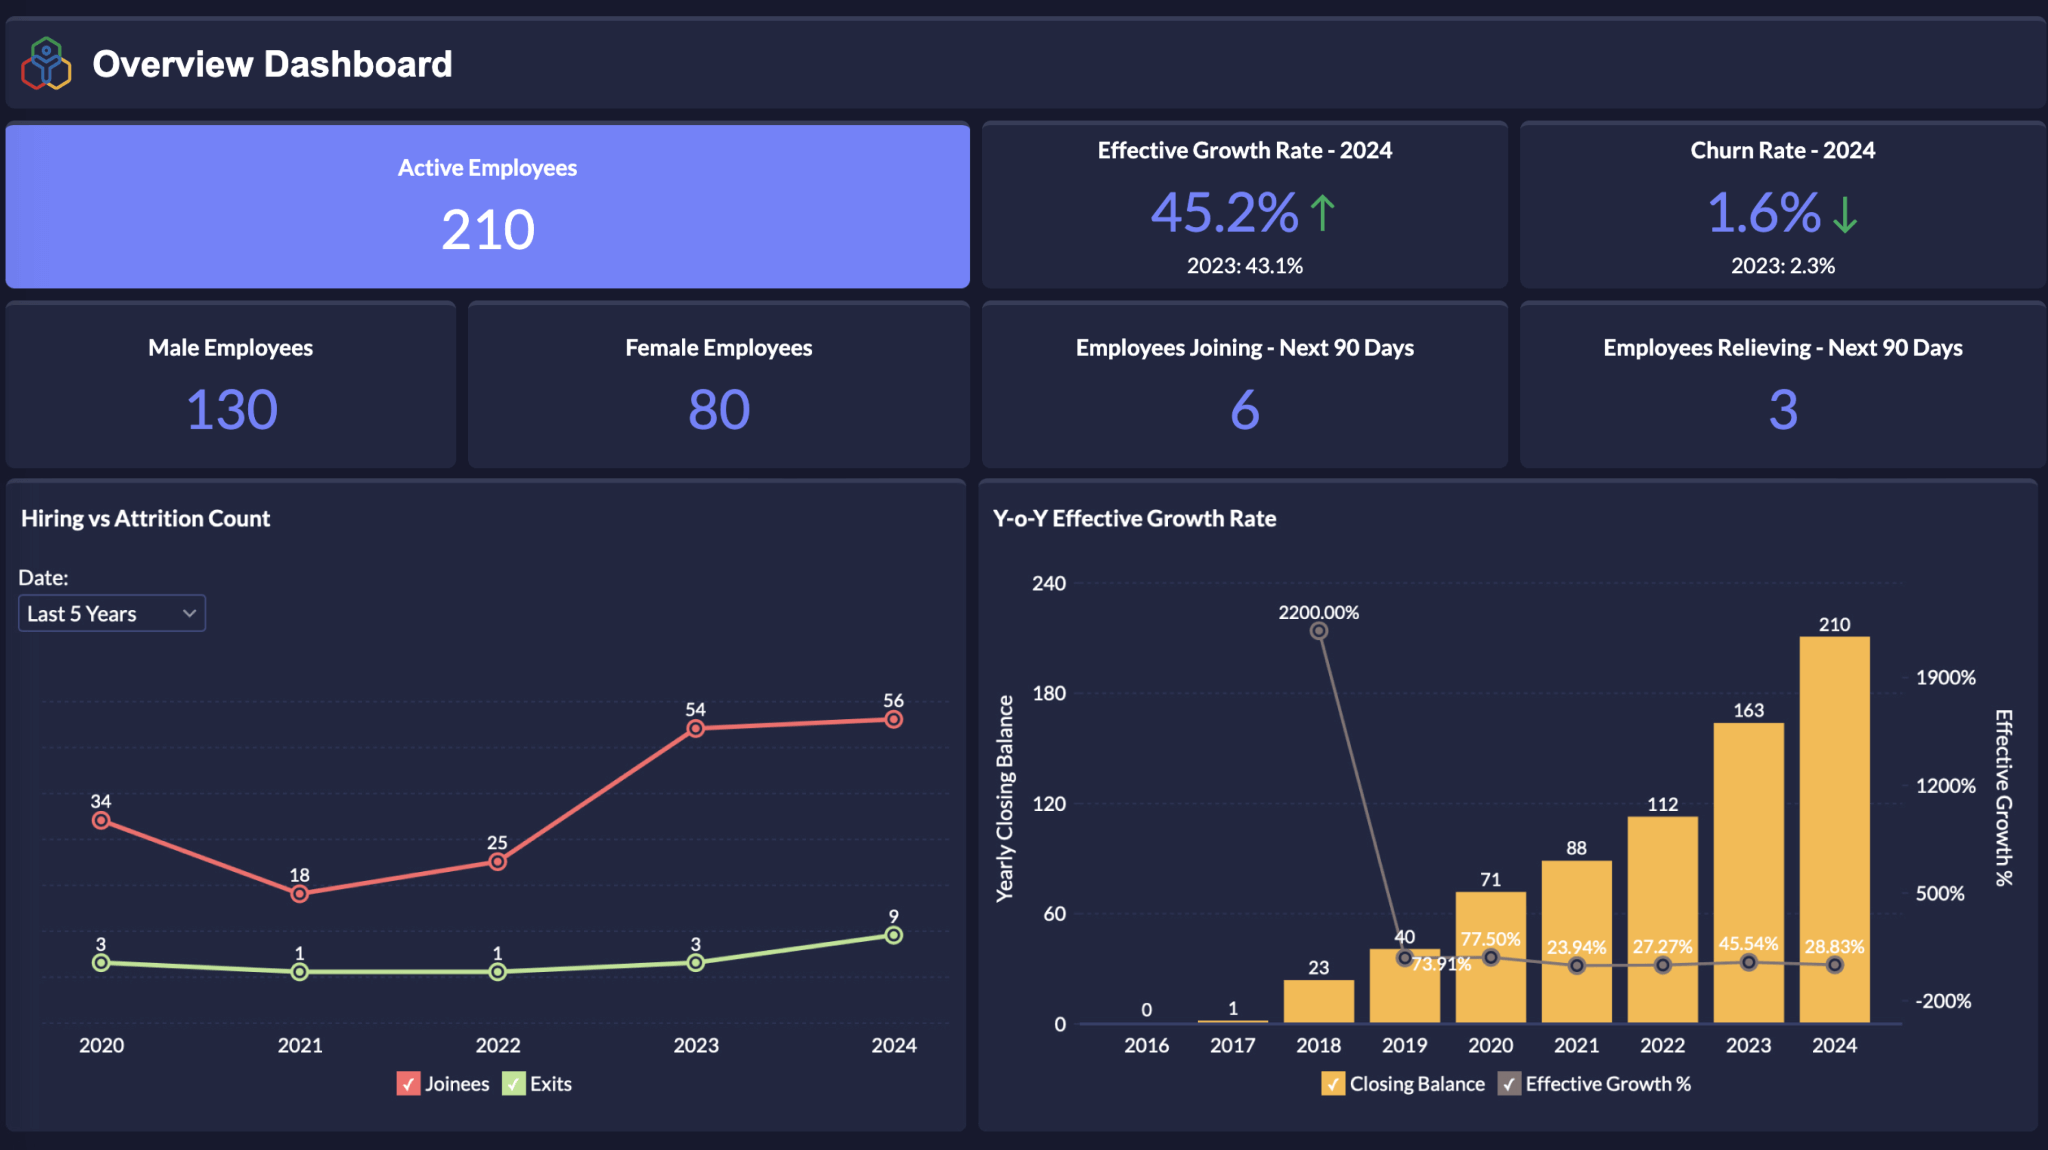
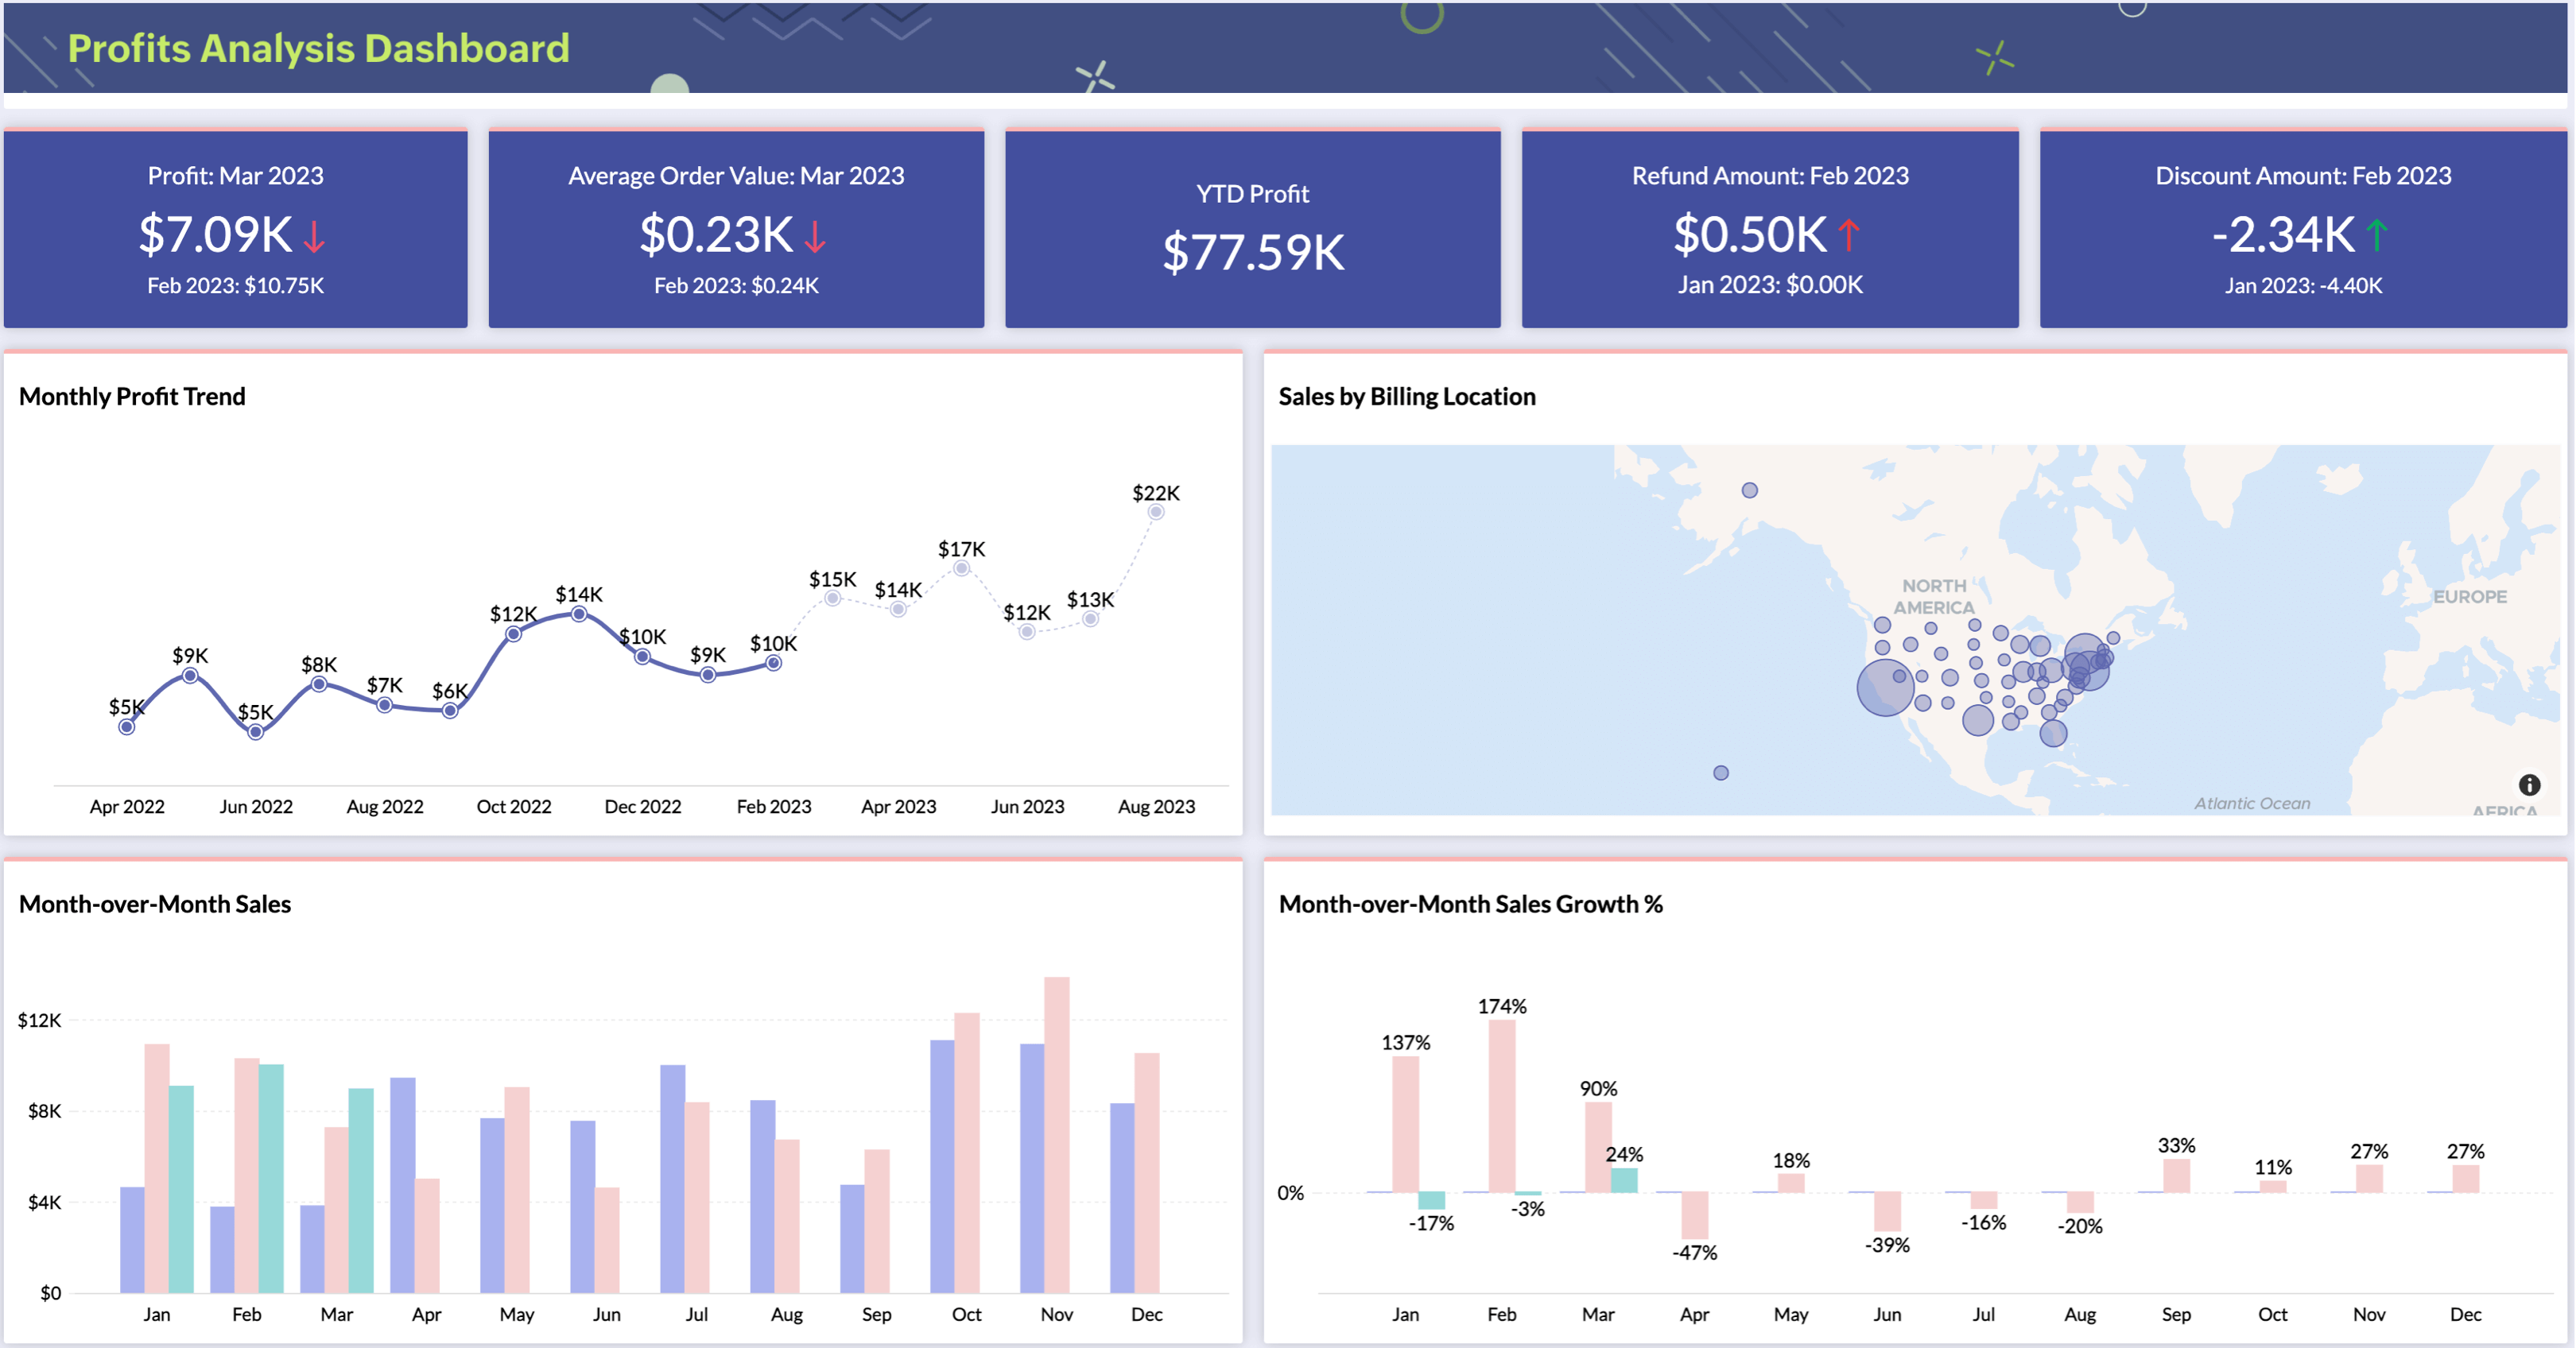
Business dashboard examples
Hear it from our Customers
"Zoho Analytics enabled us to create KPIs with complex business logics built-in. It's easy enough but at the same time quite powerful for a marketer to use. Personally, it's my number one tool for reporting."
Louis-Dominic Parizeau
Director of Adviso
Build your own Business Dashboard.
Sign up for freeBusiness Dashboard Software FAQs
What are business dashboards?
- Business dashboards are powerful reporting tools that consolidate data and reports from various sources into a single visual platform. They provide a comprehensive view of your business performance, enabling you to analyze your data easily and identify key focus areas. These dashboards can include simple charts or highly interactive display elements, based on business needs and complexity of the data analyzed. They are extensively used by organizations across industries to monitor performance, track progress, and identify areas for improvement.
What is the importance of business dashboards?
- Harnessing the power of a user-friendly dashboard can simplify the intricate nature of business operations. By transforming large data sets into easily understandable insights, these dashboards enable quick decision-making and promote smoother operations.Some other benefits include:
- Understand your target audience and define the purpose clearly
- Encourage exploration by maximising interactivity
- Arrange your insights (reports, KPIs) in a logical sequence
- Use appropriate visual elements and color schemas for superior UX
- Ensure the dashboard has everything that your target audience looks for
- Predict and view future trends(or)outcomes based on historical data
- Foster collaboration and a common understanding of business goals and priorities
What should be included in business dashboards?
- A business dashboard's key components includes:
- Relevant KPIs and performance reports: These crucial elements assist in decision-making and strategy planning, providing the necessary metrics and data to evaluate business performance.
- Intuitive and interactive interface: A user-friendly design enables business users to access relevant insights effortlessly. The dashboard should be easy to navigate and understand, allowing users to explore data and visualize information efficiently.
- Real-time data updates: The dashboard should provide timely updates with clean and relevant data. Real-time data integration allows for up-to-date analysis, enabling swift decision-making based on the latest information.
- Comparative analysis: Add elements for comparison of different time periods, regions, products, or other relevant categories to enable effective decision-making
- Customization: It is imperative to have the ability(or)options to customize the dashboard according to any organization's brand guidelines and norms.
What are the best practices while creating business dashboards?
- Here are some of the recommended best practices for creating effective company dashboards for business:
- Understand your target audience and define the purpose clearly
- Encourage exploration by maximising interactivity
- Arrange your insights (reports, KPIs) in a logical sequence
- Use appropriate visual elements and color schemas for superior UX
- Ensure the dashboard has everything that your target audience looks for
What are the benefits of having business dashboard software?
- With business dashboard software in place, businesses can get
- Total visibility into their operations
- Save time in data analysis
- Improve efficiency
- Identify trends
- Derive meaningful insights.
- These insights can help businesses make informed decisions and plan strategies
Why choose Zoho Analytics for your business dashboards?
- Zoho Analytics is a top-notch business dashboard solution out in the market. It lets you gather data from over 250+ sources, create interactive dashboards using 50+ visualization options, analyze data by leveraging advanced AI/ML capabilities, collaborate, and share reports with peers. The platform is proven to be a comprehensive and user-friendly tool for businesses.
What’s the best way to generate automated reports for my business?
- Using a business dashboard software like Zoho Analytics that supports data connectors with real-time sychronization, live streaming and AI-powered generation of reports that offer up-to-date insights
How can I monitor my company’s key metrics in real time?
- Business dashboard tools like Zoho Analytics offer live connectors to local and cloud databases, as well as popular business applications, enabling real-time dashboards that help business users stay on top of key performance metrics.
How do businesses use dashboards for decision-making?
- Business dashboards provide a centralized, comprehensive view of performance metrics, helping stakeholders monitor trends, identify bottlenecks, and make faster decisions. Whether it's tracking sales, campaign performance, customer engagement, or financial health, dashboards enable data-driven actions at every level of the organization.
What are the security risks of using a business dashboard?
- Security risks with business dashboards include unauthorized access, data leaks, and misconfigured permissions. However, a trusted and secure BI platform like Zoho Analytics helps mitigate these risks through features such as role-based access control, encryption, and audit trails, along with compliance with industry standards like GDPR, HIPAA, ISO, and SOC 2.
What is the easiest business dashboard to use without coding?
- Modern BI platforms like Zoho Analytics offer drag-and-drop interfaces, pre-built templates, and guided report builders—making them ideal for non-technical users to create powerful dashboards without writing a single line of code.
How do I find a business dashboard software that integrates with my existing tools?
- Look for platforms like Zoho Analytics that offer extensive native connectors to over 500 data sources—including CRM, ERP, finance software, HR tools, local or cloud databases, files, and feeds.
Is business dashboard software secure?
- Yes, business dashboard software like Zoho Analytics is highly secure, backed by an enterprise-grade security framework and accredited with industry-standard certifications. It ensures safe creation, consumption, and sharing of reports and dashboards with peers and stakeholders.