What is conversion rate optimization?
Conversion rate optimization (CRO) is the process of increasing the percentage of website visitors who complete a desired action, such as making a purchase, signing up, or downloading a resource, without spending more on traffic.
Zoho PageSense is a CRO platform built to run every stage of that process, from analytics and heatmaps to A/B testing, in one dashboard.
Examples of CRO tools include Zoho PageSense, VWO, Hotjar, Lucky Orange, and Convert, each pairing some combination of web analytics, heatmaps, session recording, and A/B testing to help teams find and fix conversion leaks.
Before diving into the vast topic, let's get familiar with some basic definitions.
What is a conversion?
A conversion is simply when your lead completes a goal you've set for them. For instance, when sending out email invites for a webinar, conversion can mean the subscriber registering for your session. For events, it could be an attendee dropping by your booth after seeing your brochure in the event kit. In website terms, a conversion is when a visitor takes an action that you want them to take on your site. What accounts for a successful conversion changes as the visitor becomes familiar with your business and depends on how deep they are in your conversion funnel. (We'll cover more on conversion funnels in a bit.)
Plus, you definitely need to monitor your macro and micro conversions, the primary and secondary actions you want visitors to take on your website.
Examples of macro conversions
- Purchasing a product from your site
- Registering for your event
- Subscribing to your product or service
Examples of micro conversions
- Signing up for email lists
- Downloading a PDF
- Adding an item to the cart
What is a conversion rate?
Conversion rate is the percentage of visitors who complete a goal out of the total visitors your site gets.
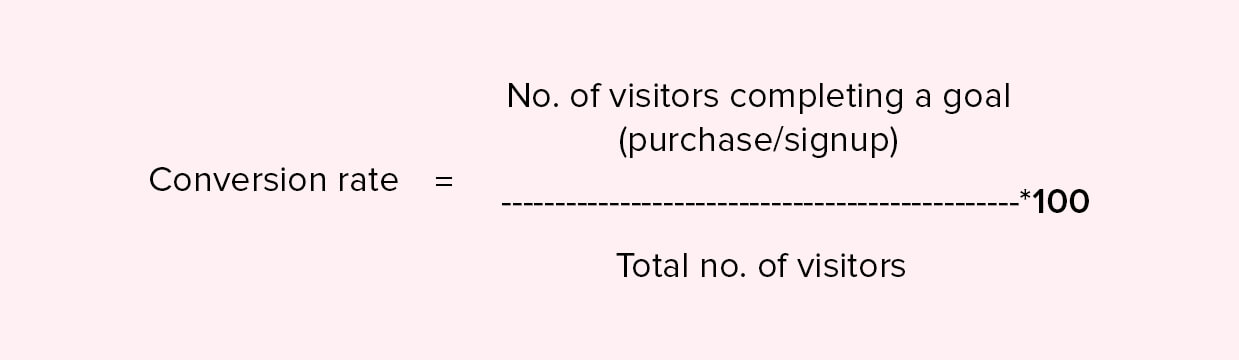
Having a high conversion rate indicates that your marketing efforts are fruitful and people are interested in what you have to offer.
What is a good conversion rate? According to recent surveys, the average conversion rate for a SaaS business is between 3 and 5% (and a good conversion rate is around 7 to 8%), while it's only 2.86% for an ecommerce business. We can only give a ballpark figure, since the conversion rate varies from one industry to another. You have to define your goals, measure your conversion rate, and map it against the standard for the industry you're in.
If your conversion rate isn't up to the industry standard, it could mean:
Your website or landing page doesn't resonate with your audience. Something on your site (design, content, offer) is stopping your visitors from completing a goal.
This is exactly when you need to focus on conversion rate optimization.
Benefits of CRO

Improve customer insights
Conversion rate optimization measures your visitors' pulse: what they like on your website, what sections drive them away, and most importantly, what kind of website experience motivates them to convert. Note these observations. Over time, you'll notice distinct browsing patterns that tie each audience segment together, a common behavior that leads to conversions, or the lack of them.
Use this information to update your customer personas regularly. With each update, you'll tweak the marketing strategy for the personas, delivering messaging that fits their needs. In the long term, you'll be able to optimize your website to bring in the right kind of visitors, the ones with a higher chance of converting.

Lower customer acquisition cost (CAC)
Imagine you're spending $1,000 to bring in 100 visitors to your website, out of which 20 convert. Your customer acquisition cost will be $50.
By optimizing your website, while you still might be spending $1,000 to bring in 100 visitors, you might end up converting at least 40 of them. You'll have acquired each customer at $25, cutting your CAC down by 50%.
In simpler terms, doubling your conversion rate means halving your cost per acquisition (CPA), or how much each new customer costs you.
See what CRO can do for your website.
Maximize profits from current traffic
In theory, profit is your revenue minus the cost of selling your service. When you make CRO part of your business, you've primed your website for catering to the right audience, and consequently, you'll rake in more conversions and boost your revenue.
This means you'll incur the same costs while disproportionately scaling up your profits.
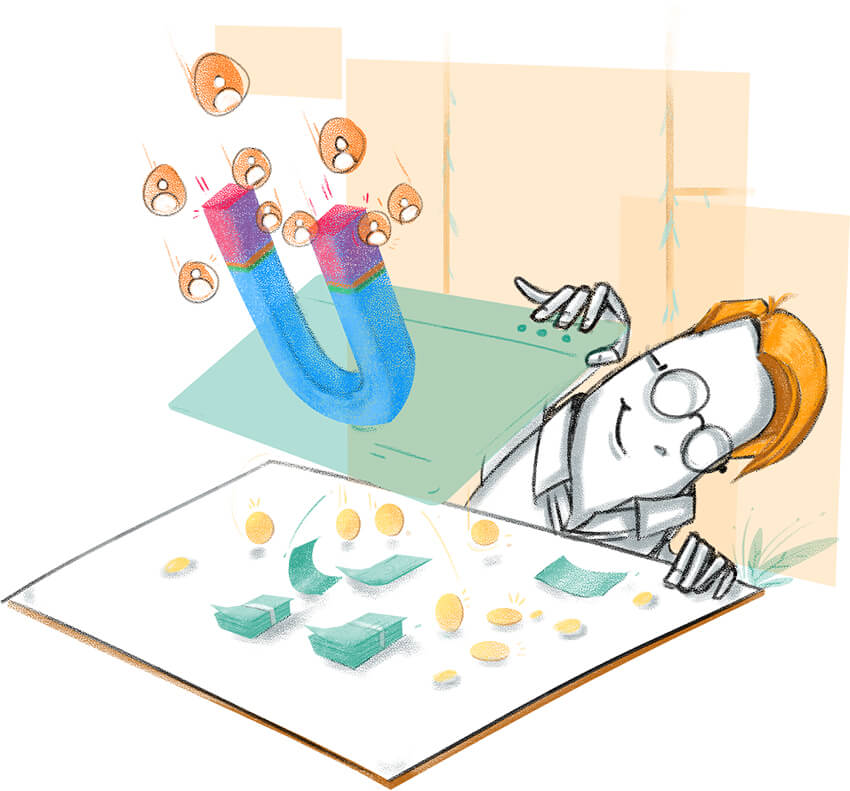

Shorten lead-to-purchase time
Through ongoing iterations that boost conversions, you're essentially placing intuitive triggers throughout the website that nudge visitors toward conversion.
By making your website audience-friendly and sales-worthy, you reduce the time it takes for a visitor to convert. Monitor the time spent on the page and the conversion rate over time to quantify this relationship.
Once all your site's elements are working together toward a cohesive goal, you'll find your sales improving and your overall return on investment growing as well.
What can you optimize?
Imagine you're running an online education platform. You spend thousands of dollars on advertisements and drive people to your website. Let's say person A comes to your site, browses the courses you offer, picks a course that matches their interest, pays for it, and joins the course. Meanwhile, person B just browses and leaves the site.
This is exactly what a conversion funnel is. Here, person A has to go through four steps before becoming your customer: landing page, course catalog page, purchase page, course page. Person B leaves the site after the second step. This is called a funnel leak, and the leaks at each step are opportunities for optimizing conversions.
However, there are some leaks you can't address right away. Let's say your visitor wants cheaper pricing, doesn't want your product, or wants more functionality than you offer, and decides to take their business to a competitor. Handling these leaks needs to be a combined, long-term, sustainable effort.
Here are website leaks you can fix
Check and optimize for usability issues
- CSS breakage
- Rendering issues across platforms and browsers
- A website that isn't mobile responsive
- Slow loading time
- Form submission time
Fine-tune the UX
- Reduce distractions/elements that might disrupt the visitor's journey
- Remove redundant clicks and interactions that increase lead conversion time
- Optimize pop-ups, banners, polls, and notifications to be more informative than intrusive
How do you identify these leaks and find areas for improvement?
For this, you've got to first identify the best conversion optimization tool that can give you both quantitative and qualitative website data. A CRO tool will help you identify where visitors drop off in your conversion funnel, see how they interact with every element on your site, find usability issues that deter visitors from converting, and optimize the site for an improved user experience.
Quantitative data vs. Qualitative data
Before you fix anything, you need to know two things: what's happening, and why it's happening.
Quantitative data shows what the numbers are. Example: how many people visited your checkout page, what share of them abandoned it, how long they stayed before leaving. Web analytics and funnel analysis give you this.
Qualitative data shows you why it's happening, i.e. the behavior behind the numbers: where visitors hesitate, what they click and re-click, what confuses them. Heatmaps and session recordings show you this.
You need both. Quantitative data tells you your checkout page loses 60% of visitors at the payment step. Qualitative data tells you they're leaving because the discount code field throws an error. One flags the leak, the other explains it.
The 5-stage CRO workflow
Optimizing your conversion funnel and getting results just once isn't the end of the road. CRO isn't a single fix, it's a repeatable cycle: research, hypothesis, prioritization, testing, and iteration. Every cycle narrows the funnel leaks a little further, so your aim should be a long-term strategy that's scalable, dynamic, and data-driven.
Let me show you how each stage works. I'll be using a checkout page as the running example, since checkout drop-off is the most common starting point for CRO work.
Stage 1: Research
Start by finding where visitors drop off and what's stopping them from moving to the next step.
That's where funnel analysis steps in. See which step of checkout loses the most potential customers: cart, shipping details, payment, or confirmation. You can also check web analytics to see if the drop-off is worse on mobile, from a specific traffic source, or at a particular time of day.
Once you've identified the biggest leak in your funnel, use heatmaps and session recordings to understand what visitors are doing at that step. For example, if the checkout page has the highest drop-off, session recordings might reveal that visitors repeatedly click a disabled "Apply Coupon" button before abandoning the purchase. This helps you pinpoint the exact friction causing them to leave.
Stage 2: Hypothesis
Turn the research into a specific, testable statement. A hypothesis needs three parts: the change, the reason, and the expected outcome.
For example: "If we remove the non-functional coupon field from checkout, visitors will stop getting stuck at that step, and checkout completion will rise by 5%."
A hypothesis isn't a guess, it has to trace back to the data from Stage 1.
Stage 3: Prioritization
Most sites end up with more hypotheses than they can test at once, which is completely usual. Prioritization is how you decide what goes first, and that's where these two frameworks come into the picture.
PIE (Potential, Importance, Ease): score each idea on how much room there is for improvement, how much traffic or revenue the page carries, and how easy the change is to build.
ICE (Impact, Confidence, Ease): score each idea on expected impact, how confident you are given your data, and how easy it is to ship.
Rate every hypothesis 1 to 10 on each factor, average the scores, and rank your outcome. A checkout fix backed by session recordings of visitors getting stuck will usually outscore a cosmetic change on a page nobody abandons. Test the highest scorers first.
Stage 4: Testing
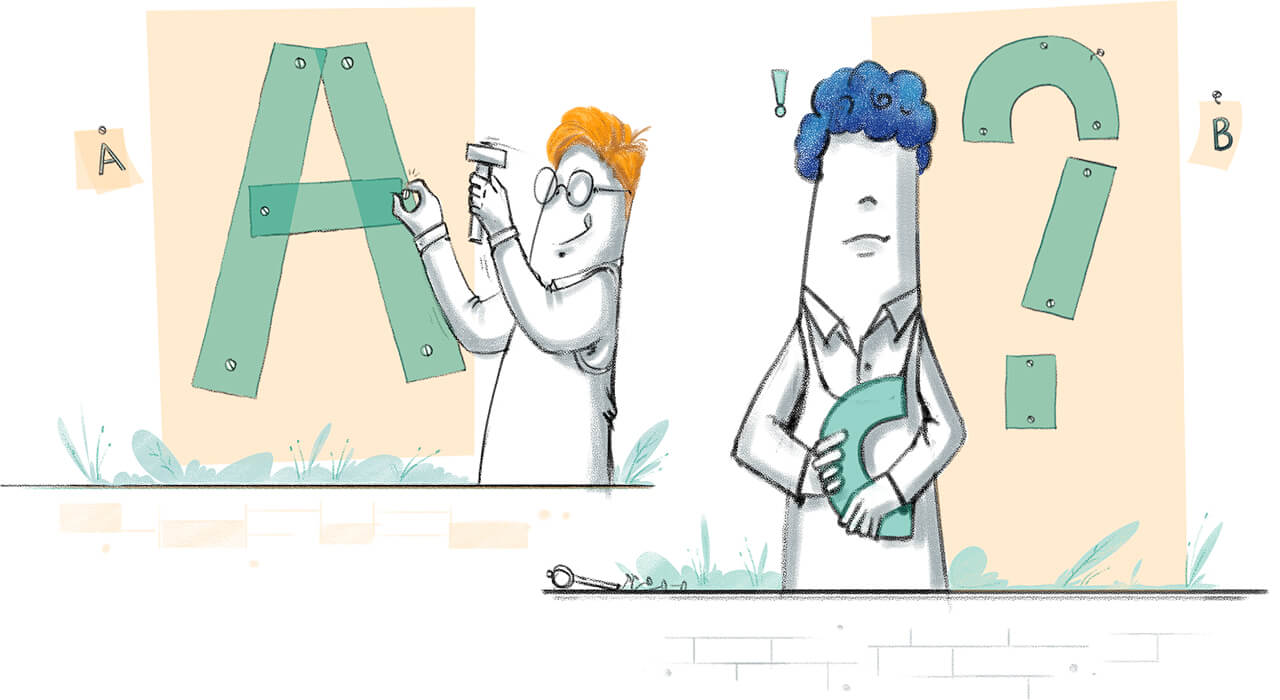
Validate the hypothesis with an A/B test. Split checkout traffic between the original page and the version without the broken coupon field, and let it run long enough to reach statistical significance, typically at least two business cycles, or about two weeks, with enough visitors on each variant. If you're not sure which elements to test first, here are some A/B test ideas to get you started.
Don't call a test early. A 5% lift after three days of data is noise, not a result. And don't expect a double-digit conversion lift overnight: unless your original page had genuinely poor UX, most wins come from sustained, smaller gains over time.
Stage 5: Iteration
A finished test isn't a finished job. Don't forget to log what you learned, whatever the result, and carry it into the next cycle.
If checkout completion rate has increased, look for the next drop-off point, maybe shipping options or account creation, and start the cycle again. If the test was inconclusive, segment the results by device or traffic source. For example, a change that fails overall might still win with mobile visitors, and that's worth testing further on its own.
Carry this learning into the next CRO cycle and reuse it across marketing campaigns.
Consistency is what makes optimization work. Skip past insights from earlier cycles and you risk chasing false positives. Build an evidence-based approach over time, and each cycle gets more reliable than the last.
Hear from a CRO expert on the steps to building a conversion optimization strategy that delivers sustainable, repeatable results.
If you're new to CRO, check out these CRO how-to videos to get started.
Not sure if CRO is right for your business?Try PageSense free for 15 days.
Frequently asked questions
Conversion rate optimization is the process of increasing the percentage of website visitors who complete a desired action, such as making a purchase, signing up, or downloading a resource, without increasing traffic spend. It works by researching visitor behavior, forming a hypothesis, and validating it through testing.
CRO tools are platforms that help you research, test, and improve your website's conversion rate. Most combine web analytics, heatmaps, session recording, and A/B testing in one place so you can find where visitors drop off and test fixes. Examples include Zoho PageSense, VWO, Hotjar, AB Tasty, Optimizely, Lucky Orange, and Convert.
Quantitative data are the numbers behind visitor behavior, such as traffic, bounce rate, and drop-off percentage. Qualitative data is the reasoning behind those numbers, captured through heatmaps, session recordings, and on-site surveys. CRO uses both: quantitative data flags where visitors leave, and qualitative data explains why.
PIE stands for Potential, Importance, and Ease. It's a framework for scoring CRO test ideas: how much room there is to improve a page, how much traffic or revenue that page carries, and how easy the change is to build. Teams use it to decide which test to run first.
ICE stands for Impact, Confidence, and Ease. It scores CRO test ideas on expected impact, how confident you are in the result based on data, and how easy the change is to ship. Like PIE, it's used to prioritize a backlog of test ideas.
Most A/B tests need to run for at least two weeks, with enough visitors on each variant to reach statistical significance. Ending a test early on a short-lived lift can produce a result that's noise rather than a real difference.
Visitors commonly abandon checkout because of lengthy or broken form fields, unexpected shipping costs, or confusing error messages. Session recordings, form analytics, and heatmaps on the checkout page usually show the exact point where visitors hesitate or give up.
A conversion funnel maps the sequence of steps a visitor takes to complete a goal, such as landing on a page, viewing a product, adding it to the cart, and completing the checkout. It shows where visitors drop off at each stage, helping you identify funnel leaks along with the percentage of users who abandon the journey.