セルフサービスのデータ可視化で詳細な知見を取得
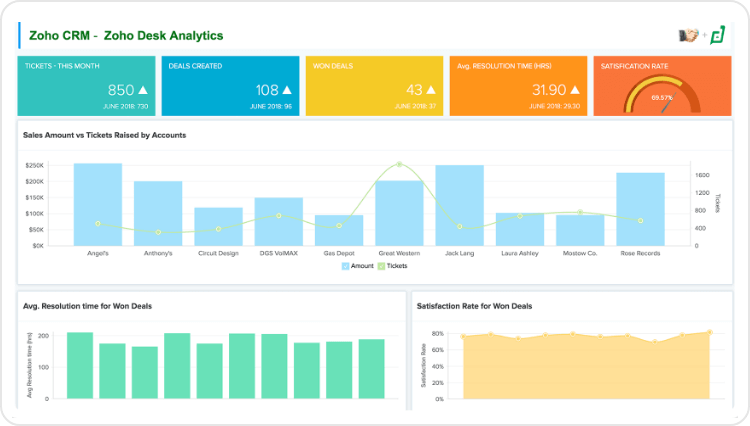
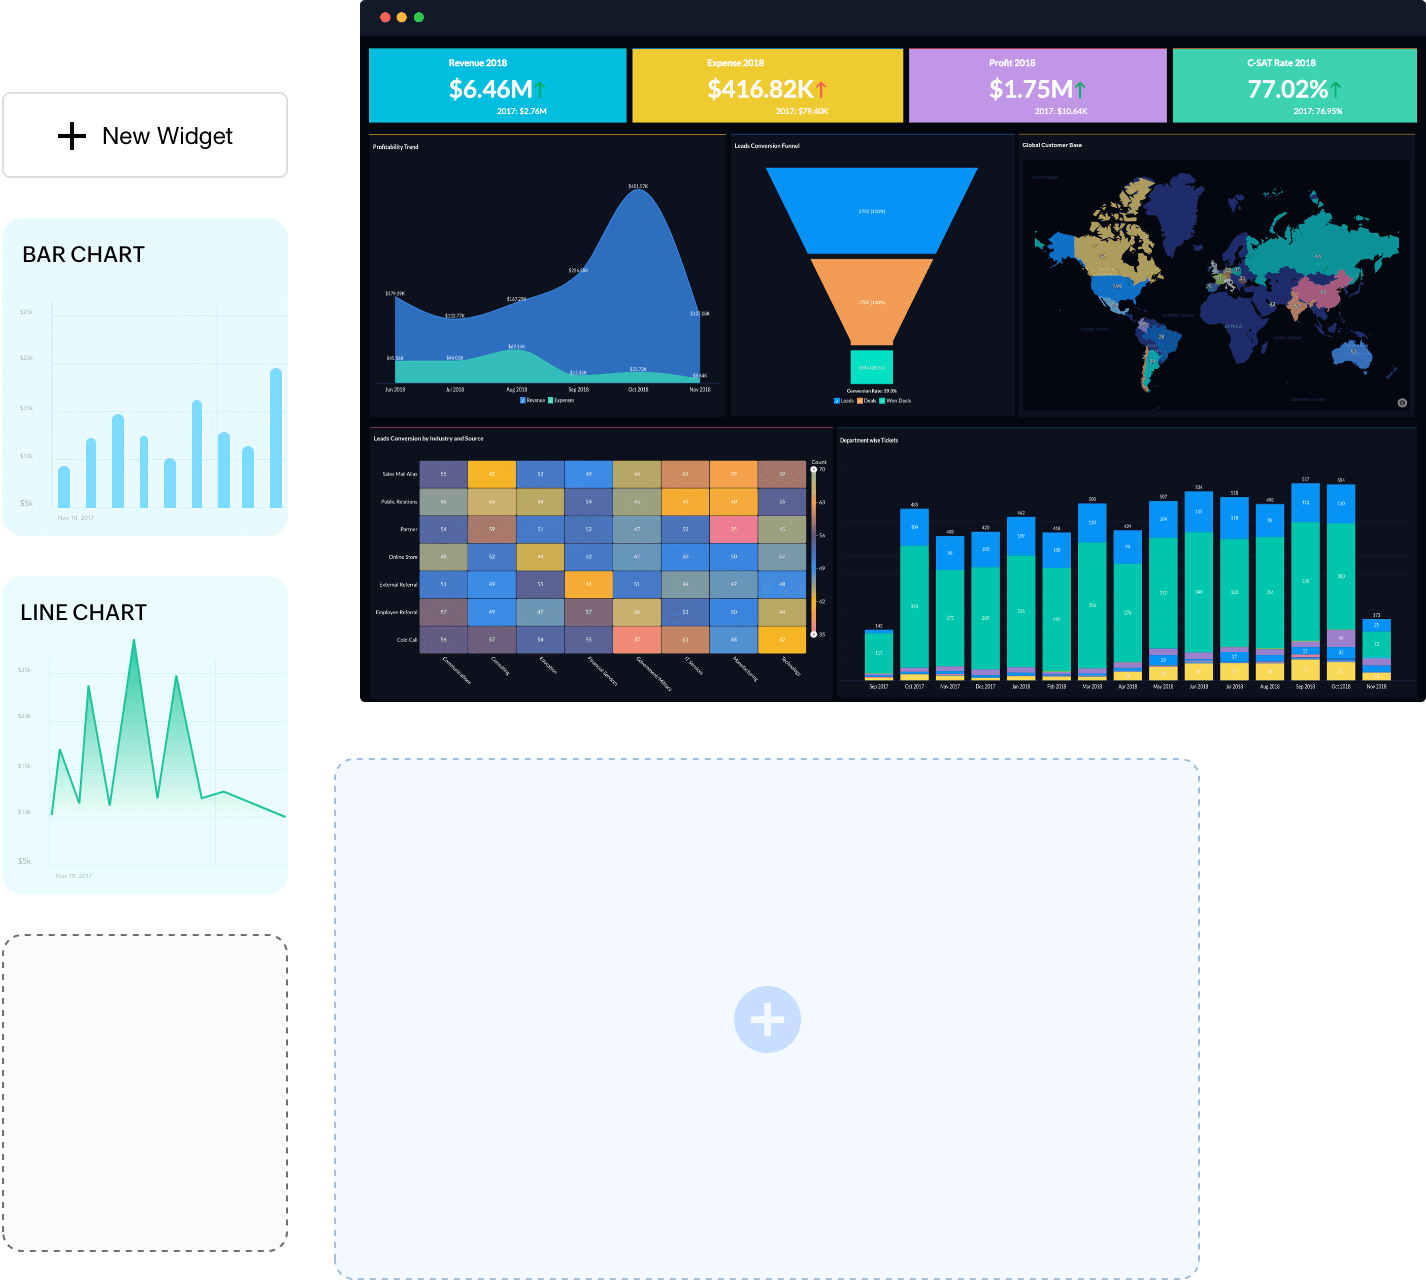
カスタムダッシュボードを作成し、レポートを自動化して、正確で最新の知見をチームで共有しましょう。Zoho CreatorのエンドツーエンドのBIで、あなたとチームはかんたんに、データの分析から知見の取得、行動へと移行できます。
無料お試し登録

データ可視化ソフトウェアとは何か、なぜ重要なのか?
データ可視化ソフトウェアとは、チャートやグラフなどの視覚要素を使用して、データを表現できるツールです。一般に、人の目には、色やパターンに対する高い識別能力があります。無数の数字を目にするよりも、視覚的な手段の方がはるかに短時間でトレンドを把握できます。したがって、データの可視化は、コミュニケーションと迅速な意思決定のための強力なツールとなります。企業が日常的に生成する膨大な量のデータも、かんたんに分析できます。データ可視化ソフトウェアを使用すれば、パターンや外れ値を通知、比較、整理、特定し、データの関係性や変化を明らかにできます。
複数のデータソースから知見を集約して迅速に取得
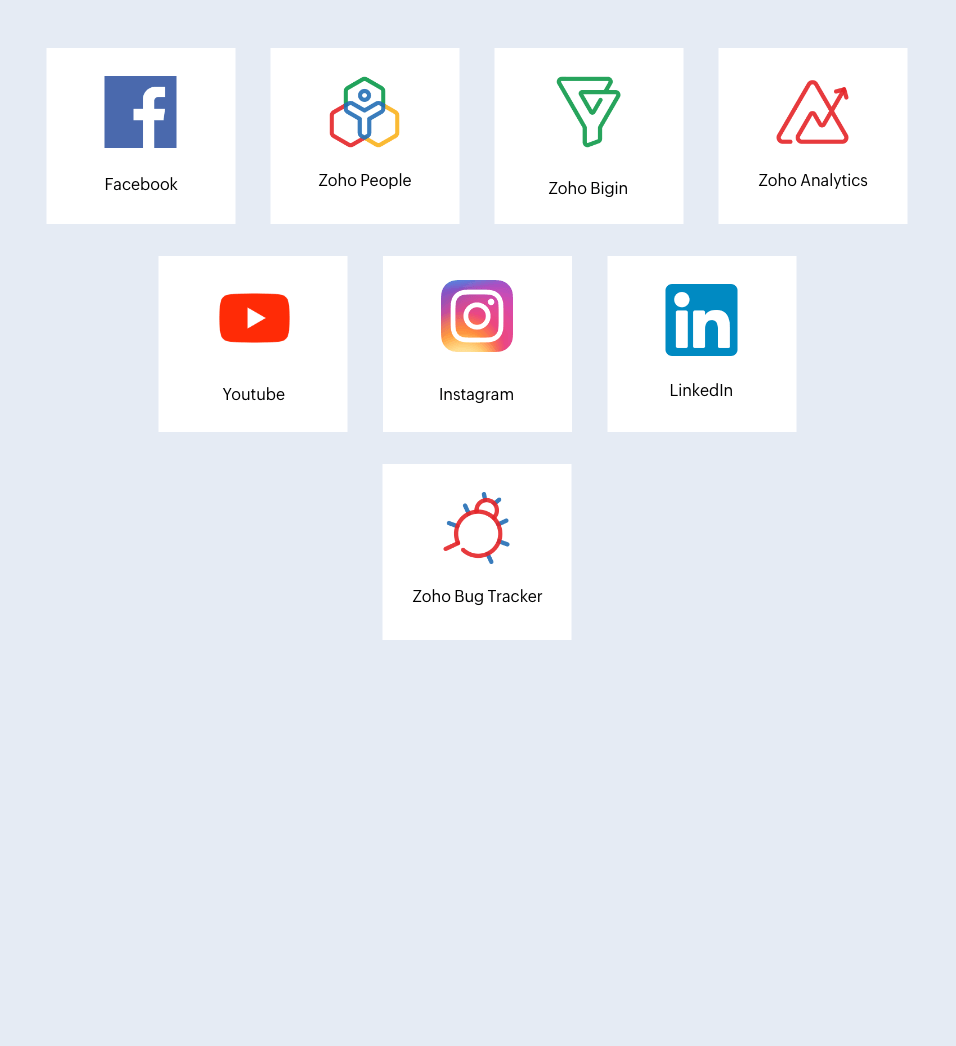
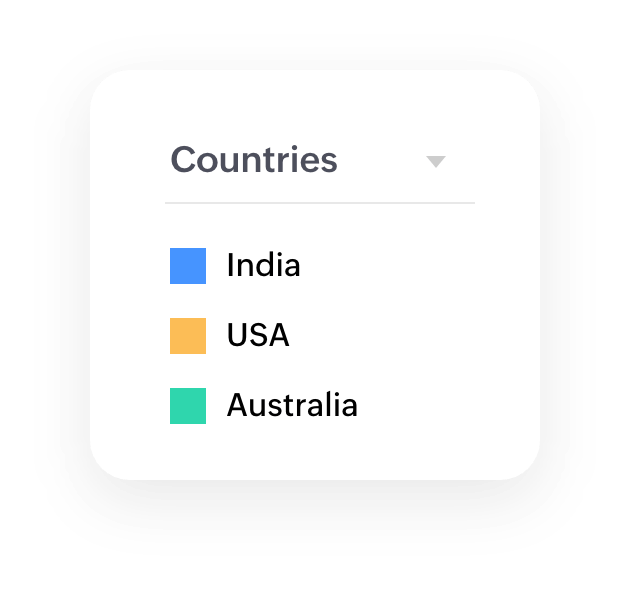
ファイルやデータベース、クラウドドライブ、Web URLフィード、その他アプリケーションからのデータを可視化できます。
- ドラッグ&ドロップビルダー
- 拡張分析
- 安全なコラボレーション
お客さまの声

"The biggest impact is that the majority of employees can interact on the platform; we can now create more metrics that help management make better decisions."
Eduardo, Chief Developer, Kumi Motors
詳細はこちら"Our sales team is able to enter product data with pictures in the Zoho Creator app. And the back office is able to run reports and analytics to manage marketing campaigns and measure store performance with real-time data, avoiding emails, Excel, etc."
Srini Dadi,CIO, Stella & Chewy’s