Your destination for data
Visualize key performance indicators, and analyze business data with interactive charts, gauges, tables, and more.
- Drag-and-drop design
- Simple and easily customizable
- Real-time multidevice dashboards

A French clothing manufacturer's one-stop-solution for business data
"We have a single tool to keep track of everything, creating a dynamic that allows sales and marketing to work together. Using the same tool is essential—it has revolutionized the way we work."
Emily Bertrand, Marketing and Communications Manager - Sdez
What's a dashboard?
Dashboards help establish a daily data monitoring habit, by sourcing data from multiple apps, and offering a comprehensive view of your business’s health.
They contain charts, reports, and widgets that forecast business trends, and display KPIs like number of projects, customers, profits, and percentages.
Dashboards increase productivity and collaboration
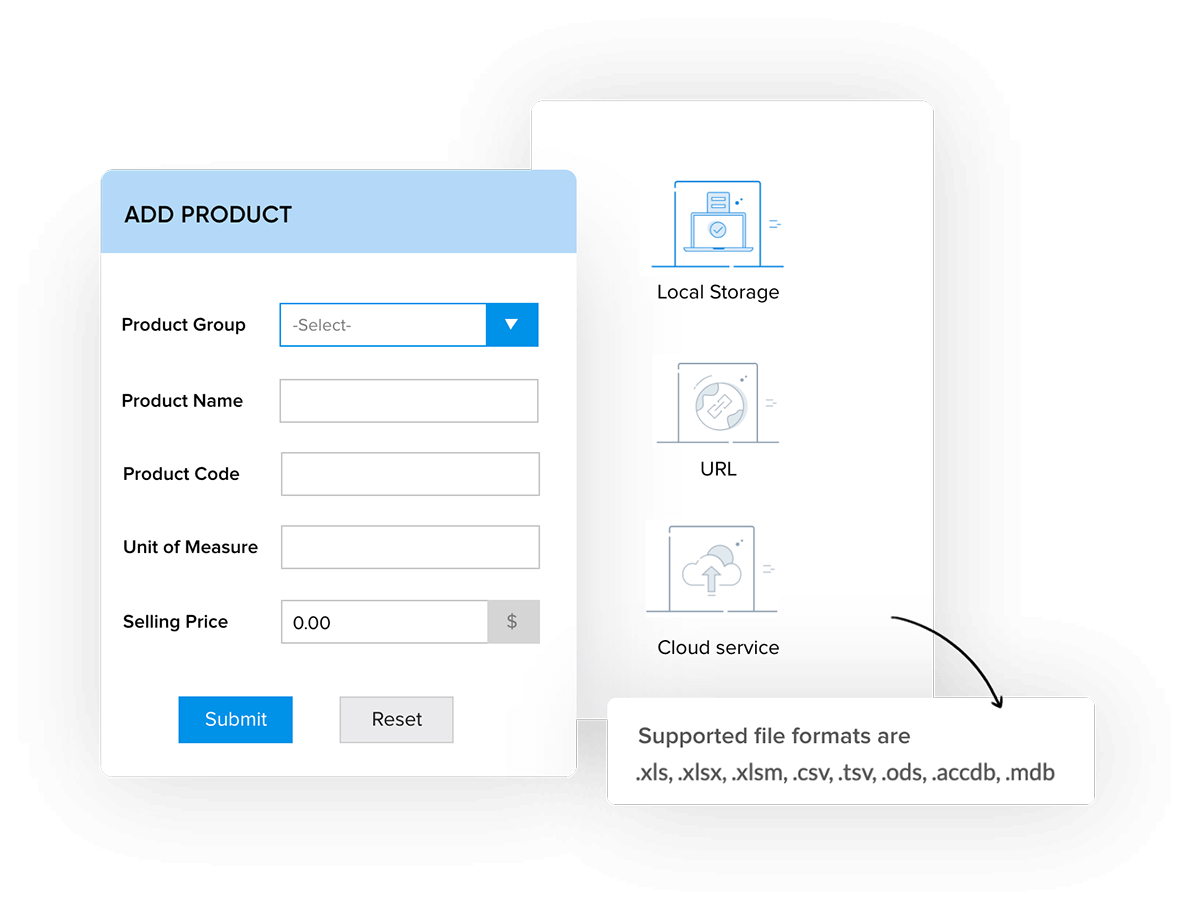
Integrate extensively
Pull information from various forms and reports across apps, or use the API to extract data from other MySQL servers, Oracle, or spreadsheets, to display on your dashboards.
Improve focus
Identify priority tasks by curating key metrics on a live dashboard, then display it on a TV, so your team members stay informed and can complete projects on time.
Visualize information
Represent complex business data in visual graphs and charts. Keep your team updated in real time to help them grasp important metrics more easily.
Identify issues
Overcome obstacles before they happen—dashboards help catch issues and solve problems faster. You can even set up alerts so you immediately know when something goes wrong.
HTML + CSS + Deluge
Enhance your dashboards with custom layouts, or use Deluge, our properietary scripting language, to take your visualizations even further. Deluge offers predesigned code blocks you can use to manipulate data on your dashboard or create custom actions and processes.

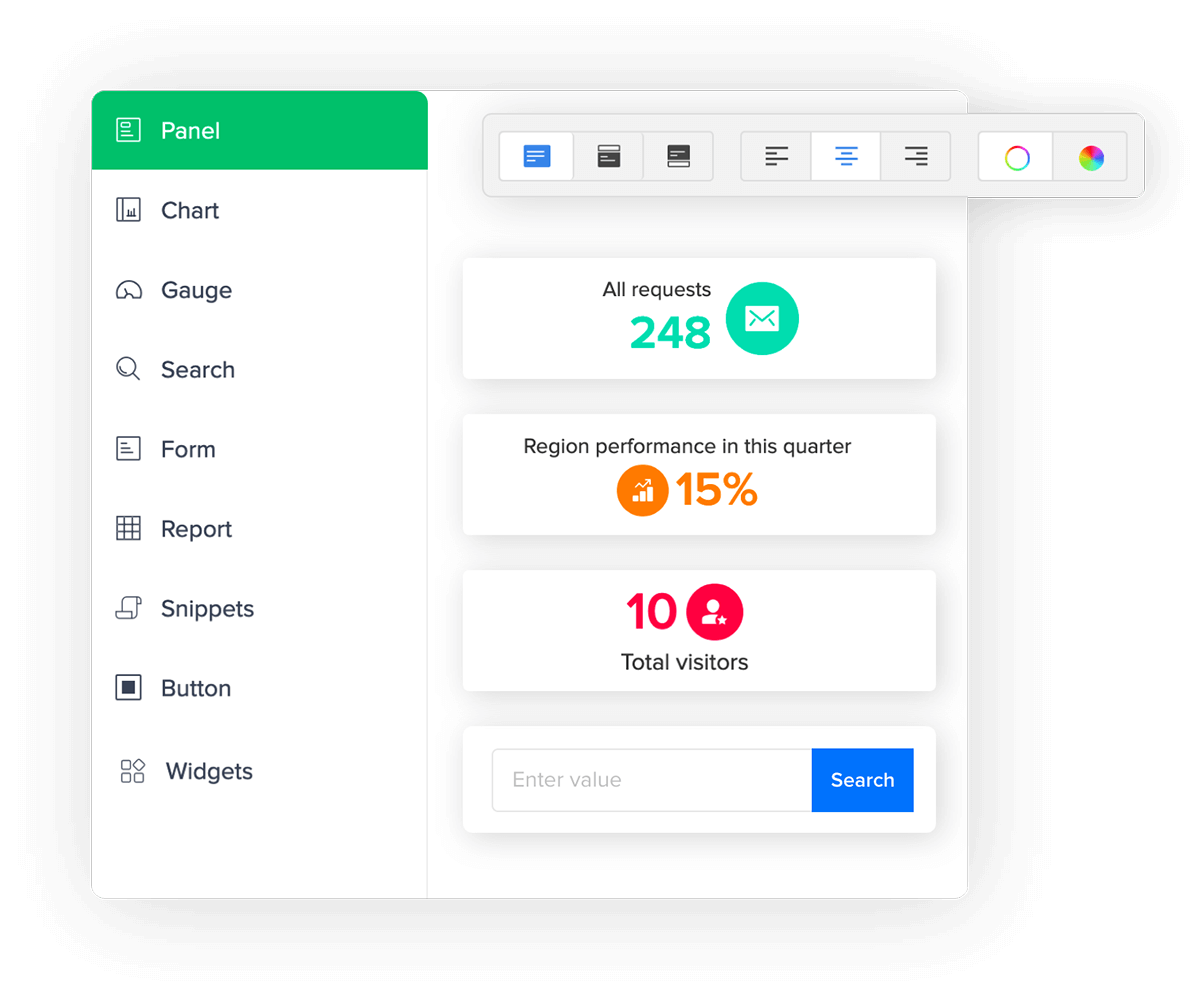
Embeddable Widgets
Use prebuilt panels to illustrate metrics like total, average, minimum, and maximum. You can also embed six different types of charts and reports representing your business health, as well as forms to collect data.

Zoho Markup Language
ZML is an alternative way to customize your dashboards. When traditional design languages overwhelm you, ZML can be an easier, mobile-friendly way to ensure your dashboard appears and behaves exactly as you want it. The language uses editable tags, each referring to a specific element in your dashboard, like reports, forms, or panels.

From data to decisions. Create over 40 types of reports.
- Sales
- Operations
- Marketing
- Project Management
- Academia