- HOME
- Management
- Identify your best customers and don’t let them go.
Identify your best customers and don’t let them go.
- Last Updated : August 7, 2023
- 1.5K Views
- 6 Min Read
Why segment your customer database?
Do you know who your best customers are? Perhaps you consider the customers that are spending thousands of dollars on your products to be the best—and for good reason. They are your VIPs. But, your best customers in the long run could end up being the ones who are the most loyal and regular in their purchases, and supply a steady source of income to your business. This group may even likely be in a position to start making bigger purchases, given that they’ve demonstrated consistent satisfaction with your products.
The 80/20 rule in statistics, also known as the Pareto Principle, states that for any given event, roughly 80% of an effect comes from only 20% of its cause. In a business context, this means that 20% of your customers tend to contribute to 80% of your total profits. Everyone would like to confidently target their best customers (the 20%) for future growth. However, identifying your best customers and retaining them is the challenge here. Customer segmentation—dividing your customer base into meaningful groups based on some common characteristics — is the solution.
Customers can be grouped in a number of ways, such as geography, demographics, behavior, loyalty, and transactions to identify the customer’s lifetime value. Some of the benefits of customer segmentation include:
# Better understanding of your customers and their preferences
# Increased customer satisfaction and customer retention
# Better focus on marketing efforts by identifying groups that need extra attention
# Comprehensive knowledge of growth areas
# Targeted marketing—reaching out to loyal customers for their specific business needs
# Proper allocation of marketing resources and increased up-selling and cross-selling opportunities.
RFM model of segmentation
What is RFM, and why do all three metrics need to work together?
RFM is a segmentation model for measuring the lifetime value of your customers: Recency, Frequency, and Monetary value. These three essential metrics are used to determine the behavioral patterns of your customers and segment them into actionable groups.
– Recency: How recently did your customer purchase from you?
– Frequency: How many times did your customer purchase from you?
– Monetary value: How much money did your customer spend?
These metrics may sound straightforward, but it’s helpful to learn about each of them in more detail.
Recency
Recency is considered to be possibly the most important metric of the three. Attracting potential customers to make their first purchase is challenging, and it can be just as difficult to make them come back and buy from you again. A customer is considered active if they made a purchase from you recently. However, the definition of “recent” may vary from business to business. For a clothing store, it could be 3-4 months, but for a furniture store it could easily be 12-18 months.
Ideally, you will have three types of customers at all times: potential customers, who you plan to do business with in the future, current and active customers, who bought from you recently, and inactive customers, who bought a long time ago and haven’t made another purchase since. Understanding recency helps you identify the state that each customer is in. It is essential to create new active customers and keep your current customers active. If you have enough resources, you should also try to revive your inactive customers. So, when you notice a customer has purchased recently, that means that they are in a position where they are more likely to engage with your business if you reach out to them than someone who did business with you less recently.
Frequency
Frequency can be easily measured in numbers, but the rationale behind why a customer is a frequent buyer and why another one is not can be a mystery to marketers, and there isn’t much that they can do about it. How often a customer purchases from you is determined by different variables. For example, the typical usage of the product, its price, market trends, and the need for replacement. It is not always easy to measure and identify a customer’s satisfaction levels, or the reason behind frequent purchasing.
For example, let’s say you run a business supplying stationery products to companies and schools. When your competitor offers a heavy discount, your customers make their next purchase from them. The standard for satisfaction in this situation is based on price. After a few months, the same customer may need their stationery to be delivered urgently. If your competitor takes a week to fill the order, and you provide a quick service, the same customer will switch over to purchase from you. Now, the customer’s satisfaction is defined by the speed of delivery. It is essential to try and identify the reasons behind a customer dropping in purchase frequency. Not knowing this can be disastrous.
Again, frequency also varies for perishable and non-consumable products. Frequency metrics for a business that sells food and groceries will be different from a company that sells furniture. In conclusion, unless you identify and analyze the determining factor behind the frequency of their purchases, this parameter will have limited use.
Monetary
Is it true that the people who spent the most are your best customers? What if they only buy every 3 or 4 years, or what if they no longer use your product? Much like recency and frequency, the monetary element alone cannot help you find your best customers, but it is definitely the dominant metric of the three. Let us take a look at the details in the table below:
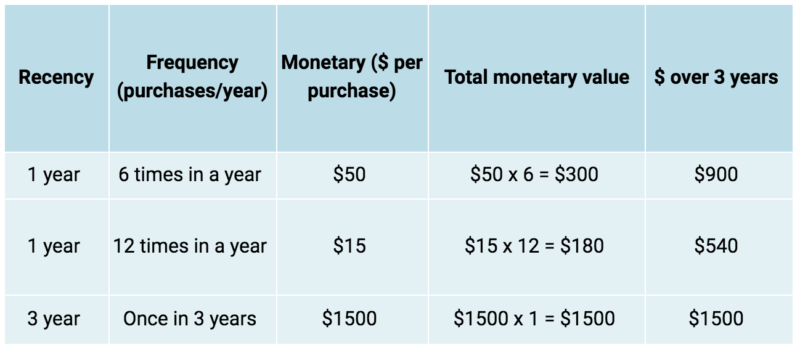
The multiple buyer spends an average of $50 on each of their 6 purchases in a year. That amounts to $300 dollars, while another customer spends $15 dollars 12 times in a year, which amounts to only $180. On average, the total spend over three years is $900 and $540 respectively. For example, these are the customers who would be buying small quantities of paint for a regular fix up, compared to a one-time buyer who spends $1500 once every three years to paint an entire house. Who is your best customer here?
Optimizing RFM
If you want to get more accurate insights on customer personas from your RFM data, you can combine additional attributes to optimize your RFM analysis. For instance, in a B2B context, customer titles can be a crucial variable to track in addition to your RFM analysis. If most of your top performing customers have the title of CIO, CTO, or project manager, you can market more to that segment of your potential customers. In small organizations, there are generally not as many defined titles, so it’s important to take into consideration the size of the company when you plan to optimize your RFM analysis this way.
Optimizing customer performance with age data is another such example. When marketing for insurance, age is an essential factor. If your analysis determines that your champion customers are between 40 and 55 years of age, you have now discovered a meaningful piece of knowledge that can be used for your marketing strategies.
Similarly, geography can reveal productive information. The effectiveness of advertising and the relevance of a product often depend on geographic factors, such as population, cultural preferences, and climate. Knowing specifically where your best customers come from can help you position your marketing pitch to target new customers and address the needs of your existing champion customers. This can be done on a broad basis by sorting your RFM results by region, country, or ZIP code.
There are additional factors that can overlay your RFM analysis, such as income, gender, and the size of a customer’s company that can help you target smaller slices of an isolated customer base. You can use this information to apply better marketing strategies and get an insight into your buyers’ personas.
RFM score
The most commonly used method of assigning scores in an RFM analysis is to allocate numbers from 1 to 5 for each category in Recency, Frequency, and Monetary value, where 5 is the highest, and 1 is the lowest. If a customer has bought more products recently, you will assign a higher score in the R category. If the customer has made many purchases, you assign more points in the F category, and if your customer spends more money on their purchases, you would give them points in the M category. All these scores together make up the RFM score. There are some standard RFM customer segments that are already defined and are generally applicable:
Sample RFM Score Chart
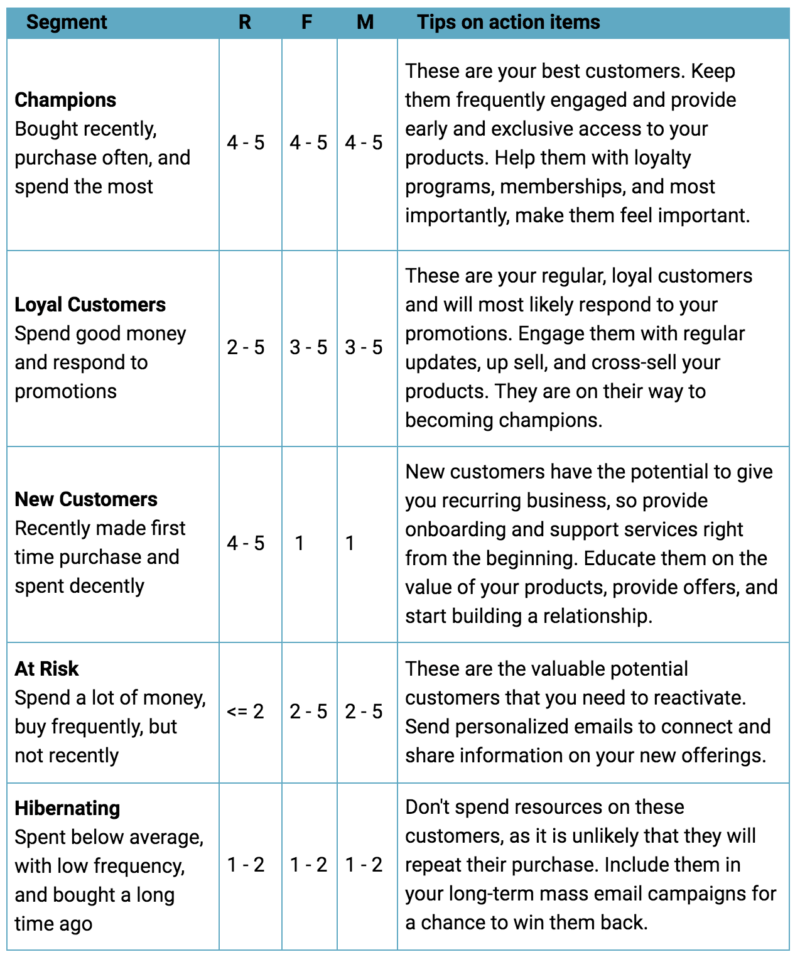
Understanding and identifying the recency, frequency, and monetary values of your business is necessary to segment customers in your database. Once you’ve set the scores for each segment, you can implement them in your CRM to identify the champions, loyal customers, those that need attention, and more. The optimized and extended RFM approach to market segmentation can be of great benefit in understanding your customers and retaining them long-term. Read more on this in the ebook: Segmenting Customers