Blueprint Analytics chart types
Blueprint Analytics has nine different chart types that give you valuable insights about the blueprint processes.
- Average blueprint duration
- Average stage duration
- Average transition duration
- Records entered blueprint
- Records exited blueprint
- Stage impressions
- Instances of transition
- Active records distribution
- Aggregate blueprint analysis
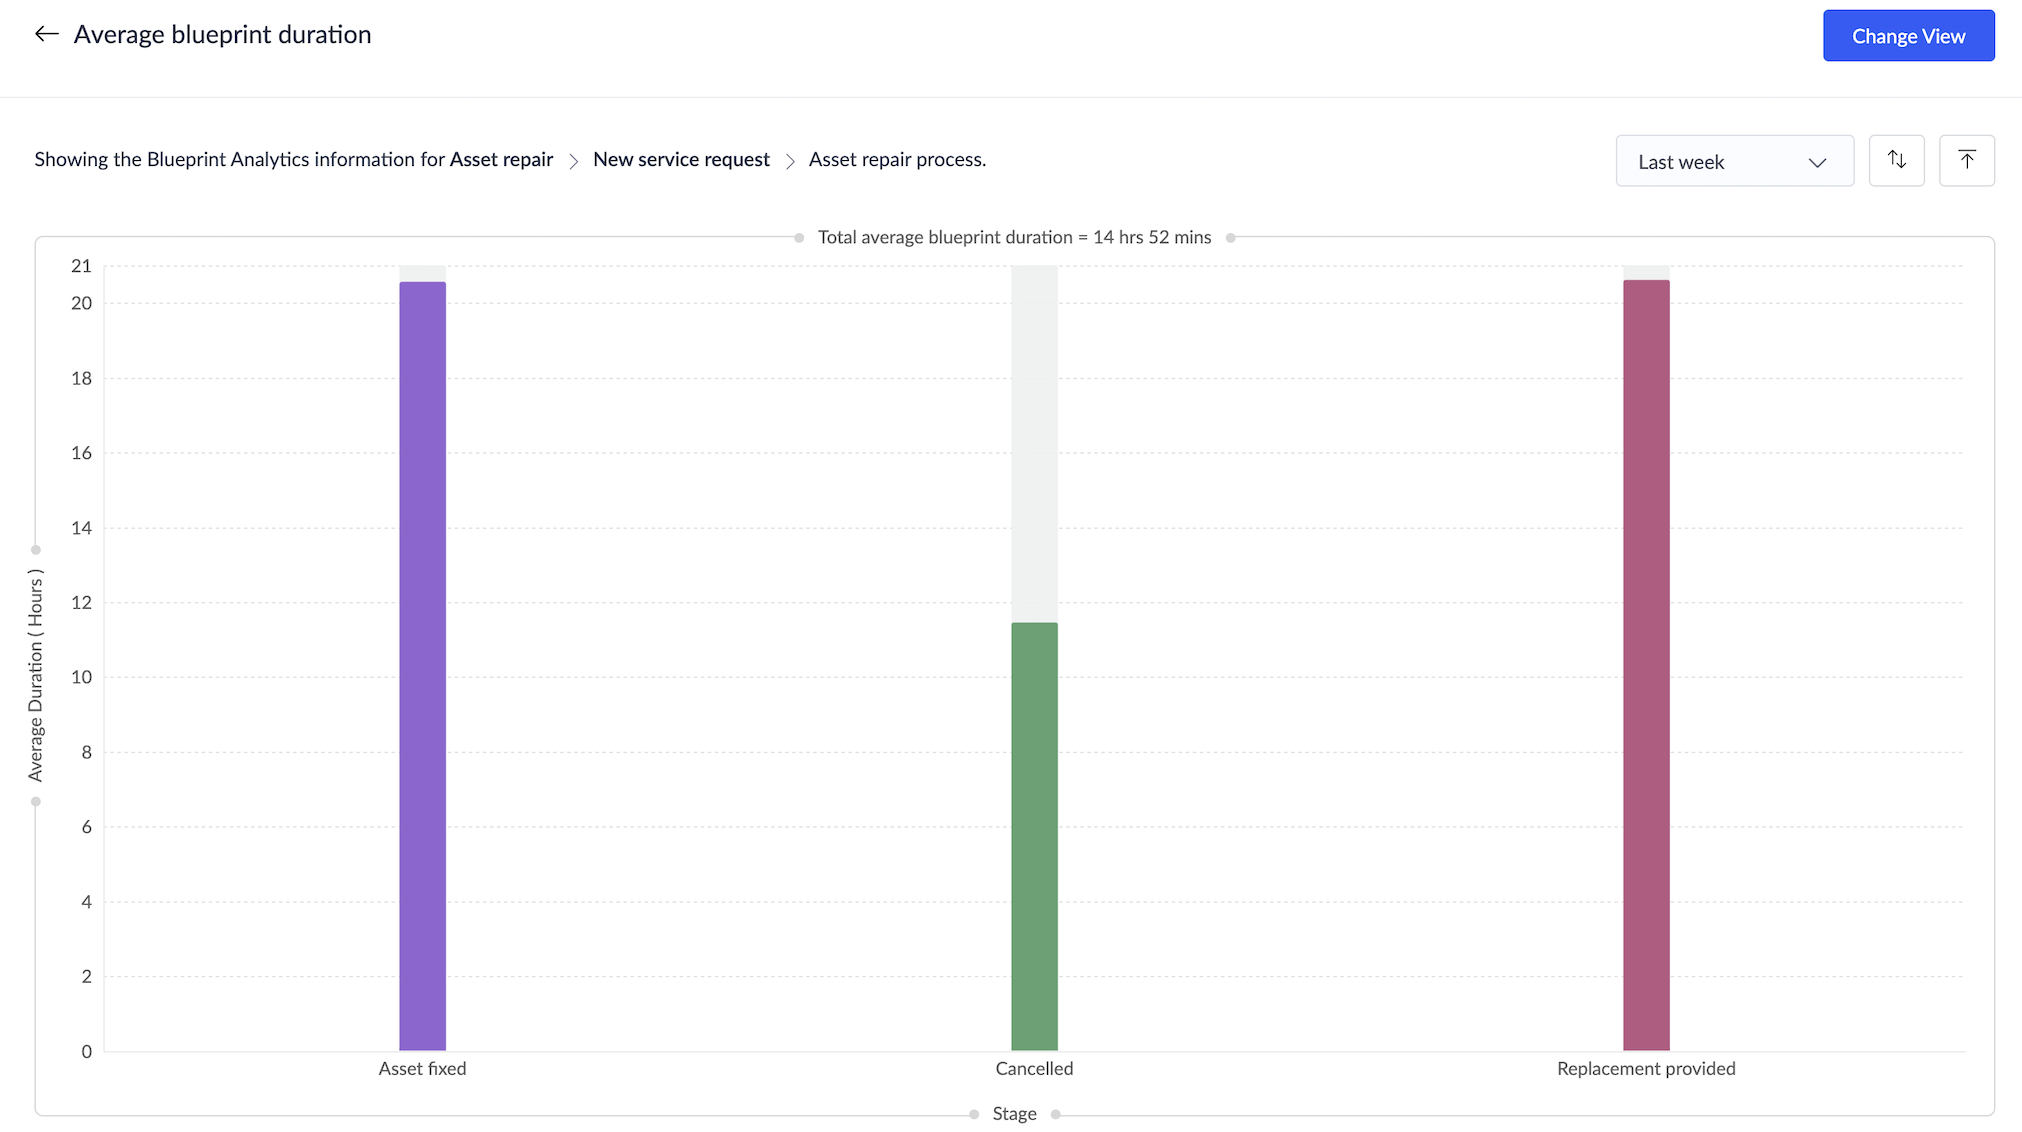
Average blueprint duration
This chart will show a graph denoting the time taken for a record to complete a blueprint from the start stage to the different end stages. In the chart, the X-axis will be the end stages of the blueprint and the Y-axis will be duration.
This chart will help an organization learn the time taken for its processes to be completed. The organization can analyze whether the duration is optimal and if it isn't, the other charts, like average stage duration or average transition duration, can be used to identify the bottlenecks in the process.
Average stage duration
This chart will show a graph denoting the average time a record stays in a specific stage for a given period. This denotes the time lapsed in between reaching a stage and leaving that stage. In the chart, the X-axis will be the stages of the blueprint and the Y-axis will be duration.
An organization can use this chart to learn about the bottlenecks in its business process. If the stage has multiple transitions, then the average transition duration chart can be used to figure out the transition that is taking up more time in the process.

Average transition duration
This chart will show a graph denoting the average time a record stays in a specific stage until a particular transition is performed. This chart may be similar to the Average Stage Duration chart, but will differ if there is a parallel transition or more than one way to leave that stage. In the chart, the X-axis will be the transitions of the blueprint and the Y-axis will be duration.
An organization can use this chart to learn the transition that is taking up more time in its business process. To speed up the process, the organization can add more transition owners.
![]()
Records entered blueprint
This chart will show a graph denoting the number of records that entered the blueprint in a specific time. In the chart, the X-axis will be the blueprint name and the Y-axis will be count of records.
The organization can find out the total number of employees' support requests that have been received.

Records exited blueprint
This chart will show a graph denoting the number of records that exited the blueprint during a specific time. This graph will be available as a bar chart, stacked bar, and donut pie types. In the chart, the X-axis will be the name of the end stages and the Y-axis will be count of records.
This chart will give a breakup of the records that exited through the different stages of the blueprint. An organization can use this to learn about the resolution trends in the process.
An IT support team can either fix the issues in the asset or they will provide replacement asset. This chart can be used to analyze the escalation matrix of the IT asset management process.

Stage impressions
This chart will show a graph denoting the number of records that passed through the different stages of the blueprint. In the bar chart, the X-axis will be the stages of the blueprint and the Y-axis will be count of records.

Instances of transition
This chart will show a graph denoting the number of times the transition is performed. In the bar chart, the X-axis will be the stages of the blueprint and the Y-axis will be count of records.
This chart can help in identifying the predominant trends in its business. A higher transition occurrence will denote the action is repeated performed over the records.
![]()
Active records distribution
This chart will show the number of record currently across the stages of blueprint. In the bar chart, the X-axis will be the stages of the blueprint and the Y-axis will be the number of records.

Aggregate blueprint analysis
This chart is a consolidated chart in which all the insights regarding the blueprint will be displayed. Due to its in-depth visualization of the blueprint data, this chart will be helpful to better understand the statistics of the blueprint.
This chart gives a consolidated view of all the information present in the eight other types of charts. An added advantage of this chart is that the information displayed in it follows the same structure of the blueprint.
