Website traffic analytics: How to read your data and take action

Traffic is up. Sessions look healthy. The dashboard is full of green arrows and yet — conversions are flat, revenue targets are slipping, and the leads coming through aren't closing. A visitor from a broad social ad was watching someone's dog video two seconds before clicking your link. Treating every visitor identically — same page, same benchmark, same budget logic — is one of the most costly mistakes in digital marketing.
Website traffic analytics is the practice of collecting and interpreting data about your site's visitors to improve marketing, UX, and conversions. It doesn't just tell you how many people showed up — it tells you who they are, what they wanted, whether you gave it to them, and exactly where you lost the ones who left.
The three questions every analytics report should answer
Most teams look at data and ask: how much? But the better question is always: so what?
In website traffic analytics, the first question to answer is: where are your visitors coming from — and what intent do they carry? Not all traffic sources are equal. A visitor from branded organic search is evaluating a purchase. A visitor from a broad social ad was browsing, not buying. Direct traffic converts at ~3.3% in B2B. Paid social sits at ~0.9%. That gap isn't about creative quality - it's about intent. Your channel breakdown is a map of buyer psychology. Read it that way.
The second question: what do visitors actually do when they land? Bounce rate. Session duration. Pages per session. These aren't engagement stats — they're signals about whether your pages deliver on the promise that brought someone there. A pricing page bouncing at 70% is a different problem than a blog post bouncing at 70%. The number alone doesn't tell you which. Segment before you conclude anything.
The third question: are they converting — and exactly where, through what path, on which device? A site-wide conversion rate is a blended average that hides everything interesting. The version that drives decisions is: conversion rate by channel, by page, by device, by traffic temperature. A 1-point lift in conversion rate directly reduces what you pay to acquire each customer - because you're getting more customers from the same traffic spend.
These aren't quarterly questions - they're weekly ones. The gap between when something breaks and when you notice it is exactly where revenue disappears.
Website traffic sources: Conversion rates by channel
Not all traffic is equally valuable. And the gap between channels is wider than most teams realize.
Channel | Core Insight | Key Data / Benchmark | What It Actually Means | What You Should Do |
Direct | Most underappreciated signal | ~3.3% conversion rate (Ruler Analytics, 2025) | High intent traffic; reflects brand strength, not campaigns | Monitor trends closely — a drop indicates brand erosion, not marketing failure |
Organic Search | Query intent defines quality | ~2.4% visitor-to-lead (FirstPageSage, 2025) | Not all traffic is equal — informational vs high-intent queries vary drastically | Segment by query intent (e.g., “what is” vs “pricing”) instead of using blended conversion rates |
Paid Search | Landing page determines performance | 13.5% (single CTA) vs 10.5% (multi-CTA) (Unbounce, 2026) | Traffic is already warm — conversion depends on experience after click | Audit landing pages first before blaming channel performance |
Paid Social | Often mis-measured | ~0.9% direct conversion rate (misleading) | Works primarily as an assist channel, not last-click converter | Check assisted conversions before reducing budget |
AI-Referred Traffic | Emerging high-intent channel | ~1.2× higher conversion vs organic (WebFX, 2025) | Users arrive with stronger intent due to AI-curated discovery | Track separately — avoid misattributing to direct or organic |
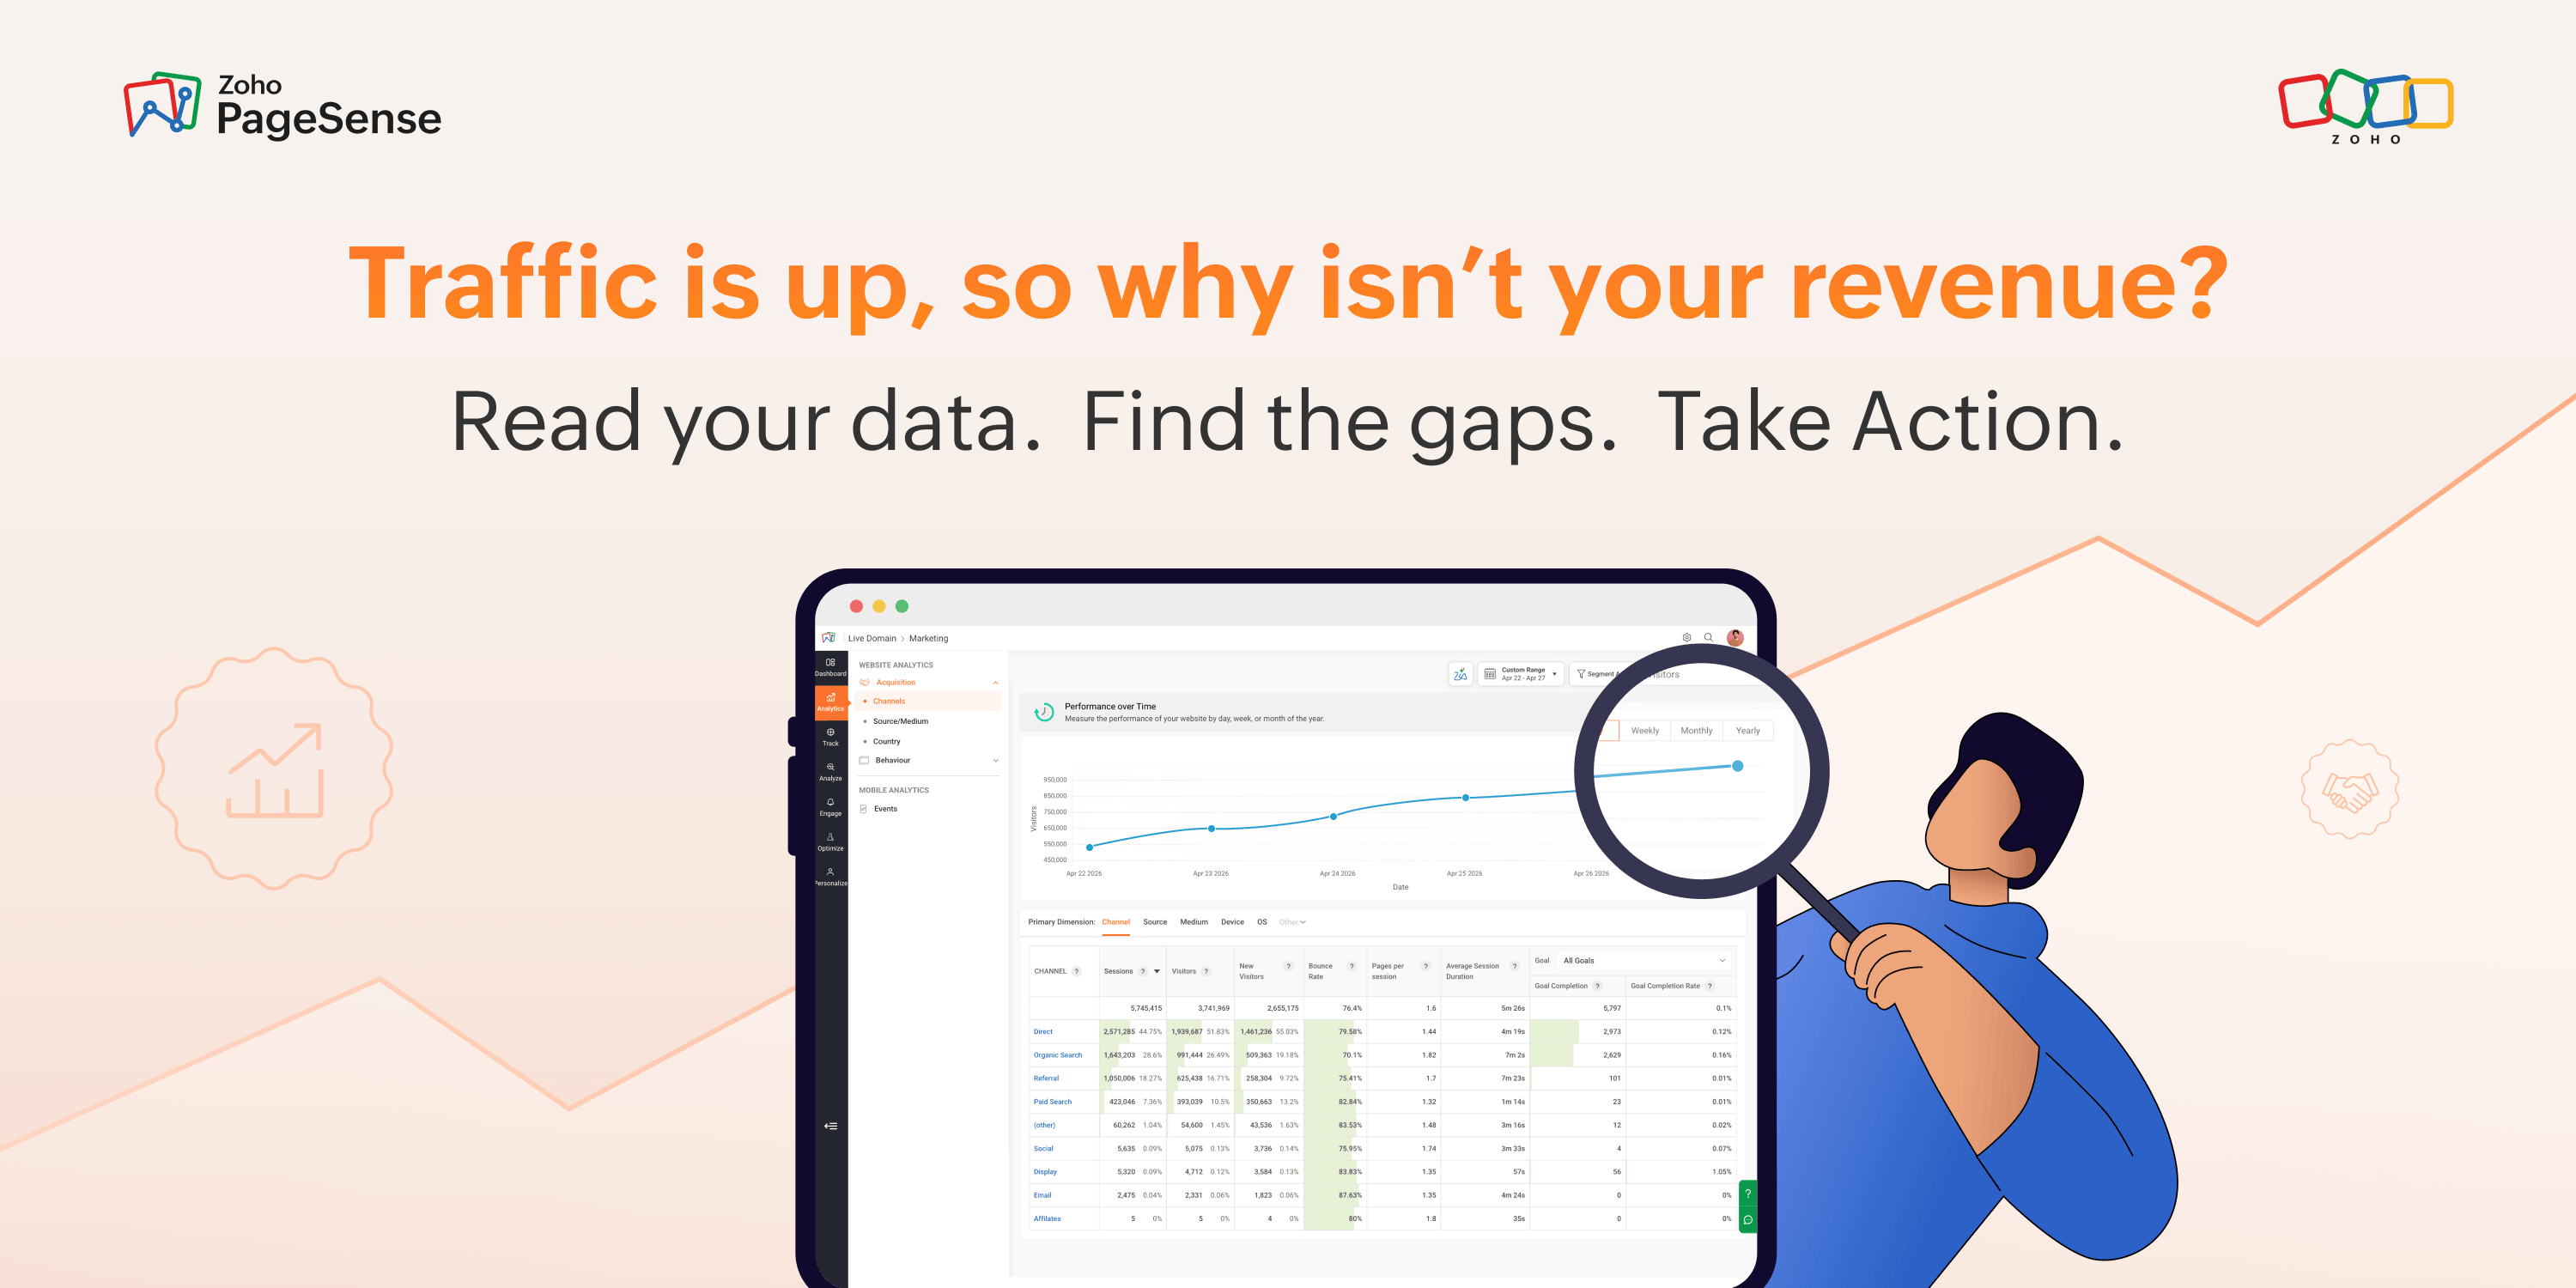
PageSense's traffic source report breaks all of this down in a single view — volume by channel, conversion rate by channel and side by side — so you can see which channels drive sessions versus revenue.
Understanding your website visitors
Traffic sources tell you where people came from. Visitor analytics tells you who they are, and that distinction changes how you design every page experience.
New vs. returning visitors is one of the most telling ratios on your site. A healthy acquisition-and-retention balance typically runs 60–70% new, 30–40% returning. If returning visitors drop below 20%, your retention is broken — email nurture isn't working, or the product isn't delivering on the marketing promise. If new visitors climb above 85%, your acquisition engine is running, but you're not building an audience that comes back.
Device split should reshape how you think about your site's experience, not just its design. Mobile accounts for approximately 64% of global web traffic (StatCounter, mid-2025) but converts at roughly half the rate of desktop — 2.2% versus 4.3% (SQ Magazine/DesignRush, 2025 — 26). A significant share of users genuinely research on mobile and complete their purchase on desktop — a cross-device journey that last-click attribution records as a mobile bounce, when it should count as step one of a conversion. But a meaningful share of the gap is fixable: page speed, form friction, CTA placement. Website visitor analytics tells you where your mobile experience is actually breaking down.
Geographic data matters more than most teams use it. If a meaningful share of your traffic comes from regions you don't serve, you have an audience mismatch that no amount of CRO will fix. If high-converting geographies are under-represented in your paid targeting, you have an allocation opportunity hiding in plain sight.
Website analytics demographics — age, interest categories, industry — validate whether the audience you're attracting matches the audience you're building for. If your product targets mid-market B2B buyers and your demographic data shows predominantly early-career visitors from consumer categories, your SEO or content strategy is off-target in a way that traffic numbers alone won't reveal.
In our analysis of PageSense accounts, teams that segment visitors by device and source — rather than looking at blended site-wide metrics — identify conversion problems an average of 40% faster and with more precision than those relying on aggregate data alone.
Reading engagement and behavior data
This is where most teams get lost. Engagement metrics look simple — bounce rate goes down, good. Session duration goes up, good. But that logic fails constantly in practice.
Bounce rate is the most misread metric in analytics. A 70% bounce rate on a blog post read end-to-end is fine. A 70% bounce rate on your pricing page is a problem. Context, page type, and traffic source determine whether it warrants action — not the number in isolation. Here are some useful benchmarks as composite industry guidance: e-commerce transactional pages, 45–65%, B2B SaaS 55–65% (Databox September 2024 — B2B median: 65.03%) and, content and blog pages 65–80%. Panic threshold: any conversion-focused page consistently above 70%.
Session duration can be deceptive. A visitor who is deeply engaged and a visitor who is completely lost can spend the exact same amount of time on a page. That's why duration is only meaningful when viewed alongside other signals such as bounce rate, pageviews, visitor journeys, and conversions. The real question isn't how long people stayed—it's what they did while they were there.
As a general industry guideline, B2B sites tend to see 2.5–4.0 pages per session for non-blog traffic. Below 1.5 usually means visitors can't find what they came for — the navigation is failing them or the site architecture doesn't surface obvious next steps.
Here's the hard limit of quantitative data: it tells you what happened, not why. A 68% bounce rate on a product page could mean slow mobile load times, a headline mismatch, pricing filtering out unqualified visitors (which may be fine), or a CTA that doesn't register as clickable. These are completely different problems with completely different fixes.
That's where heatmaps close the gap. PageSense heatmaps show you exactly where users click, where they scroll, and where they stop — giving you the visual layer that traffic data alone can never provide. You stop guessing at causes and start seeing them.
Clear win. Clear problem. Clear action. That's a report that gets remembered and a budget that gets protected.
Website analytics best practices start here: stop reporting what happened and start explaining what it means and what you're doing about it.
Free vs. paid tools: What you actually get
Google Analytics 4 is free and powerful, but it has a steep learning curve and lacks native heatmaps, session recordings, or built-in A/B testing. You'll need additional tools to get the full behavioral picture.
Microsoft Clarity is free with unlimited heatmaps and session recordings you actually get — genuinely useful for behavior analysis. It doesn't include traffic analytics, conversion tracking, or A/B testing, which means you're still managing multiple tools
Hotjar covers behaviour analytics well but becomes expensive at scale, and its traffic analytics layer is limited.
Zoho PageSense offers a free trial with full web analytics, heatmaps, session recordings, and A/B testing in one platform — meaning you're not managing three separate logins, three separate data models, or three separate invoices to see the complete picture. For teams who need quantitative and qualitative data in one workflow, that integration is the practical difference between analysis that produces decisions and analysis that produces more questions.
Are you winning or losing?
Metric | B2B SaaS | E-commerce | Finance |
Visitor-to-lead conversion | 1.5–5%; top 10%: 8–15% | 1.8–2.5% | 2–5%; top performers: 10%+ |
Bounce rate (transactional pages) | 55–65% | 45–65% | 50–68% |
Mobile vs. desktop conversion gap | ~1.5–2x | ~2x | Varies |
Pricing page (high-intent traffic) | 5–8% top quartile | — | — |
Single-CTA landing page | 13.5% median | 13.5% median | — |
Sources: Varos 2026 · FirstPageSage 2025 · Unbounce 2026 · Databox 2024 · Contentsquare 2026 · Ruler Analytics 2025
Use these as anomaly detectors, not targets. A B2B SaaS company converting at 0.6% visitor-to-lead has a meaningful gap to investigate. One converting at 3.8% should focus on traffic quality and volume - not more CRO test.
Zoho PageSense combines web analytics, heatmaps, session recordings, and A/B testing in one platform - built for teams who need behavioral context alongside traffic data, without managing three separate tools. [Start your free trial.]
Frequently Asked Questions
What is a good website traffic conversion rate?
It depends on your industry and traffic source - but here's a useful baseline: the median visitor-to-lead conversion rate for B2B SaaS sits between 1.5% and 5%, with top-performing teams reaching 8–15% on high-intent pages like pricing and demo-request pages (Varos 2026, FirstPageSage 2025). E-commerce averages 1.8–2.5%. The more important number is conversion rate by channel — a 3% rate from cold paid social traffic is exceptional; the same 3% from warm branded organic search is underperforming. If you have one number to optimise, make it conversion rate on your highest-intent pages for your best-performing traffic source. That's where the biggest revenue gains hide.
Why is my website traffic high but conversions are low?
High traffic with low conversions almost always means one of three things: your traffic is mismatched to your offer (the visitors arriving aren't the buyers you need), your landing page isn't delivering on the promise that brought them there, or there's friction in the conversion path — a slow page, a confusing CTA, a form with too many fields. The fastest diagnostic is to segment your conversion rate by channel and device. If paid social drives 40% of your sessions but less than 10% of conversions, the issue is likely audience intent — not your product. If mobile converts at half your desktop rate, look at page speed and form length first. Traffic volume is rarely the problem. Traffic quality and page experience almost always are.
What is the difference between website traffic analytics and web analytics?
Web analytics is the broader discipline — it covers everything from traffic sources and session behaviour to e-commerce tracking, goal funnels, event tracking, and site performance. Website traffic analytics is a subset focused specifically on understanding visitor volume, channel sources, and the patterns in how people arrive at your site. In practice, most teams use the terms interchangeably, but the distinction matters when choosing tools: a platform like Google Analytics 4 covers the full web analytics spectrum, while tools like PageSense layer in behavioural data — heatmaps, scroll depth, session recordings — that pure traffic analytics tools don't provide. If you only track where visitors come from, you're doing traffic analytics. If you also track what they do and why they leave, you're doing web analytics properly.
How do I check website traffic for any website — including competitors?
For your own site, Google Analytics 4 and Zoho PageSense give you exact data. For competitor sites, exact numbers aren't publicly accessible — but tools like Similarweb, Semrush Traffic Analytics, and Ahrefs Site Explorer provide estimated traffic volumes, top traffic sources, and keyword breakdowns based on panel data and clickstream modelling. These estimates carry a margin of error (typically ±15–30% for mid-size sites), so use them for directional insight rather than precise benchmarking. The most reliable competitive signal isn't raw traffic volume anyway — it's which channels your competitors are investing in and which pages are driving their organic growth. That tells you where the real battle for your audience is happening.
What website traffic analytics tools are free to use?
Several capable free options exist. Google Analytics 4 is the most powerful free traffic analytics platform available — it covers channel attribution, audience demographics, conversion tracking, and event data in depth, though it has a steep learning curve and no built-in heatmaps or session recordings. Microsoft Clarity is free with no usage limits and includes heatmaps and session recordings, but it lacks traffic source analytics and A/B testing. Zoho PageSense offers a free trial that combines web analytics, heatmaps, session recordings, and A/B testing in one place - the most complete free starting point for teams who need quantitative and qualitative data together. For competitor research, Similarweb's free tier gives limited monthly traffic estimates. The right free tool depends on whether your biggest gap is traffic data, behavioral context, or both.


Comments