From Customer Lifetime Value to Scalable Growth
- Last Updated : January 30, 2026
- 538 Views
- 6 Min Read
Customer Lifetime Value (CLV) helps you understand how much revenue a customer is likely to bring to your business over the entire period of their relationship with you. Instead of looking at a single purchase or a single month, CLV shows the long-term value of each customer.
When you analyze CLV, you move from short-term transactions to long-term customer relationships. This shift helps you make better decisions about how much to spend on acquisition, how to retain customers, and where to focus sales and marketing efforts.
In this solution, you learn how to calculate and analyze CLV at the organization level, for customer segments, and for individual customers and build relevant reports and dashboards using Zoho Analytics.
Calculating CLV at the Overall Level
Overall/Org level CLV gives you a single view of how much value an average customer brings to your subscription business. This metric is useful for understanding the overall health of your customer base and how sustainable your revenue model is over time.
Overall/Org CLV Formula
For subscription businesses, a simple and effective way to calculate Overall CLV is to combine average revenue, average customer lifetime, and your gross margin percentage. This gives you a clear picture of long term profitability.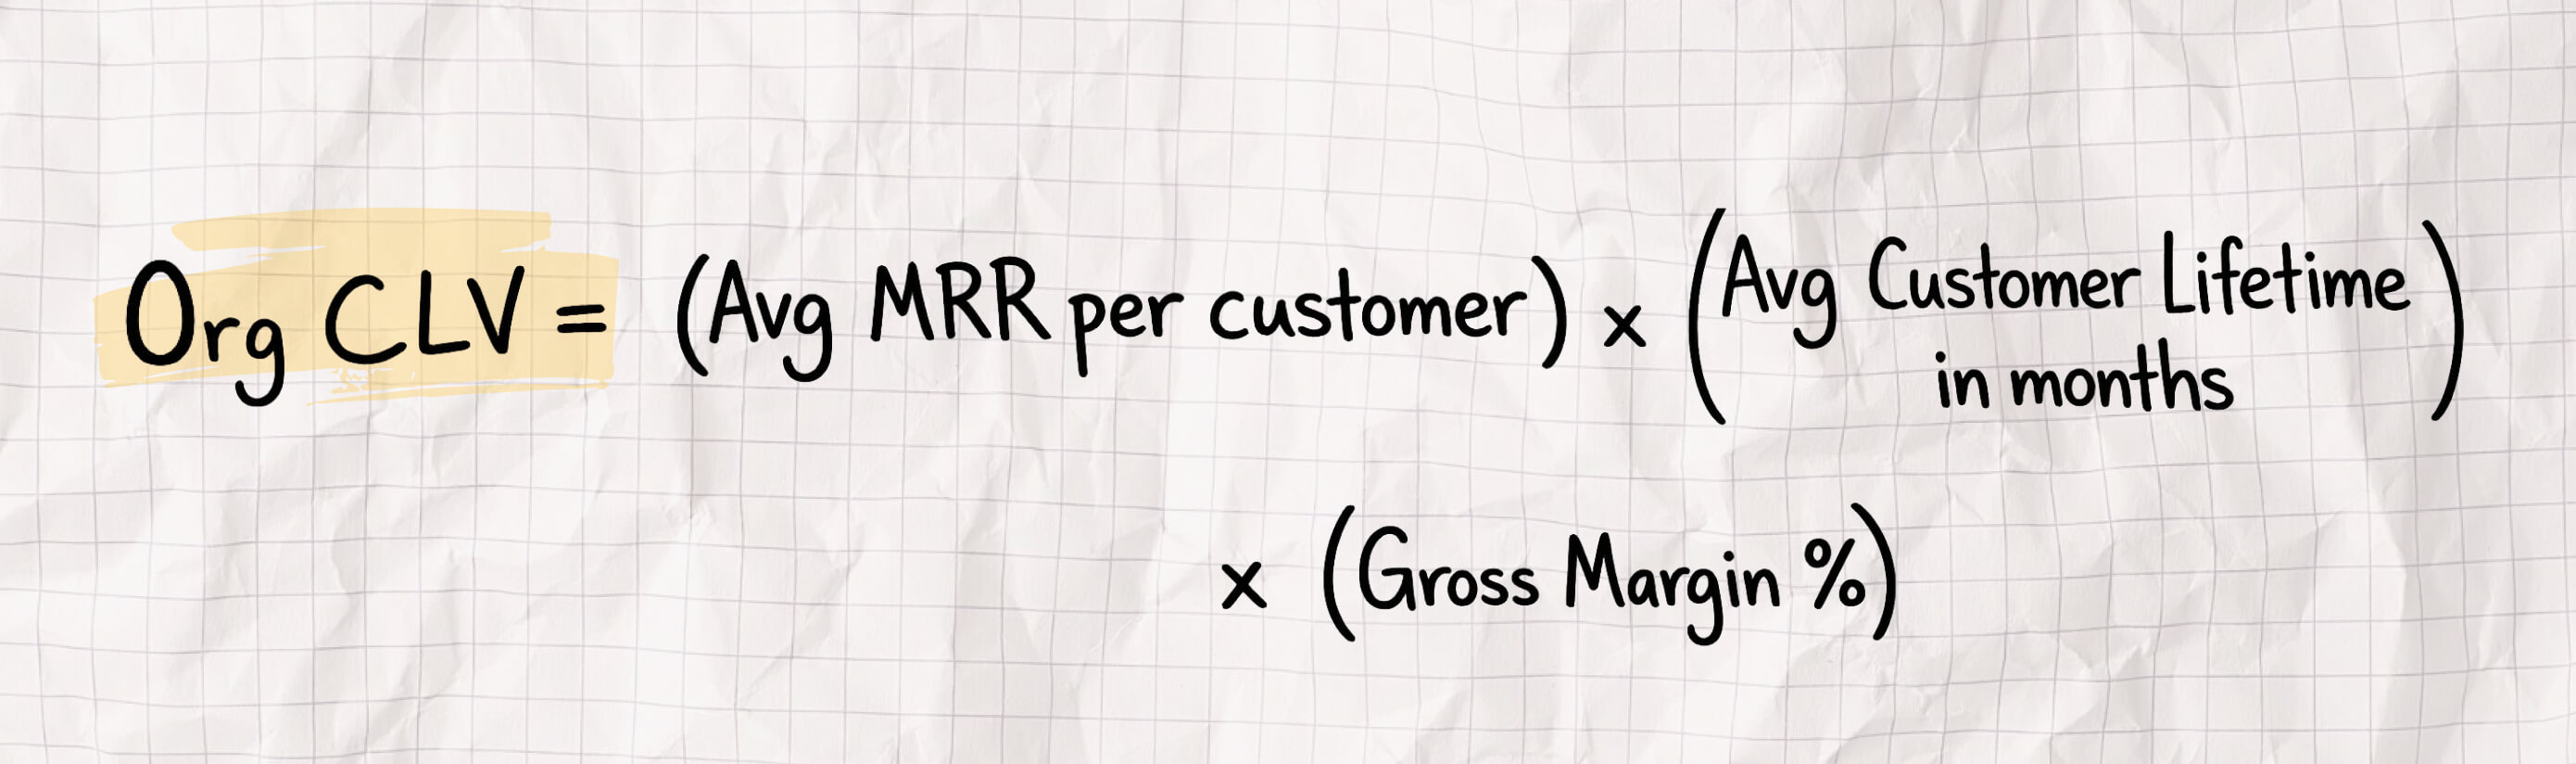
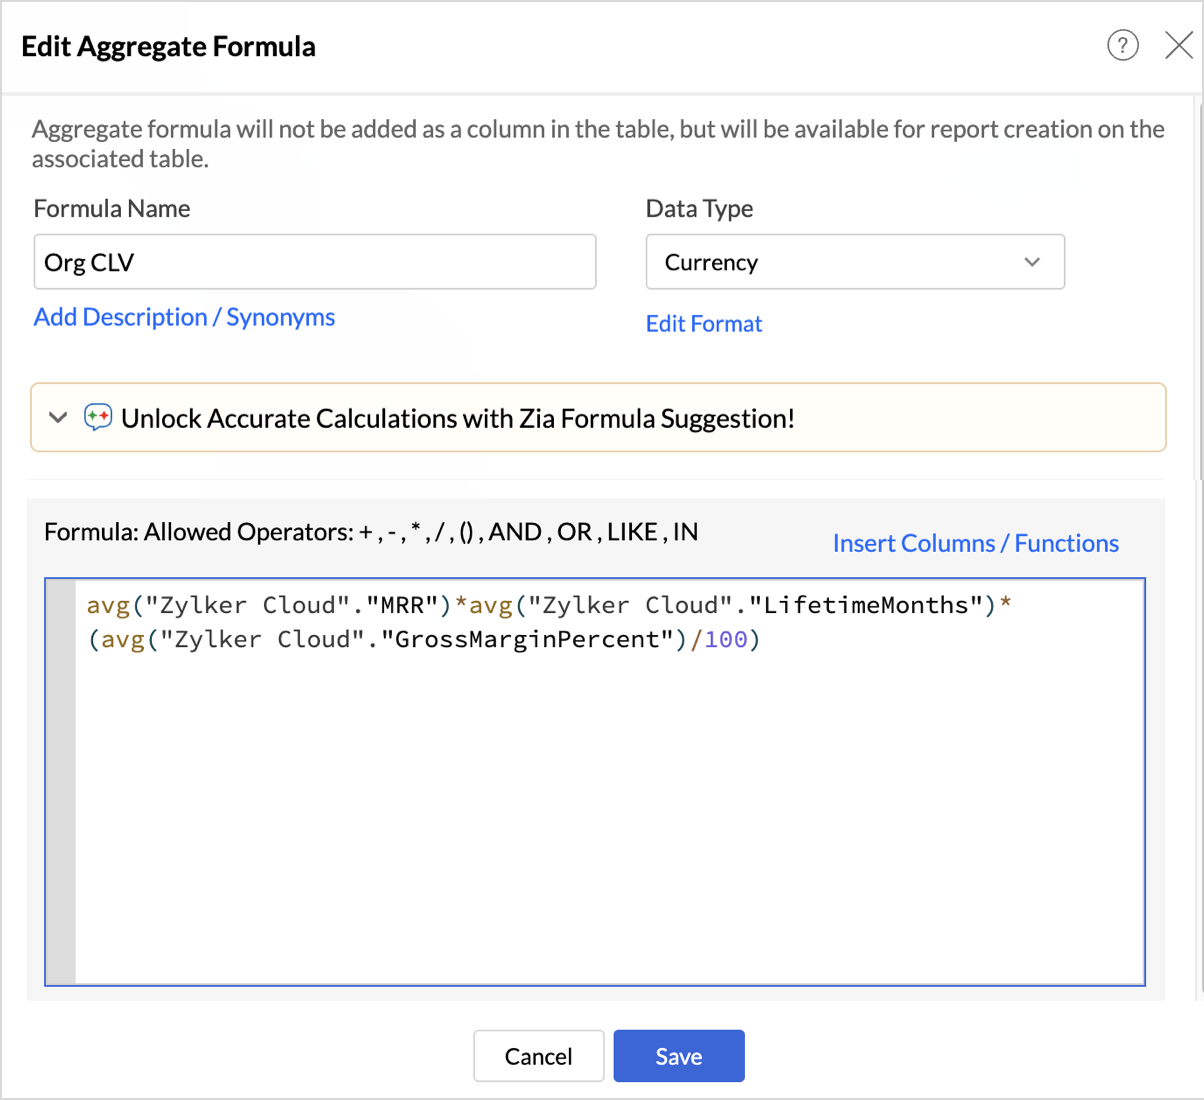
In Zoho Analytics, this CLV is created as an aggregate formula as shown below, making it easy to compute and reuse across reports and dashboards.
Example:
Consider your business metrics look like this:
Average MRR per customer: 50 USD, Average customer lifetime: 18 months, Gross margin: 80 percent
Organization CLV becomes: 50 multiplied by 18 multiplied by 0.80
which equals 720 USD
This means an average customer contributes 720 USD of profit across their subscription relationship.
Customer Lifetime Based on Churn Behavior
Customer lifetime is an essential part of CLV. Customer lifetime can be measured directly or estimated using your churn trends. The key is to arrive at a reasonable average that reflects how long customers stay with your product.
The simple way is:
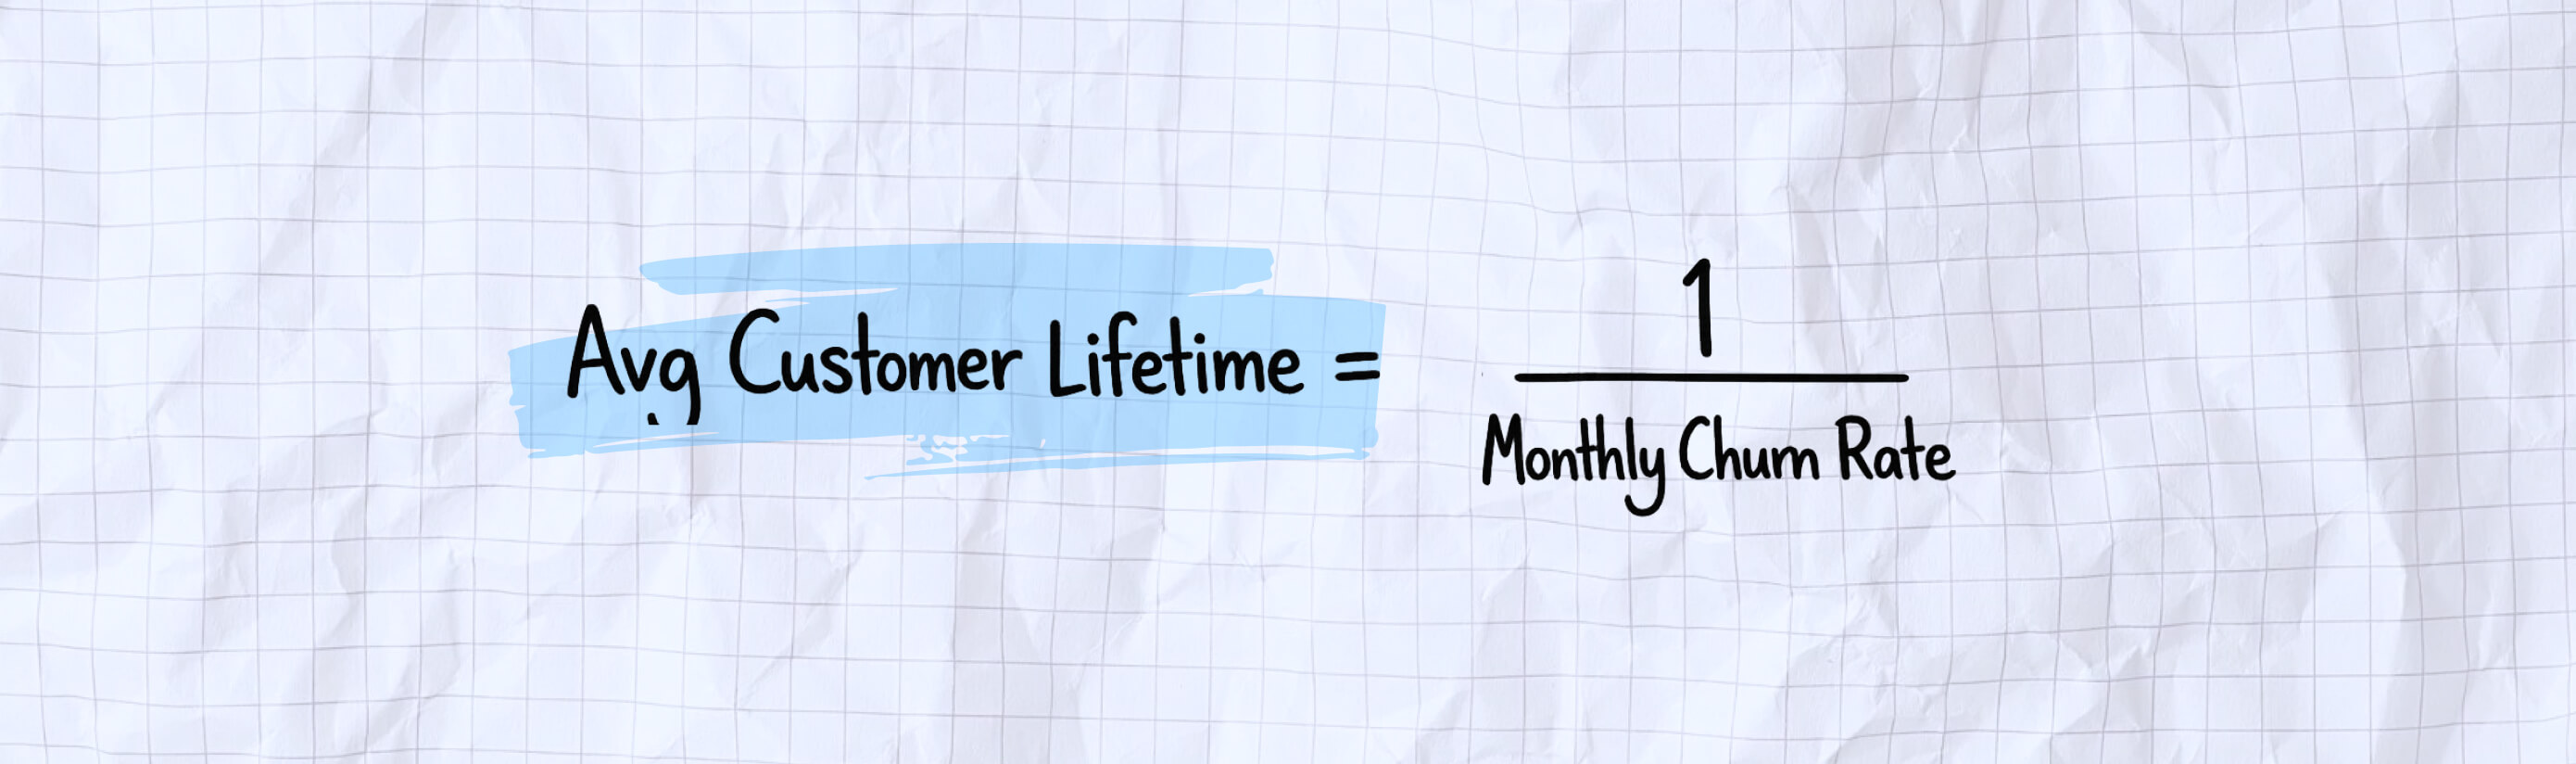
This allows you to connect churn performance with overall business value.
Example:
If your average monthly churn rate is 8 percent, then
Average Customer Lifetime = 1 divided by 0.08
Customer Lifetime = 12.5 months
CLV for Customer Segments
There are many ways to segment customers in a SaaS business. You can choose a method that matches your product, pricing structure, and customer behavior.
Here are common segmentation options:
- Subscription plan type
Examples include: Basic, Pro, and Enterprise plans. - Billing cycle: Monthly, quarterly, or annual subscriptions.
- Acquisition channel: Paid ads, search engines, referrals, partner programs or email campaigns.
- Customer size: Small businesses, mid market customers or enterprise accounts.
- Industry or vertical: Technology, retail, education or healthcare.
Calculating Segment Level CLV
Segment level CLV builds on the same principles as Overall CLV but applies them to each segment separately. The key difference is that each segment has its own revenue pattern, lifetime trend, margin and service cost.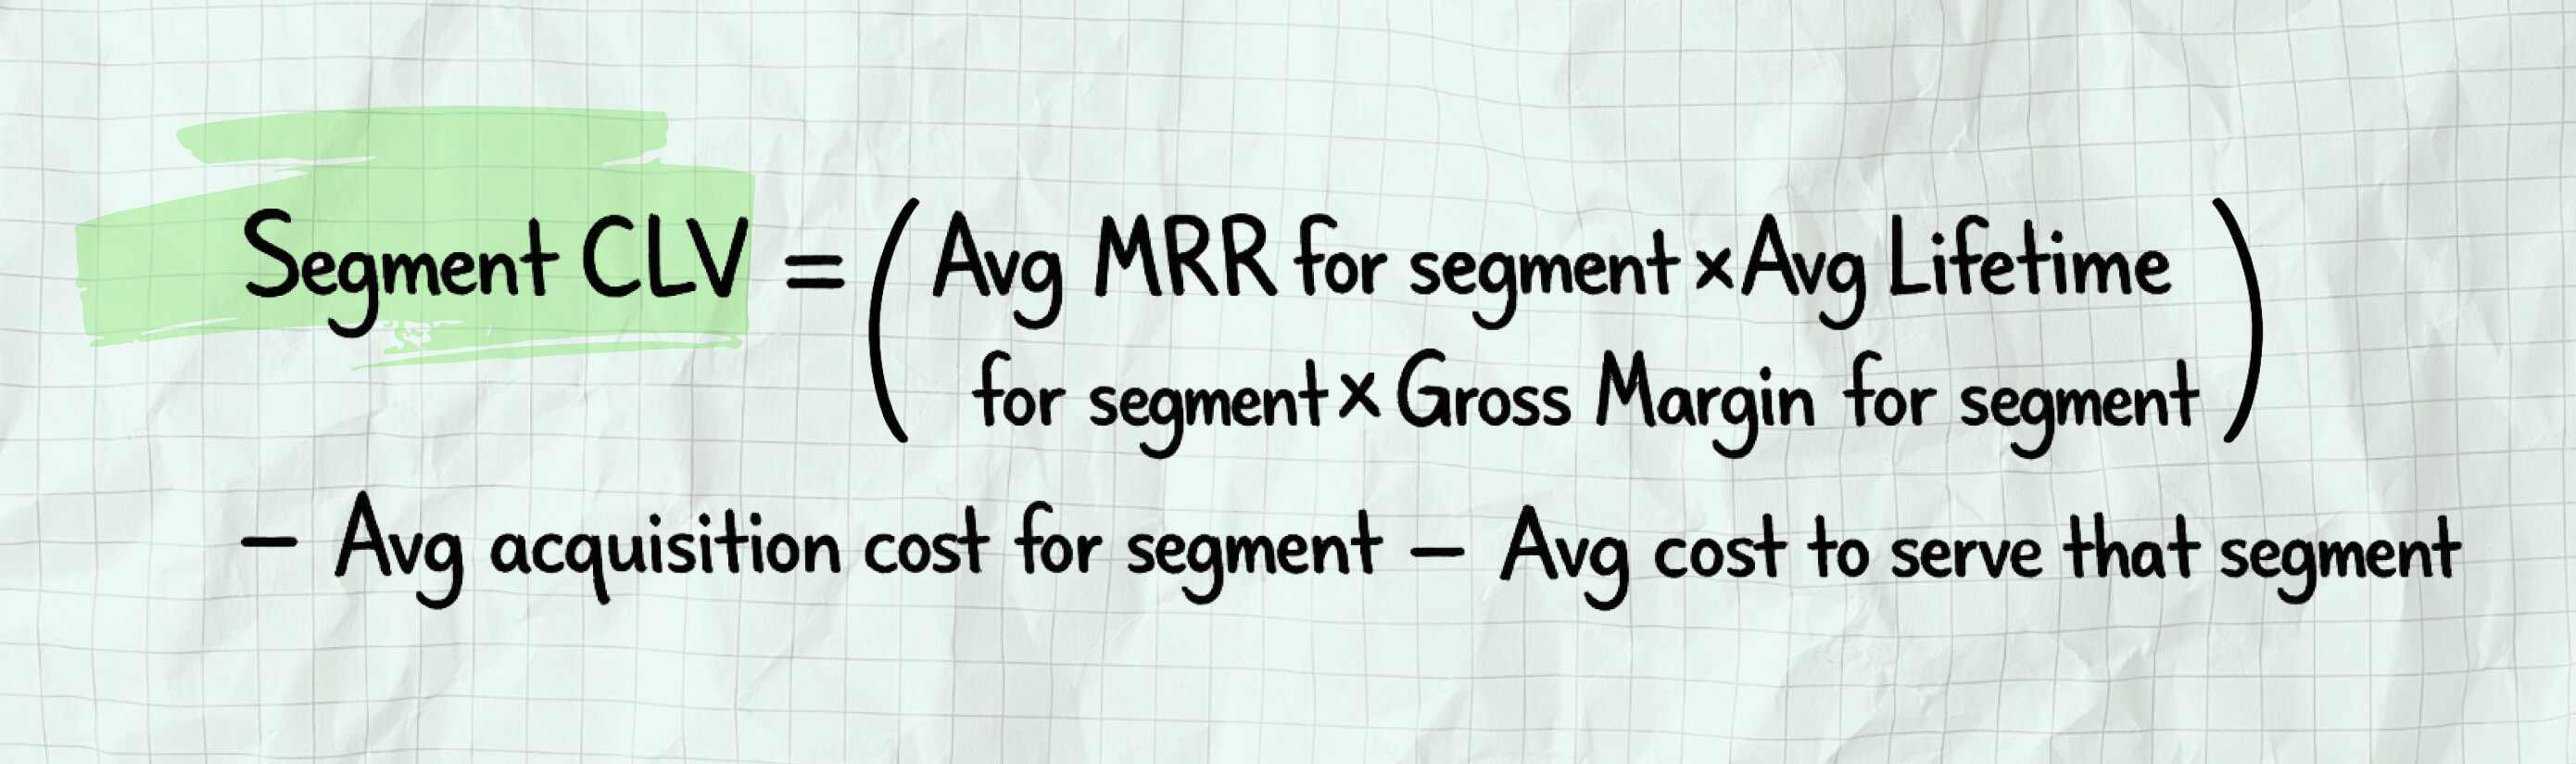
A Simple Segment Example
Here is a comparison between two plan types.
Basic Plan Segment
Average MRR: 25 USD, Average lifetime: 14 months, Gross margin: 75 percent, Acquisition cost: 30 USD, Cost to serve: 10 USD
Segment CLV becomes
(25 multiplied by 14 multiplied by 0.75) minus 30 minus 10
which equals 222.5 USD
Pro Plan Segment
Average recurring revenue: 80 USD, Average lifetime: 24 months, Gross margin: 80 percent, Acquisition cost: 50 USD, Cost to serve: 20 USD
Segment CLV becomes
(80 multiplied by 24 multiplied by 0.80) minus 50 minus 20
which equals 1,466 USD
In this example, Pro Plan customers deliver significantly higher long term value.
Insights You Can Gain from Segment Level CLV
Segment based CLV helps you identify important patterns such as:
- Which subscription plans deliver the highest long term value
- Which acquisition channels bring customers who stay longer
- Which customer groups may need improved onboarding or support
These insights help you take targeted actions that improve both CLV and overall business performance.
Calculating CLV for Individual Customers
Individual CLV helps you understand the long term value of each customer separately. This level of detail helps customer success teams, account managers, and subscription growth teams understand which customers need proactive support, which customers have upgrade potential, and which accounts require attention before they churn.
Unlike organization level or segment level CLV, this model focuses on one customer at a time and considers their actual subscription history, product usage, billing pattern, and engagement level.
Calculating Individual Customer CLV
Individual CLV combines three parts:
- Revenue you have already earned from the customer
- Revenue you expect to earn in the future
- The total cost of acquiring and serving the customer
The formula becomes:
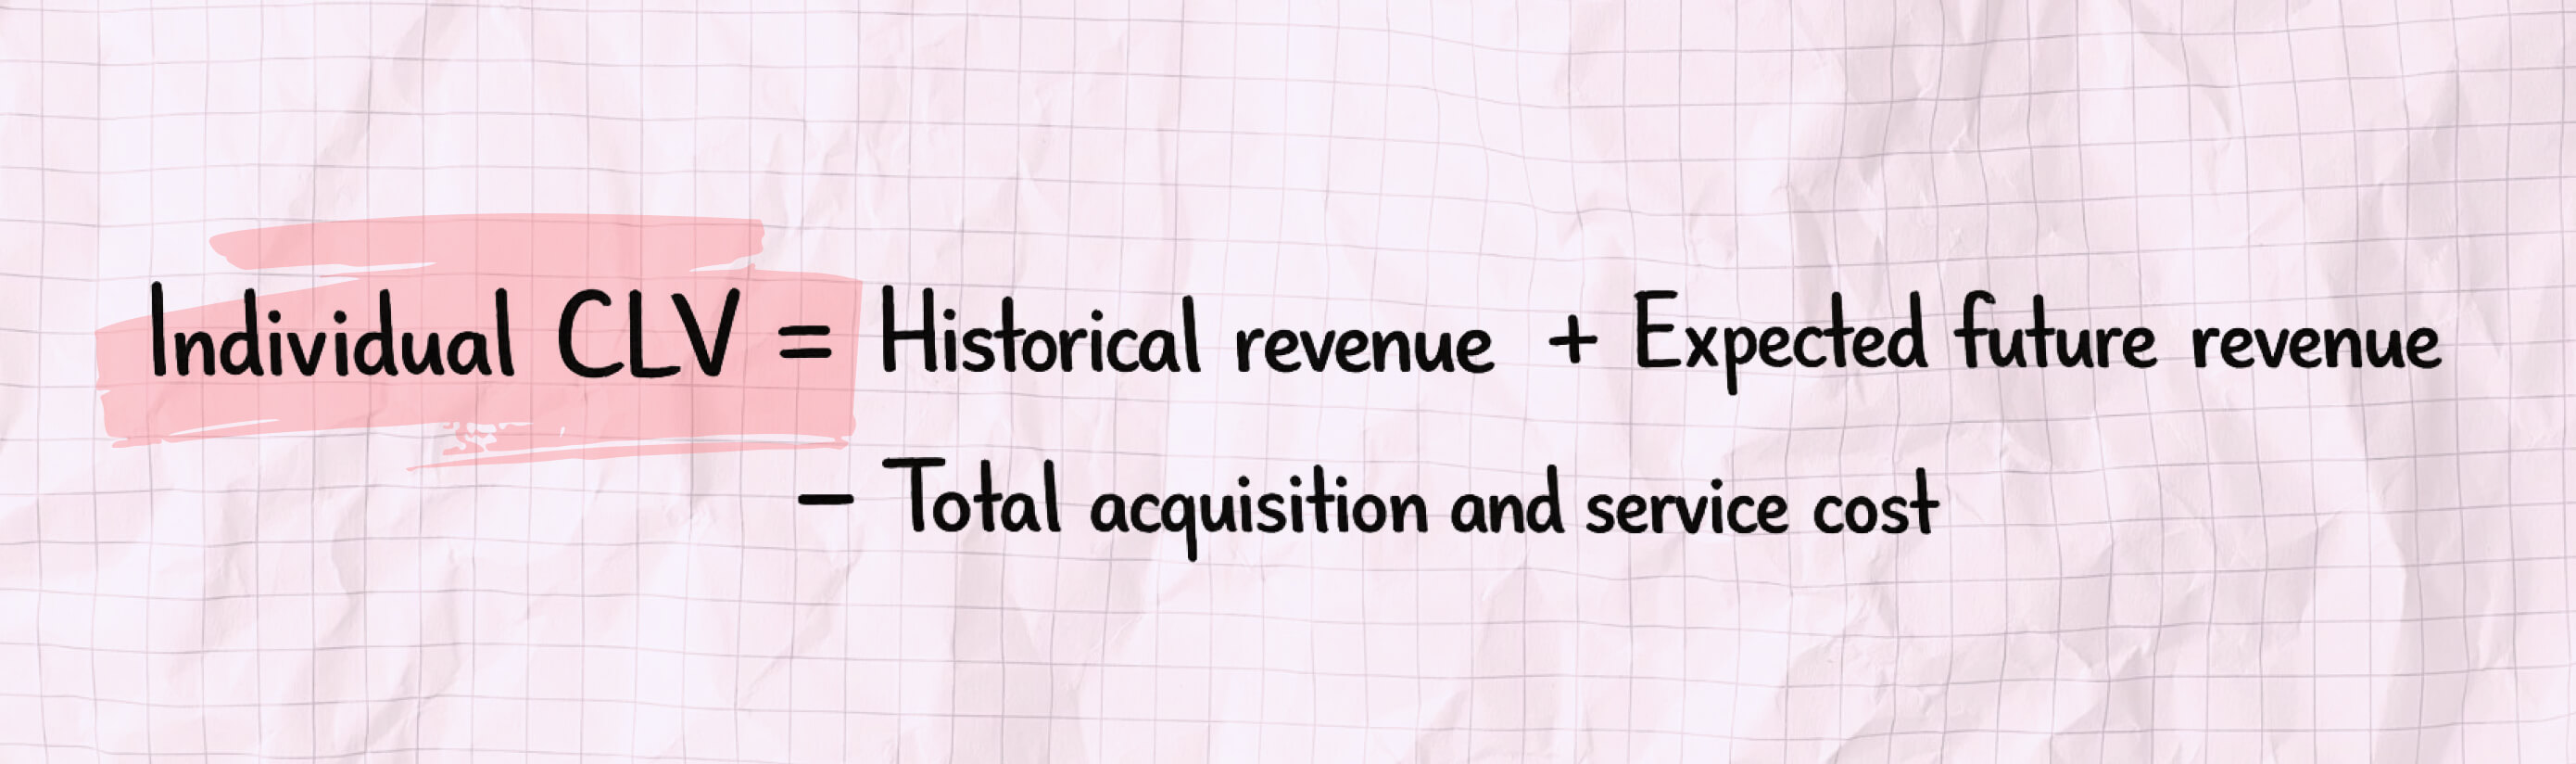
Each business can adjust these components based on the data they have available.
Individual CLV uses a different structure because it reflects what a specific customer has already paid and what they are likely to pay going forward.
Expected future revenue represents only the portion of the subscription that has not yet been billed. If the customer paid upfront for their full term, that amount is part of historical revenue and no future revenue is added.
Example:
Here is an example of a single subscriber.
Customer: Zylker Limited, Historical Revenue: 2,160 USD, Current MRR: 120 USD, Expected remaining lifetime: 12 months, Acquisition and service cost: 300 USD
Individual CLV becomes: 2,160 plus (120 multiplied by 12) minus 300
which equals 3,300 USD
This number reflects the total value Zylker Limited brings across their entire lifecycle.
If you want a profitability view, you can apply your gross margin percentage to the historical and expected revenue before subtracting the cost.
Insights You Can Gain from Individual CLV
Individual CLV helps you take targeted actions for specific customers. It helps you identify:
- High value customers who need early renewal attention
- Customers who may be suitable for upgrades or add ons
- Accounts that require improved onboarding or training
- Long term customers who are ideal for case studies or advocacy programs
Report and Dashboard Creation for CLV
The hard work of calculating CLV is done. Now comes the reward.
With CLV data in Zoho Analytics, you’re not just looking at numbers; you’re gaining a clear view of your business’s future.
Turning CLV Insights into Action with Zoho Analytics
Data is only valuable when it leads to action. Zoho Analytics bridges that gap by combining powerful data processing with intuitive, human-friendly visualizations.
Key widgets in this dashboard help you track value at a glance
- Average CLV – Shows the long-term value of an average customer, acting as a core health indicator.
- Total MRR – Confirms the strength and consistency of recurring revenue.
- Average Customer Lifetime (Months) – Highlights how long customers stay engaged with your product.
- Total Expected Future Revenue – Reveals the revenue still at stake from active customers.
- Current MRR with month comparison – Surfaces momentum or early warning signs in revenue trends.
Reports that help you move from visibility to insight
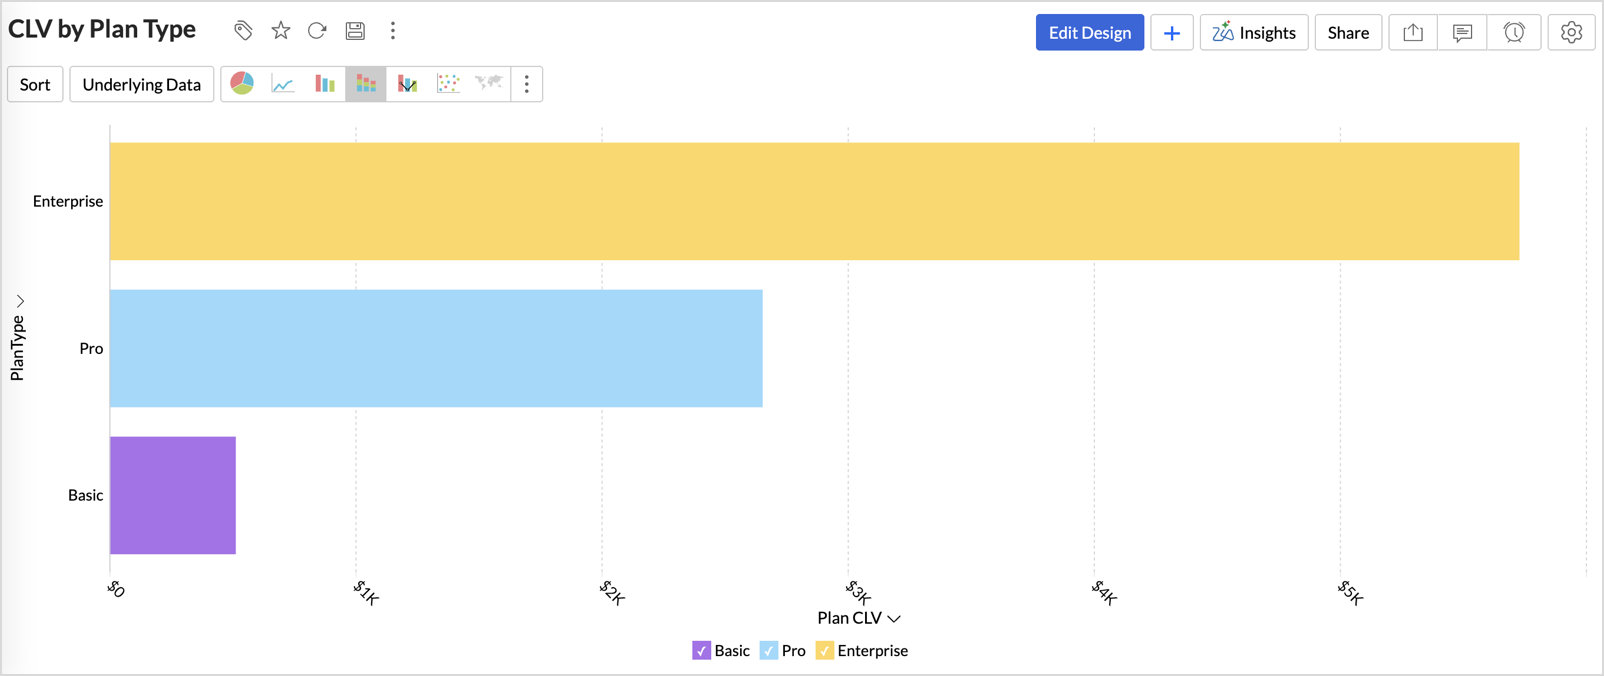
- CLV by Plan Type – This view compares lifetime value across different subscription plans. By grouping customers by plan, it reveals which offerings drive sustainable value and which plans may need pricing, packaging, or onboarding improvements.
- CLV to CAC Efficiency Ratio – This report compares the lifetime value generated by customers against the cost of acquiring them, helping you quickly identify which relationships are truly profitable.
By using clustering to group customers by plan type and applying threshold lines to define efficiency cutoffs, the chart naturally forms clear quadrants.
This approach helps teams instantly distinguish scalable, high-efficiency customers from those that require spend optimization, turning acquisition and growth decisions into data-backed actions.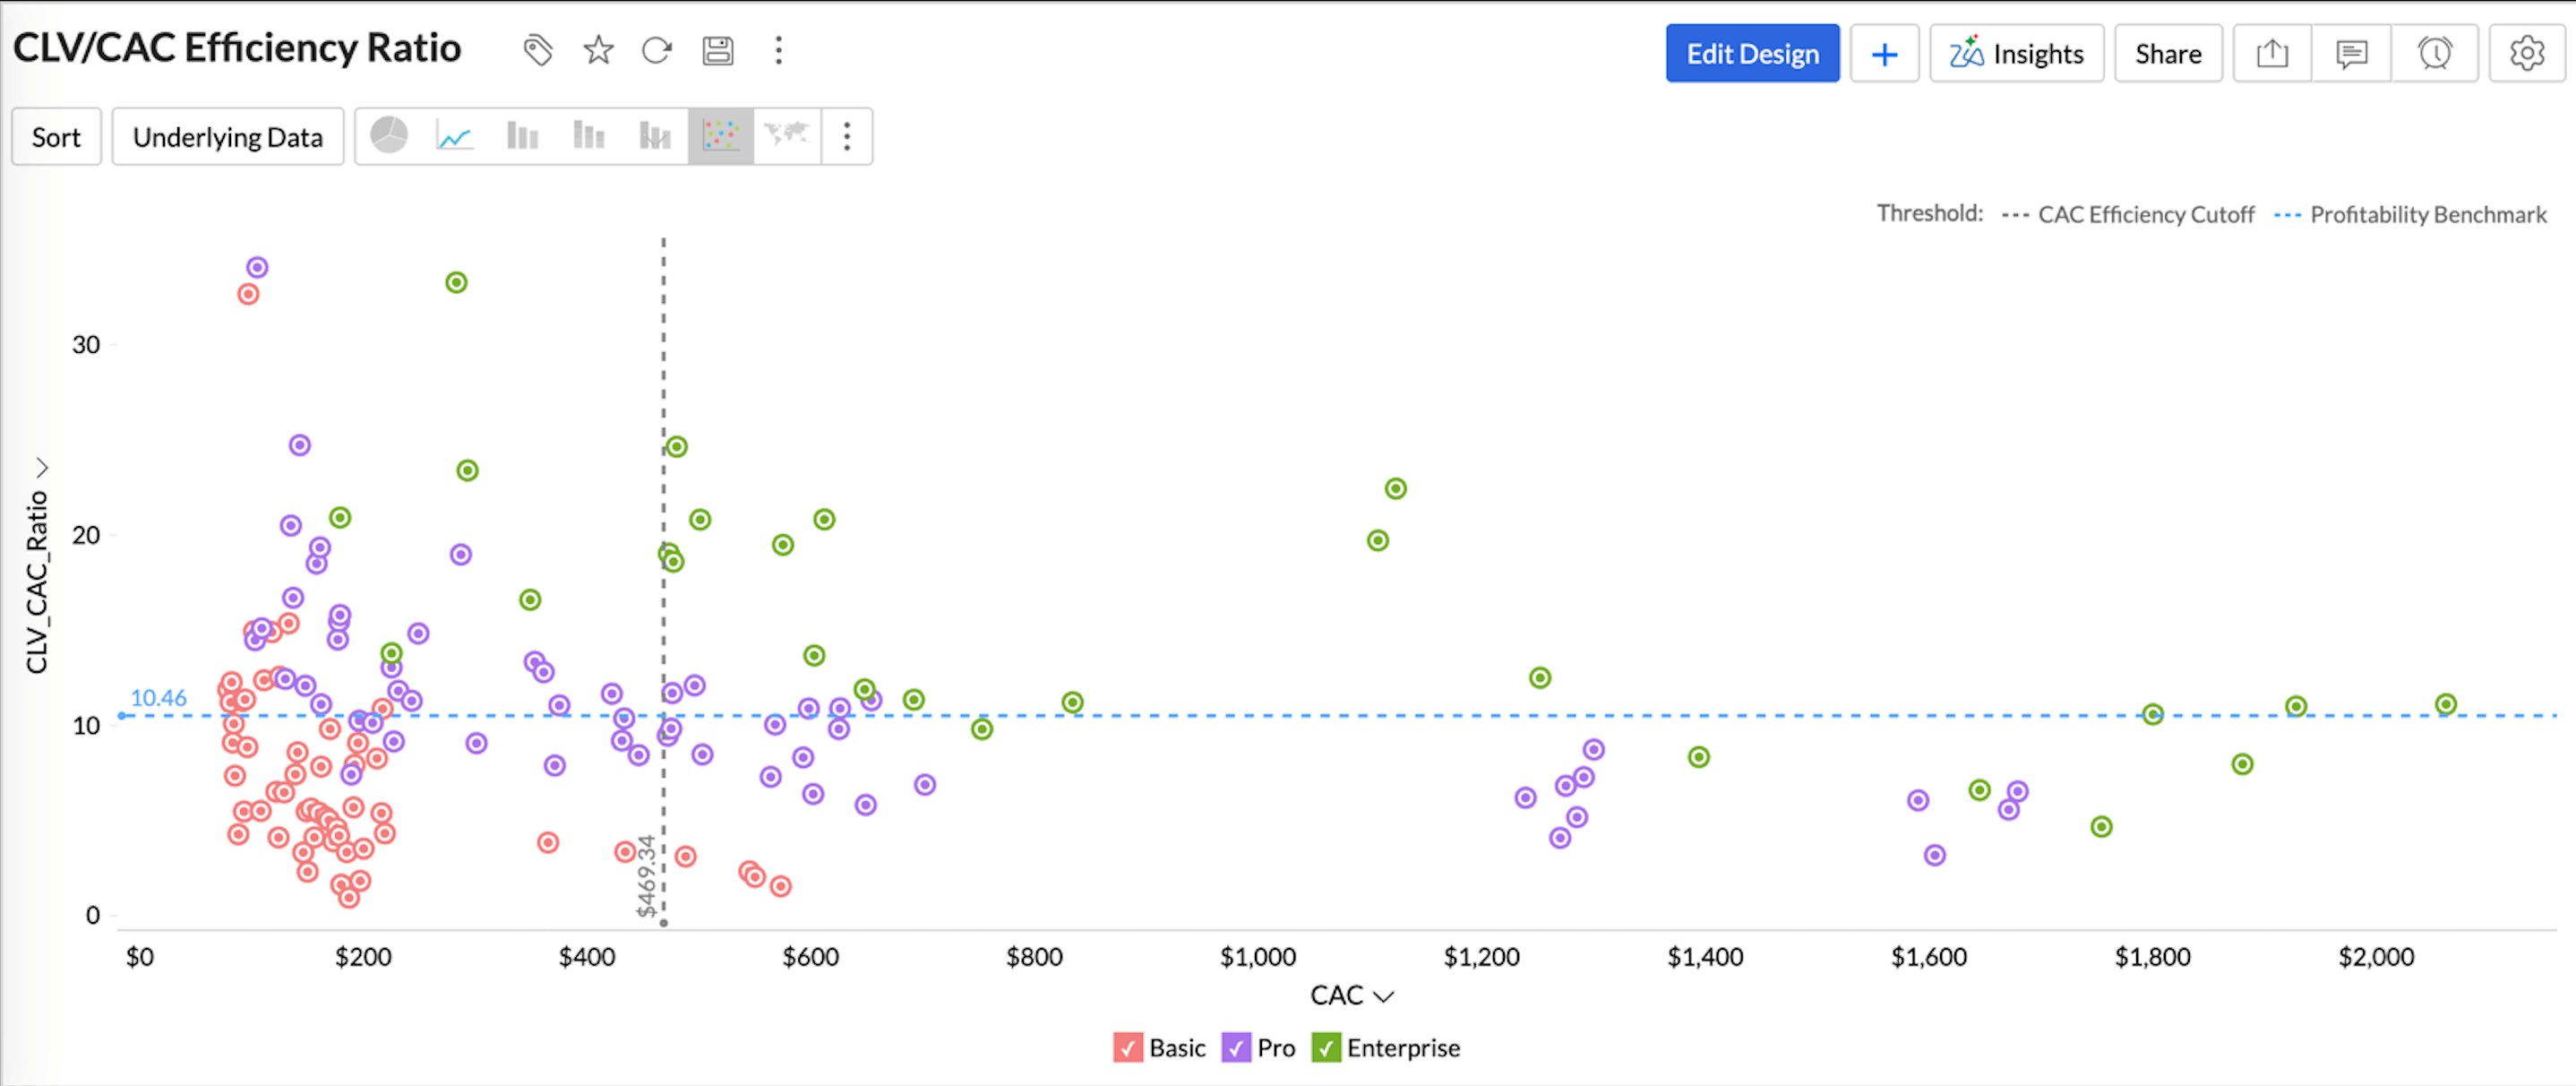
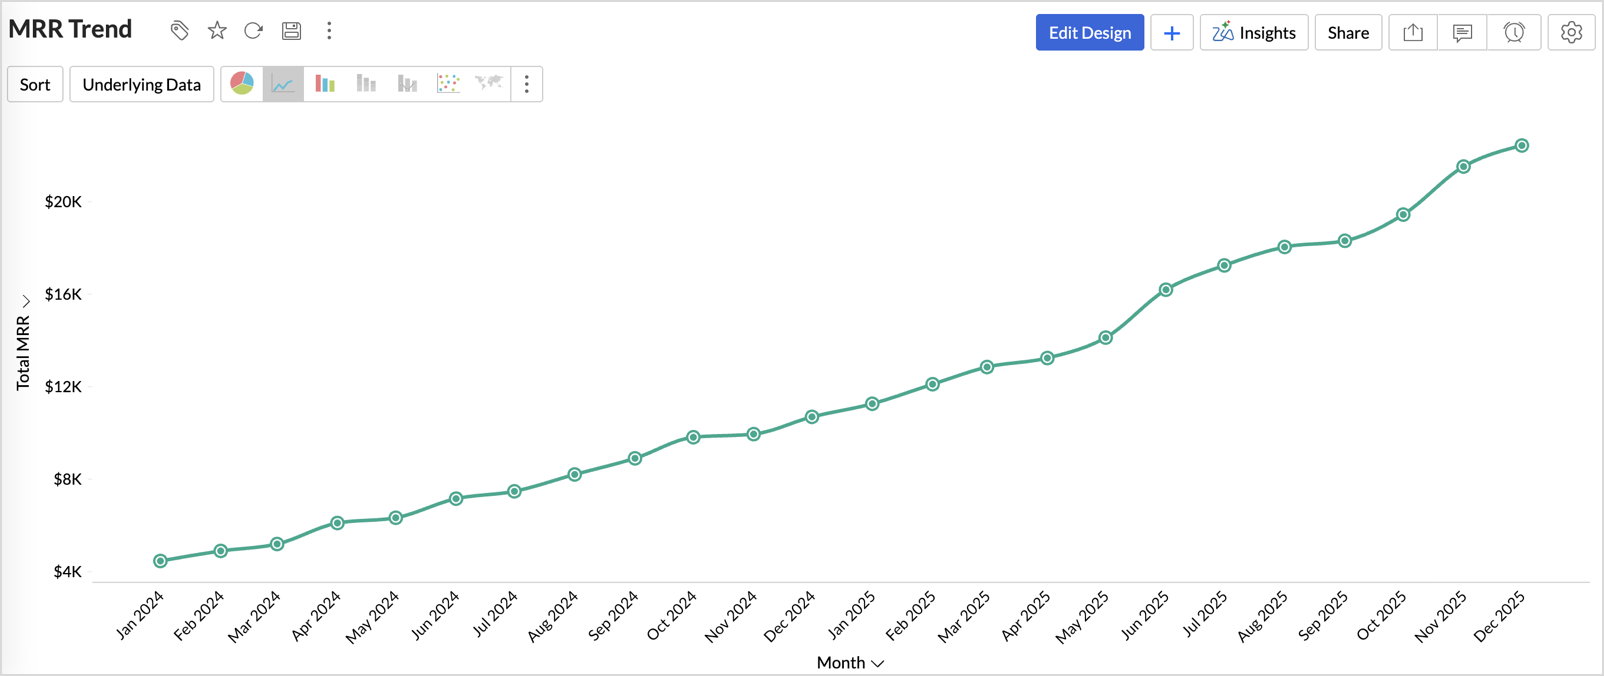
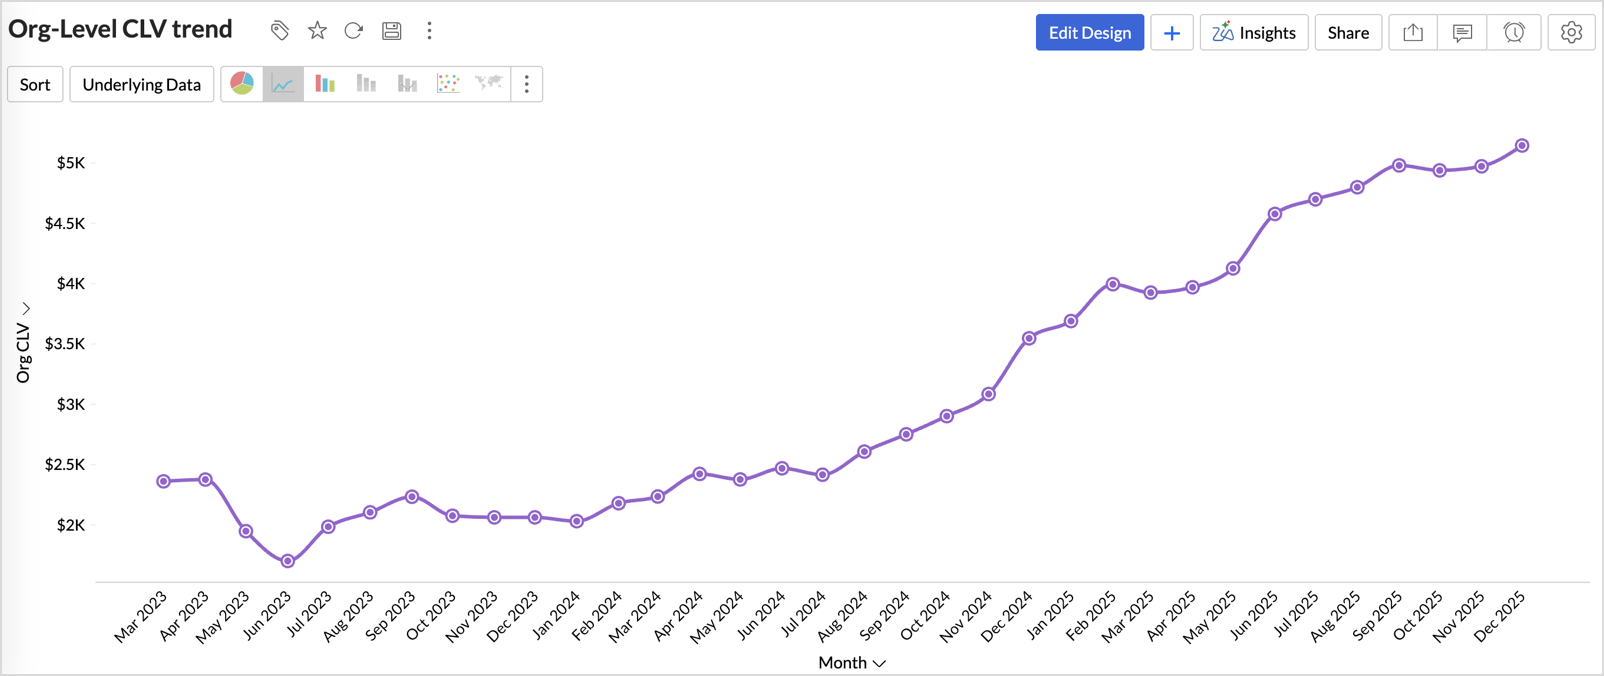
- MRR Trend and Org-Level CLV Trend – The MRR Trend tracks how recurring revenue changes over time. When viewed alongside CLV metrics, it helps teams understand whether revenue growth is supported by strong customer value or driven by short-term gains.
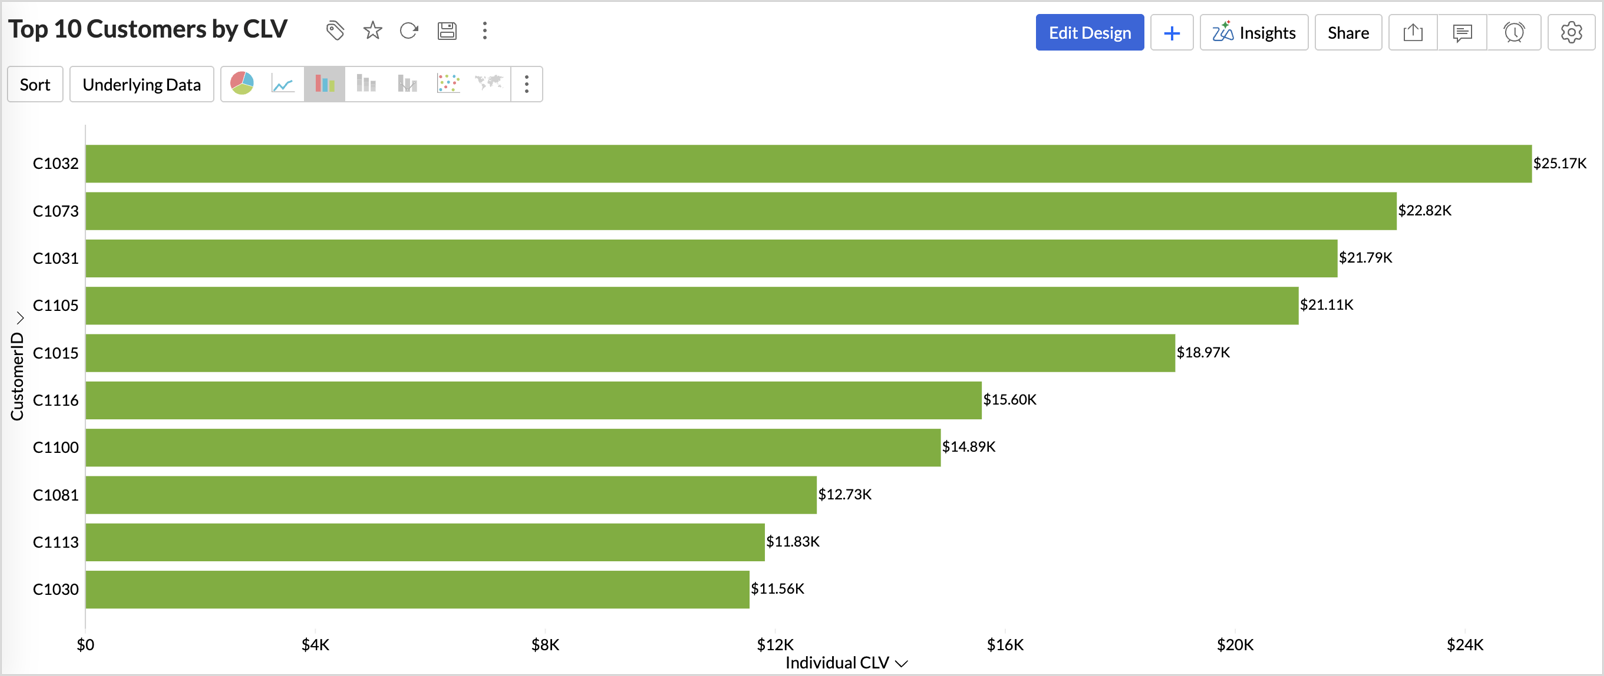
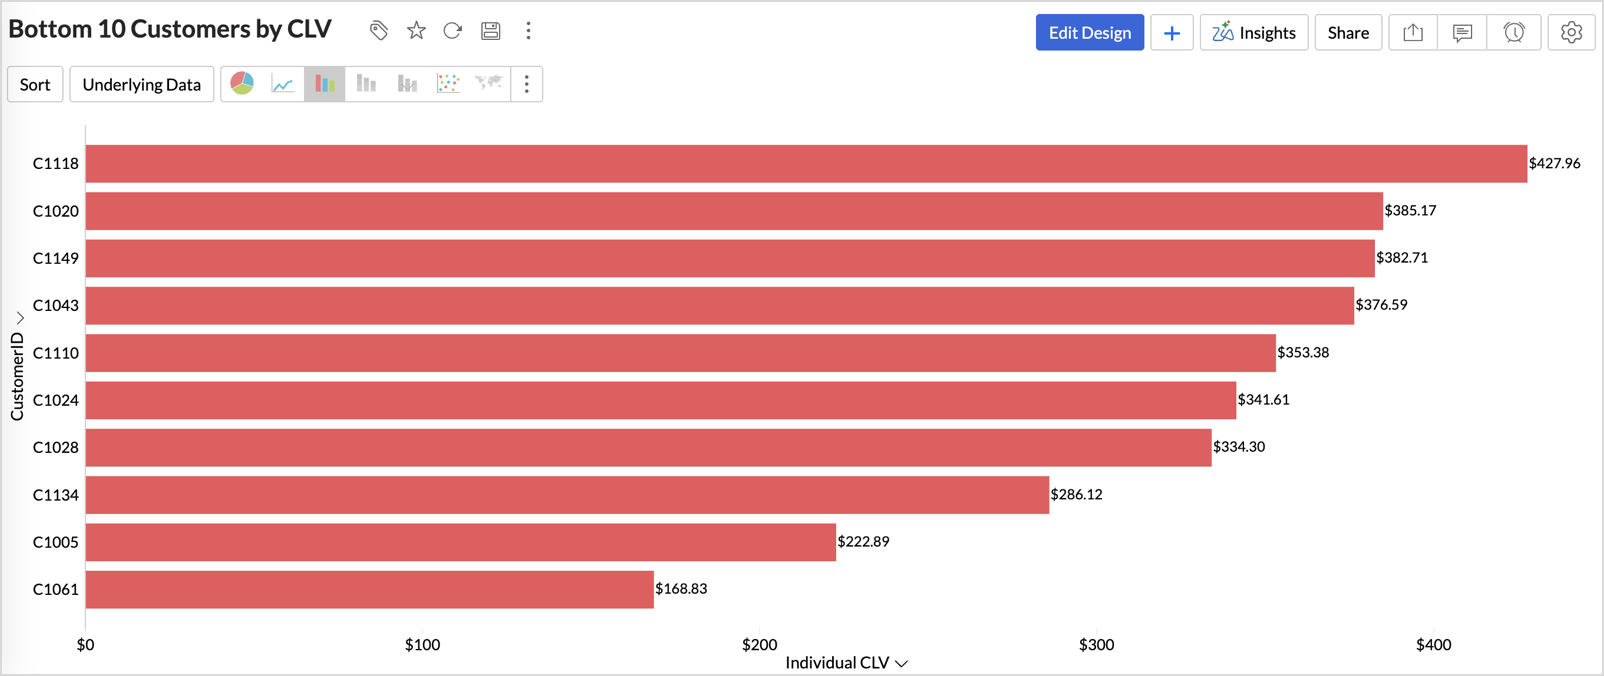
- Top and Bottom Customers by CLV – This report highlights customers who contribute the most and the least to long-term value. By ranking customers using CLV, teams can clearly see who to retain, expand, or intervene early, making customer success efforts more targeted and effective.
In Zoho Analytics, the dashboard is not a static snapshot. It’s a live environment. See a dip in your MRR Trend? drill into the cause in seconds, and share insights instantly to keep every team aligned.
With the CLV Overview, you aren't just managing data. You're mastering growth. It becomes a single command center to help you reduce churn, scale your best segments, and lead your business with confidence.
With Zoho Analytics, Customer Lifetime Value stops being a metric and becomes a growth engine, empowering you to act faster, retain smarter, and scale with confidence.
To explore how Zoho Analytics can work for your business, start your 15-day free trial or book a personalized demo.
15-day free trial. No credit card required.