Working with Dashboard
Zoho Analytics offers a wide range of interactive options for dashboards when accessed by an end-user. These options include Viewing Underlying data, sorting, exporting, sharing and publishing. In this section, we will discuss each of these options in detail.
Dashboard interactions
Dashboards allows you to perform exploratory analysis using the following interactive features.
View underlying data
Users of a dashboard can view the underlying data of a report in the dashboard. To view a chart's underlying data,
Navigate to the report, click the required data point and select View Underlying Data.

The underlying data of the data point will be displayed as shown below.

Alternatively, you can also view the entire underlying data of the report by clicking the More option and selecting View Underlying Data.

Drill Down
The Drill Down option allows you to perform powerful exploratory analysis. Using this feature, you can click on any data point in a chart and visualize the underlying data as a chart. You can either drill down using the path that is already set for the chart or choose from the list of compatible columns suggested by Zoho Analytics. Click to learn more about the drill down option.
To drill down a chart,
- Click the data point that you wish to drill-down.

The following options will be displayed:
Drill Down: This option allows you to drill down the chart based on the drill down path configured during report creation.
Drill Down By: This option allows you to dynamically select any column to drill down on the chart.
In this example, we are going to see how to drill down a chart using the Drill Down By option.
Select the column by which you wish to drill down.

On selecting the required option, the chart will be drilled down and the drill down path will be listed as a breadcrumb at the top of the report.

Note
It will be available only if the user who has shared the dashboard with you has granted the Drill down permission for you while sharing the dashboard.
Change Chart Type
Zoho Analytics allows you to change the chart type of individual charts in a dashboard using the Change Chart Type option at the top right corner of each report.

Note: This change will only be reflected for the current session, and cannot be saved. To permanently change the chart type of a report, use the Open in new tab option to open the report, and modify it as needed.
Maximize embedded reports
You can maximize the embedded report to view in full dashboard layout by following the below steps.
Click the Maximize icon in the top left corner of the report, or double-click the report header.
The report will open in full dashboard layout and displayed along with the user filters. In this mode, clicking the Edit icon at the top right corner of the report will open the report editor in a new tab.
To minimize the report, you can either double-click the report header again, or click the Minimize icon.

Exporting and Emailing Dashboards
Zoho Analytics offers exporting and emailing capabilities which enables you to view the dashboard when you work offline and share them securely with users who do not have a Zoho account.
Exporting Dashboard
Zoho Analytics allows you to export your Dashboard as a HTML zip file or as a PDF.
Export as HTML
Follow the steps given below to export a dashboard as HTML.
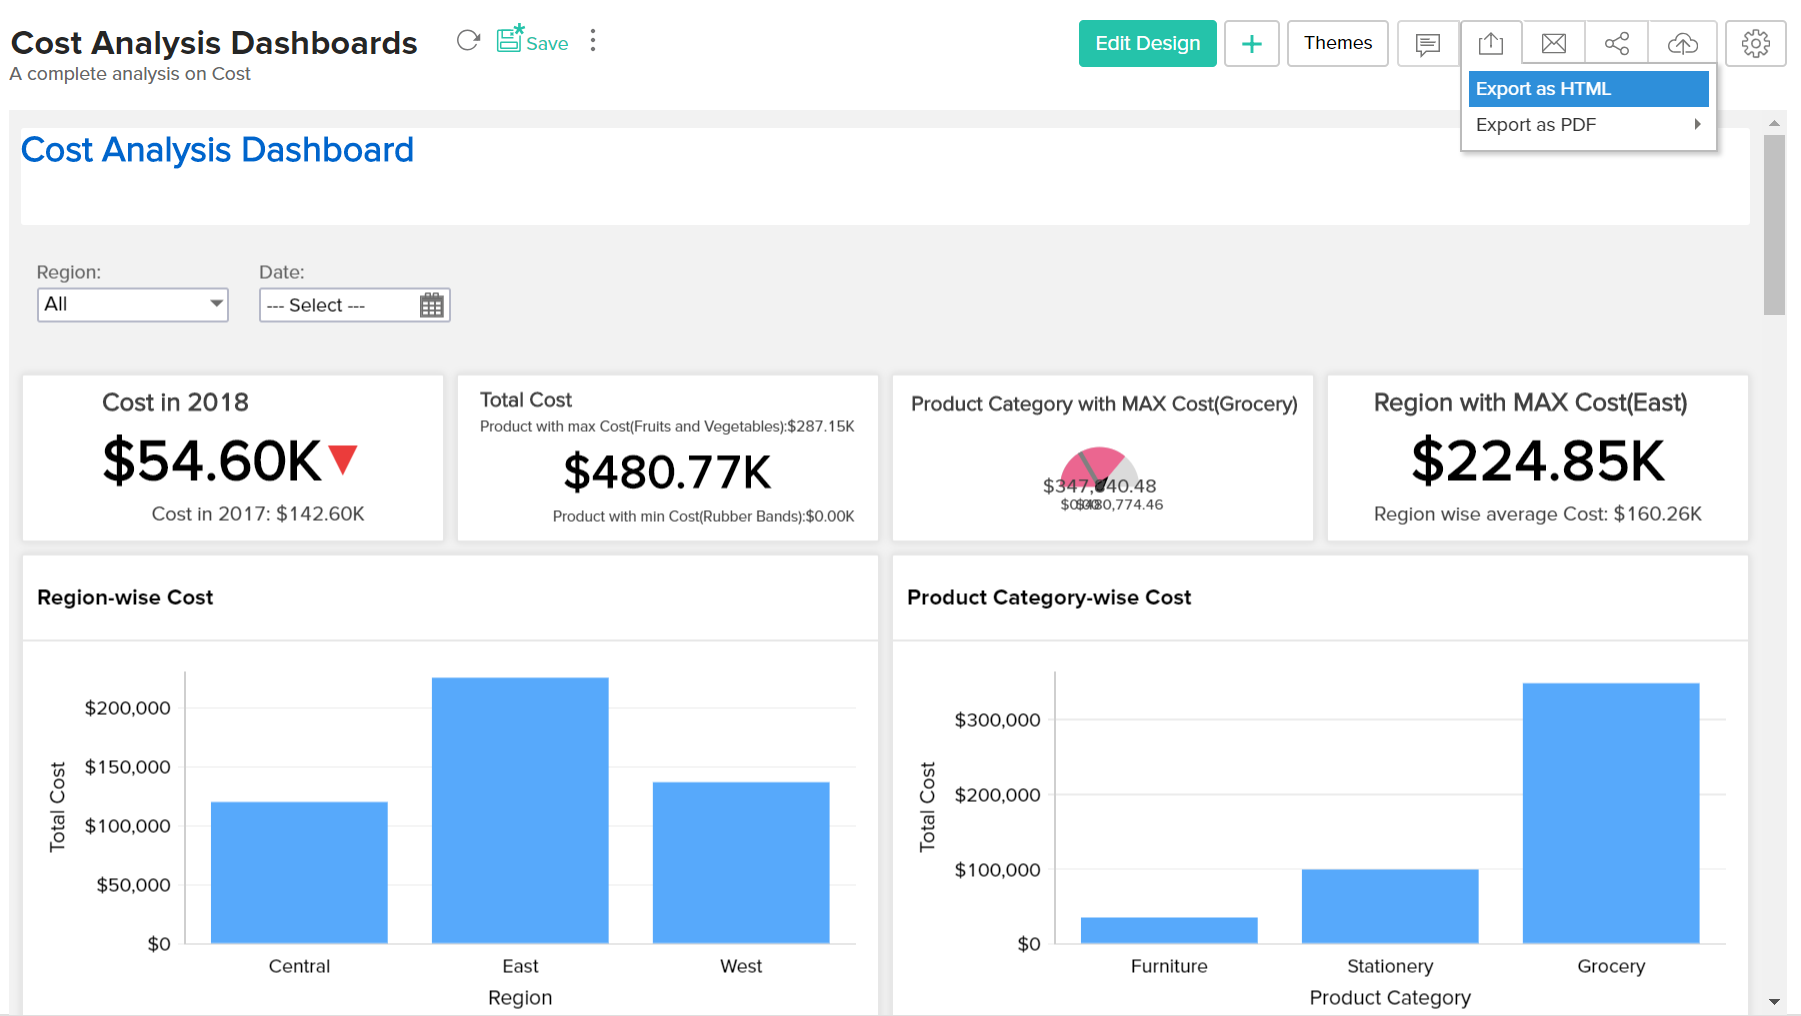
- Click Export icon and then select Export as HTML.

- The ExportAs HTML : Settings page will open.

- Specify a name for the exported HTML file in the File Name field.
- Select required options to display title and description. The possible options to customize the layout of title and description are: At Top, At Bottom and None (without title or description correspondingly).
- Select Show User Filter Criteria option to add a label for user filter applied.
- Click Export. Your dashboard will be exported into a HTML file.


Export as PDF
Zoho Analytics allows you to export the dashboard as PDF in two different layouts.
This option will export the dashboard in the same layout as arranged in dashboard.
Note
- This PDF export option is optimized for Dashboards containing charts and KPI widgets. Export may fail if it contains table styled reports, especially with huge data.
Follow the given steps to export with Layout as in Dashboard.
- Click Export icon and then select Export as PDF > Layout as in Dashboad.

- This opens the Export as PDF : Settings page as shown below.

Format and Options tab
This tab provides options to format the exported PDF.

- Specify the files name in the File Name field.
- Set the paper size on the Paper Size option, in the Paper section.
- Set the orientation as Portrait or Landscape.
- In the Zoom Factor in %, specify a value in percentage to scale the font size in your dashboards to fit to the page size appropriately. This could be scaled between 1 to 100%.
- Select required options to display title and description. The possible options to customize the layout of title and description are: At Top, At Bottom and None (without title or description correspondingly).
- Specify the column width radio for the table styles reports (pivot, summary, table etc.,) in your dashboard. Available options are:
- Equal width for all columns - Choose this to have equal width for all columns.
- Proportionate width as in the report - Choose this to set proportional column width based on the design of the original report.
- Select Show User Filter Criteria option to add a label for user filter applied.
Page Layout tab
This tab provides the page layout option.

- Specify the Margin (in Inches). Margin value should be between 0.0 to 1.0.
- Click Export. Your dashboard will be exported into a PDF file with the layout as in dashboard.
This layout will export the dashboard in a single column layout displaying each report in a new page in the PDF.
This type provides the following benefits.
- Supports exporting dashboard containing tabular views with large data.
- Supports adding a Table of Content.
- Supports adding Header and Footer in each page.
- Supports customizing the language.
- Supports more file size for the exported PDF.
- Supports displaying filter criteria applied in the dashboard level and in the reports level.
Follow the given steps to export the dashboard with each report in a new page.
- Click Export icon and then select Export as PDF >Each Report in a New Page.

- This opens the Export as PDF : Settings page as shown below.

The Format and Options tab
This tab provides formating option for the exported PDF.

- Specify the files name on the File Name field.
- Select the Language.
- Set the paper size on the Paper Size option, in the Paper section.
- Set the Orientation as Portrait or Landscape.
- Select required options to display title and description. The possible options to customize the layout of title and description are: At Top, At Bottom and None (without title or description correspondingly).
- Select Show User Filter Criteria option to add a label for user filter applied.
- Select Generate TOC checkbox to include a table of content of your dashboard in the exported PDF file.
- Specify how to add KPI widgets in exported file in Include Widgets. Available options are.
- None - Select this to exclude widget from the exported copy.
- Each in a New Page - Display each widget in a new page.
- Associate to Nearest Report - Display widget along with the nearest page.
The Page Layout tab
This tab provides the page layout option.

- Specify the Margin (in Inches). Margin value should be between 0.0 to 1.0
- You can choose to add Header and Footer for this layout. There are three position (Left, Right or Center) and you can choose to display one of the following in these position.
- Blank - Displays nothing in this position
- Title - Displays the title of the file
- Date Time - Displays the date and time of export
- Page # - Displays the page number
- Page # of # - Displays the page number out of total pages
- Custom Text - Displays the custom text that is entered in the near by field
- Logo - Displays the logo
- Click Export. Your dashboard will be exported into a PDF file with each report in a new page.
Export a Report
Apart from exporting the dashboard as a whole, Zoho Analytics also provides an option to export the individual reports in the dashboard.
To export a report,
- In the View Mode, select the More icon that appears on mouse over
- Select Export and choose the file type that you wish to export the report as.

Emailing Dashboard
Zoho Analytics allows you to e-mail your dashboard to your colleague and clients. You can also schedule emailing your dashboards.
To e-mail your dashboard follow the given steps.
- Click the E-mail icon and select one of the following option.
- Email as HTML - Email the dashboard in HTML file format.
- Email as PDF - Email the dashboard in Portable Document Format (PDF) file format.

- E-mail tab provides various options to specify users email addresses and to customize your message.

- Specify the email addresses in the Enter E-Mail Addresses text box. You can enter the email addresses by typing them or by selecting from Zoho Contacts/Shared User list.
- Customize your e-mail subject and message using the Subject box and the Message box respectively.
- Specify whether the dashboard should be mailed As an in-line Message or As Attachment in the Mode. This option is available only for emailing as HTML file.
- You can also schedule to send exported copy at a recurring date and time using the Schedule this Email options.
- Click Send to send the report to the specified users.


Other setting will be similar to that on Exporting option. For details refer to the corresponding section in the Exporting Dashboard document.
Sharing your Dashboard
Zoho Analytics allows you to share your Dashboards to your Users and set permissions like Read, View Underlying Data, Drill Down, Export and Share such that the shared users would be allowed to do only permitted actions when they access the shared dashboard.
Refer to the topic Sharing and Collaboration to know how to share your dashboard.
Publish your Dashboard
Zoho Analytics also allows you to embed your dashboards, you create in to a website, web application, blog or an intranet page.
Refer to the topic Publishing Options to know how to publish your dashboard.