Zoho Analytics - Dashboards for Android
The Zoho Analytics - Dashboards app is an immersive purpose-built app to access, explore and get insights on the go from your dashboards created in Zoho Analytics. Enjoy analytics like never before with an intuitive and immersive visual experience.
You can install this app for free. The app is supported for Android versions 7.0 and above.

In this section, we will discuss:
- Prerequisites
- Supported Android versions
- Installing and Signing Into Zoho Analytics - Dashboards App
- Zoho Analytics - Dashboards App Overview
- Options to Organize
- Working with the App
- Notifications
Prerequisites
Internet connectivity (cellular or Wi-Fi connection)
Supported Android versions
Devices with Android versions 7.0 and above
Installing and Signing Into Zoho Analytics - Dashboards App
You can install the Zoho Analytics - Dashboards App from the App Store:
- Tap open the App Store.
- Search for Zoho Analytics - Dashboards app.
- From the search results, tap open the Zoho Analytics - Dashboards app.
- Tap Install. The application will be automatically installed.
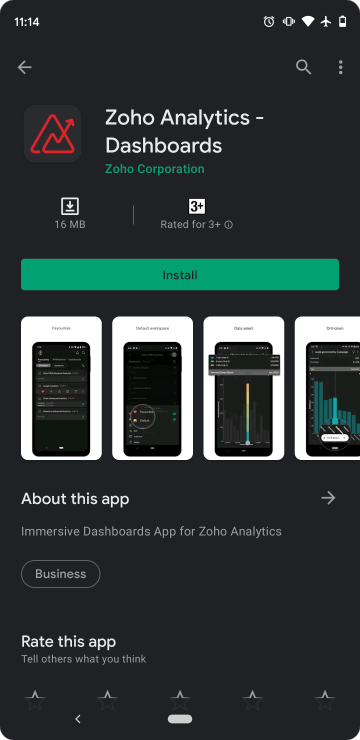
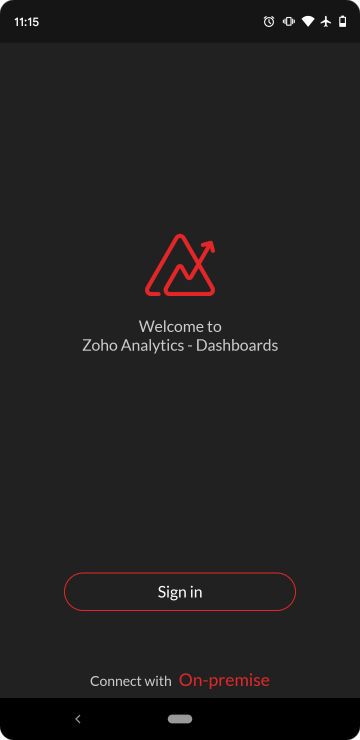
- Open the installed app.
- The Sign In screen will open. Tap the Sign in button.
- Enter the Email address or mobile number of the registered Analytics account and tap the NEXT button.
- Enter the Password and tap the SIGN IN button.
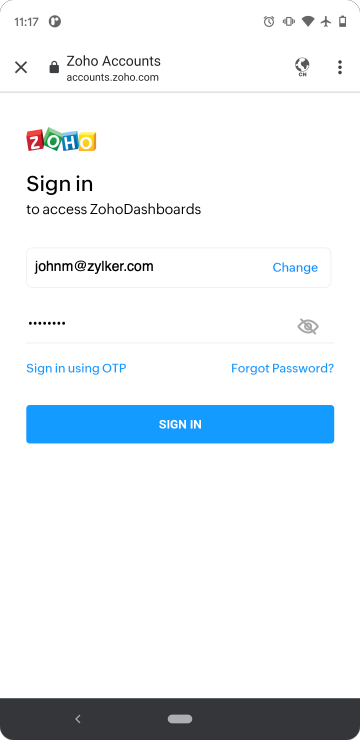
- You will be logged into Zoho Analytics from your mobile app.


Similarly, you can also sign in using your Google, Microsoft, LinkedIn, Facebook, Twitter, YAHOO!, Slack, and Apple credentials as well.
On successful authentication, your Zoho Analytics dashboards and workspace information will get synchronized to your mobile app. Click here to learn about connecting to an on-premise account.
Zoho Analytics - Dashboards App Overview
The Zoho Analytics - Dashboards App's Home screen contains three tabs - Favorites, Workspaces, and Dashboards.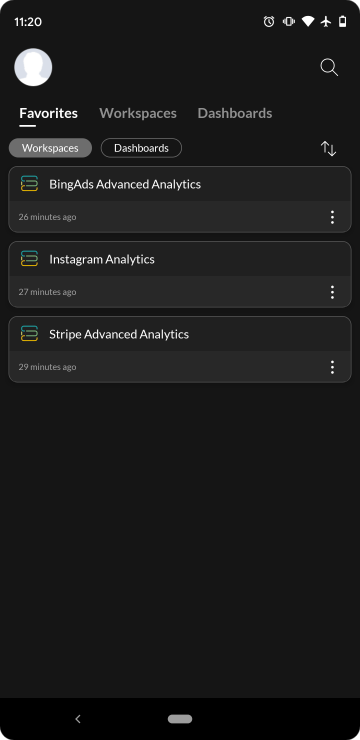
Your profile picture will be displayed on the top-left corner, along with options to Search and Sort your analytical elements on the right side of the view.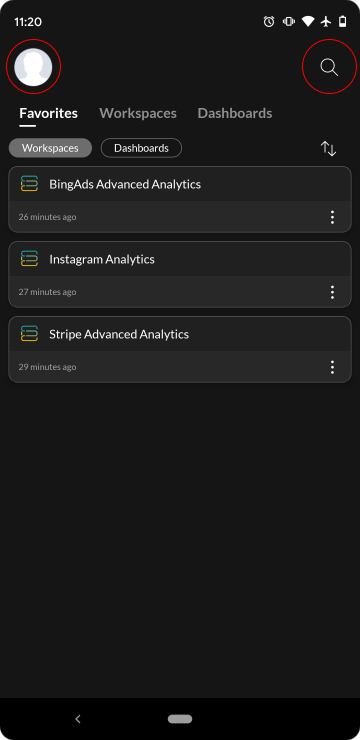
Favorites Tab
The Favorites tab lists the Workspaces and Dashboards that you have marked as favorite.
Workspaces Tab
The Workspaces tab lists all the available Workspaces - both Owned and Shared in your Zoho Analytics account
By default, both the Owned and Shared workspaces will be listed. You can choose to list only owned, only shared, or all the workspaces by deselecting/selecting the respective option at the top. Selecting any workspace will open the workspace to list the dashboards in it.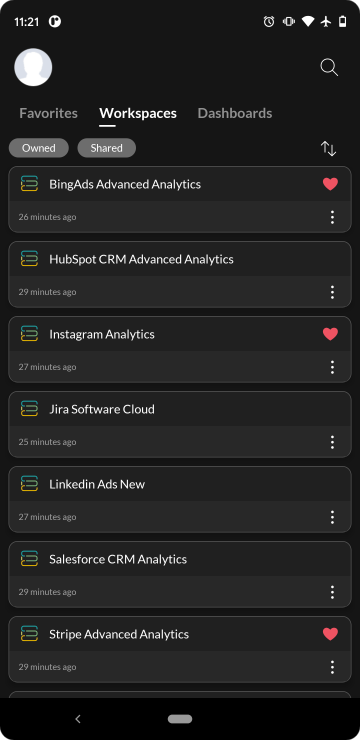
Dashboards Tab
The Dashboards tab has a similar structure to the Workspaces tab. By default, both the Owned and Shared dashboards will be displayed. You can choose to list only owned, only shared, or all the dashboards by deselecting/selecting the respective tab at the top.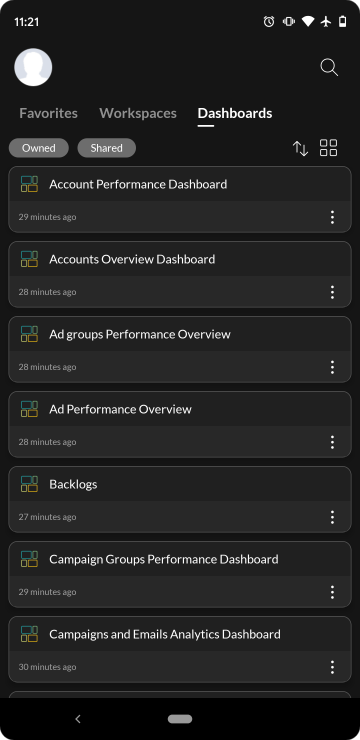
You can display your dashboards inside the Dashboards tab either as a list or as a grid using the Dashboards List/Grid View icon.
Options to Organize
You will notice a More icon inline to your Workspace and Dashboard names listed in the Workspaces and Dashboards tab.
Tapping the More icon will list the following options:
Favorite - You can favorite your most accessed workspace and dashboard by tapping the Heart icon. Once you favorite an element, it will get added to the Favorites list and make it easy for repeated access.
You can remove a view from the favorites list, anytime, by tapping the Heart icon again.
Mark as Default - The Mark As Default option is specific to workspaces. A workspace will be marked as default when you tap the Default icon corresponding to the workspace. Once you mark a workspace default, then it will be the opening screen of your Zoho Analytics - Dashboards app when you sign-in.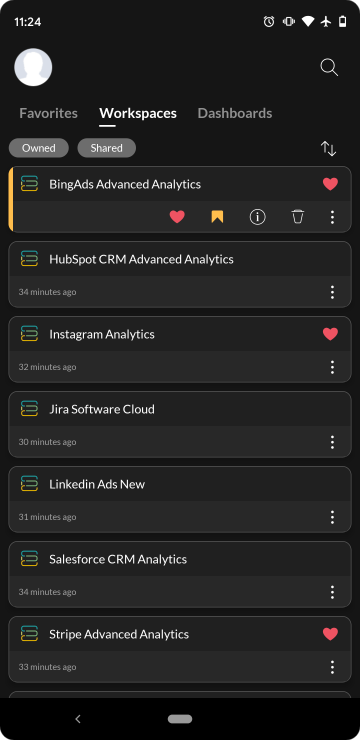
Only one workspace can be set as the default at any given time.
Information - The Information option provides details such as Created Time and Modified Time of the Owned views. For a Shared view, you will also be able to get details such as Created by, and Shared by.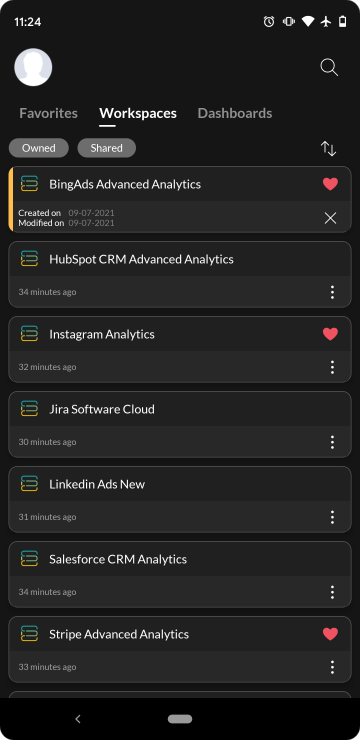
Delete - You can delete workspaces and dashboards that you own using the Delete icon.
Working with the App
In this section, we will learn about working with workspaces and dashboards from the Zoho Analytics - Dashboards app on iPhone.
Exploring Workspace
Navigate between the Favorites, Workspaces, and Dashboards tabs to access your dashboards in Zoho Analytics - Dashboards app. You can tap on any workspace to open it. The Workspace View will list all the dashboards available inside the workspace.
Interacting with Dashboards
Open any dashboard from the Favorites, Workspaces, or Dashboards tab. The opened dashboard will be rendered in a mobile-optimized format offering all the interactions available for the dashboard.
Interactions offered:
- Dynamic User Filter - Dynamically filter the reports in your dashboards using the dynamic user filters created for the dashboard. Choose the required value and tap Apply. Your dashboard will be filtered based on the applied value.
- Edit Mode - Long press any report in your dashboard to enable Edit Mode. In the edit mode, you can drag the selected report to rearrange its position. As you drag, the other components in the dashboard will be automatically arranged. You can also resize the report using the Resize Marker that looks like a semi-circle pane. Tap Done to save the modifications.
Note: Any changes made to the report's position in the dashboard are local to the mobile app and will NOT be reflected in your Zoho Analytics web account. - Expand Report - Tap on any report to maximize its view.
- Report As Filter - When you tap a data point in a report, all the other reports in the dashboard will get filtered to the selected value offering report-centric exploration.
- Report View - Tap the Open icon at the top-right corner of your report to open it in Report View. The rest of the components of the dashboard will be hidden, except the user filters. The dashboard's user filter will be available inside the Filter icon. In the Report View, you will have access to all the interactive options available for the reports. Tap the Back icon available at the top-left corner to navigate back to the dashboard.
- Back - Use the Back icon at the top-left corner of the dashboard to exit your Dashboard View.
More Options
The more option will be available at the top-right corner of the Dashboard View. It contains the following contextual options:
- Refresh - You can refresh the dashboards using the Refresh option.
- Favorites - You can favorite a workspace using the Favorites toggle bar.
- Information - The Information option provides details such as Created Time and Modified Time of an Owned dashboard. For a Shared dashboard, additionally, you can get details about Created by and Shared by.
- Delete - You can delete the workspaces which you own using the Delete icon.
Report View
You can tap on any report available in the dashboards to open it in Report View.
Charts
You can access the charts in read-only mode with the following interactive options:
- Tooltip Area - The key insights of the chart will be displayed at the top of the chart.
- Tooltips - You can view the data point-specific tooltip by tapping the corresponding data points in your chart. The corresponding tooltip at the top of the chart will be highlighted based on your selection. You can move across consecutive data points using the Previous and Next options.
- Legend - If the chart contains a legend, it will be displayed right below the Description.
- Drill Down - You can drill down on any data point by tapping it and selecting the Drill Down option available at the bottom of the chart. You can navigate across the drill-down path that has already been set for the chart or search the columns by which you wish to drill down the data. The drill-down path will be displayed in a separate dialog. Use the Undo icon at the top-left corner to undo the immediate changes. Use the Cancel option at the top-left corner to exit drill-down.
- You can also dynamically drill down the data in your charts by using the 'Swipe Up' gesture on the corresponding data point.
- Dynamic User Filters - You can dynamically filter the reports using the User Filters created for the dashboards from which you have opened the report. Tap the Filter icon inline to the chart name to view the available user filters.
- Exclude Value - You can exclude a value from the report by selecting a data point in the chart and using the 'Swipe Down' gesture. You will notice the excluded values being crossed out in the Tooltip Area. You can include the values back by tapping the crossed-out values. You can also deselect/select the value from the chart legend to exclude/include it from your chart, if applicable.
- Zoom - Long press and 'Swipe Horizontally' on a data point in the chart to zoom.
- Horizontal Scroll - Lengthy charts come with a horizontal scroll bar. You can scroll the chart right to left using the scroll bar at the bottom.
- Undo - Use the Undo icon at the top-left corner to undo the immediate changes.
- Cancel - Use the Cancel option at the top-left corner to cancel the changes and get back to the original view.
- Back - Use the Back icon at the top-left corner to exit your Report View.
The Zoho Analytics - Dashboards mobile app supports the following chart types.
Pie Chart | Half Pie Chart | Donut Chart | Half Donut Chart | Funnel Chart | Bar Chart | Horizontal Bar Chart | Grouped Bar Chart | Horizontal Grouped Bar Chart | Stacked Bar Chart | Horizontal Stacked Bar Chart | Line Chart | Area Chart | Web Chart | Scatter Chart | Bubble Chart | Packed Bubble Chart | Bubble Pie Chart I Combination Chart | Heatmap Chart | Word Cloud Chart I Geo Scatter | Geo Heatmap | Geo Filled
Pivot, Summary, and Tabular View
You can interact with your tables, pivot, summary, and tabular views, embedded in your dashboards, using the following interactive options:
- Dynamic User Filters - You can dynamically filter the reports using the User Filters created in the report. Tap the Filter icon inline to the report name to view the user filters.
- Resize - Long press a Row/Column to get the Resize Marker. The Resize Marker looks like a rectangular holder that appears on the selected Row/Column. As you resize a Row/Column, the other data series in the view will automatically adjust their position.
- Scroll - 'Swipe up and down', 'left and right' to scroll through your data.
- Back - Use the Back icon at the top-left corner to exit your Report View.
More Options
The More option will be available at the top-left corner of the Reports View. It contains the following contextual options:
- Refresh - You can refresh the dashboards using the Refresh option.
- Favorites - You can favorite a workspace using the Favorites toggle bar.
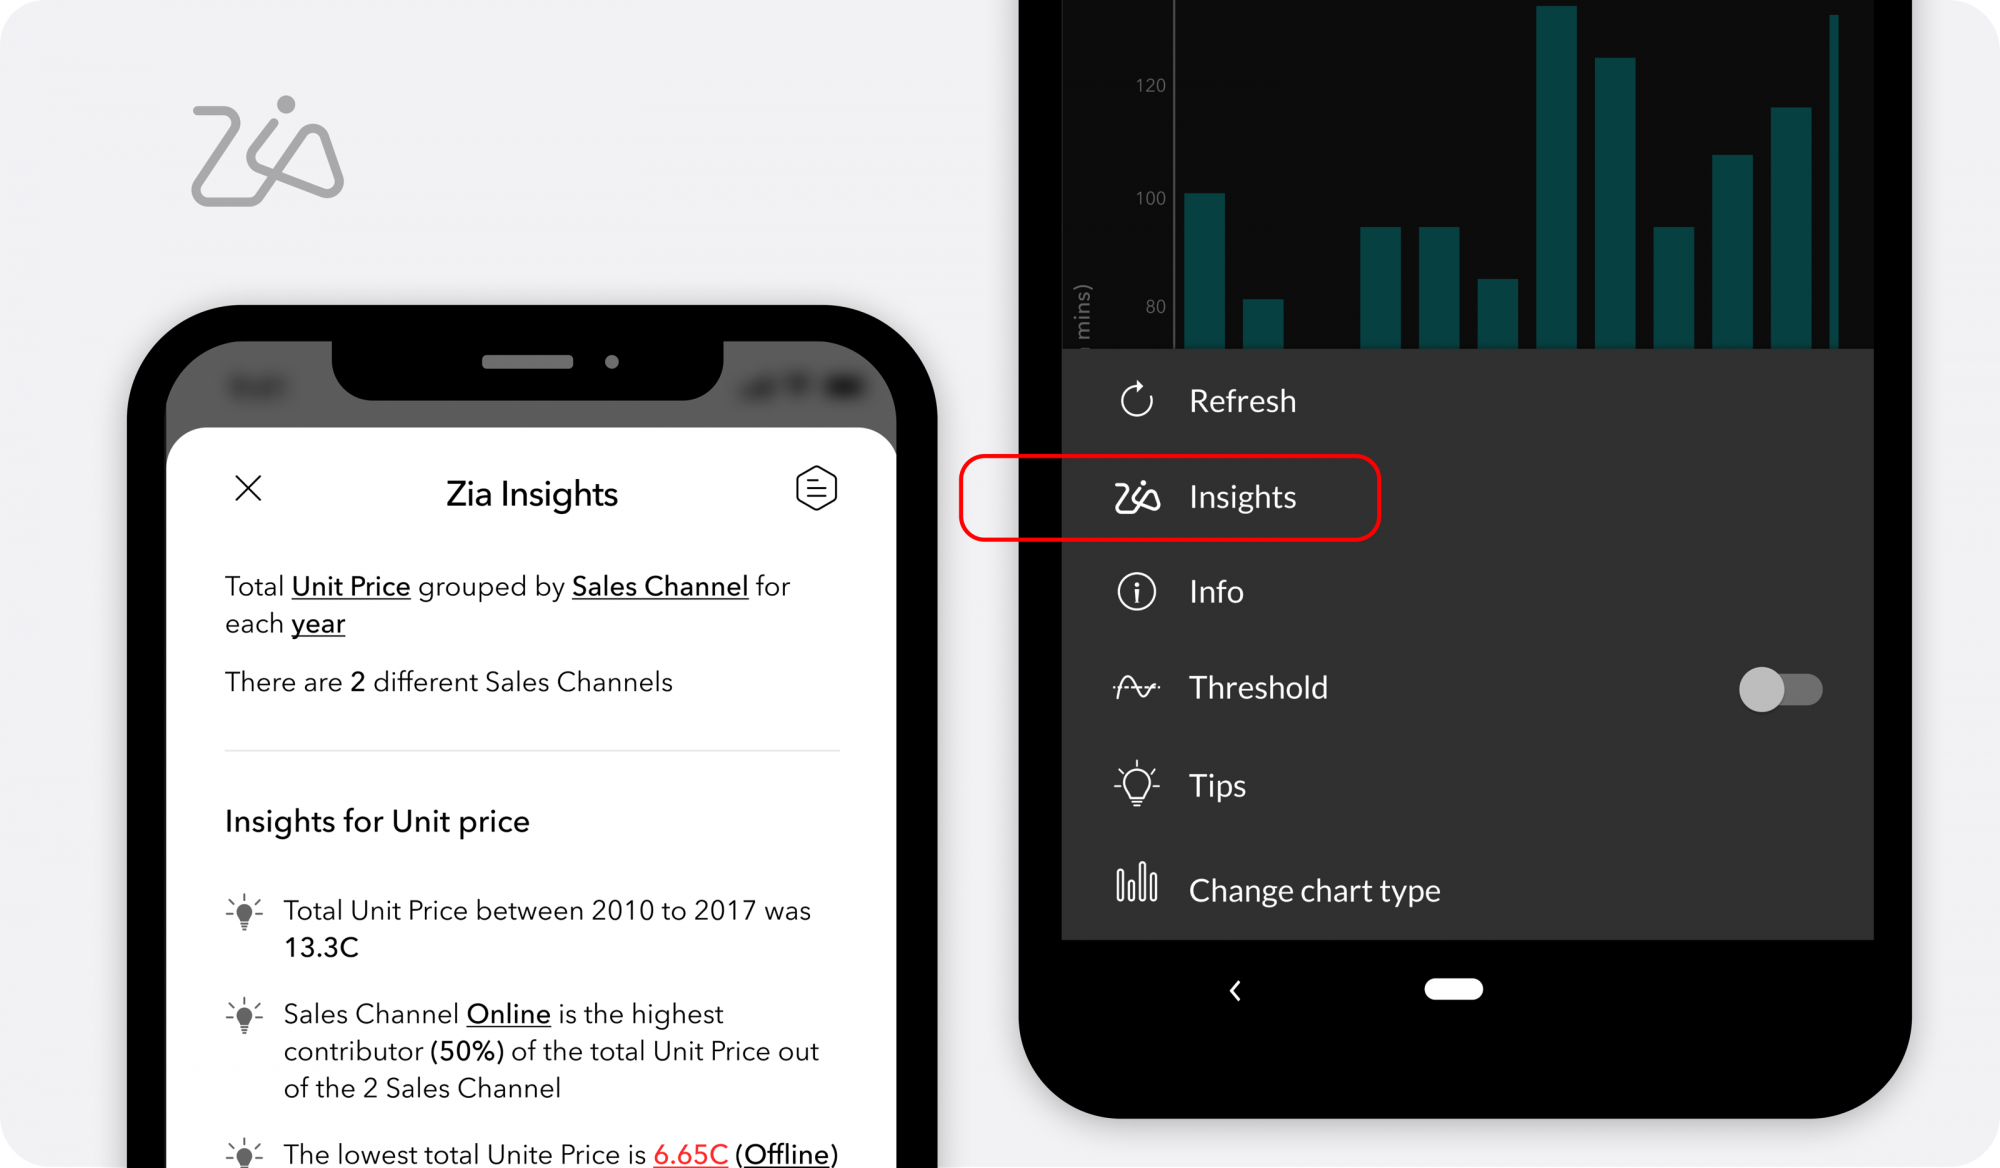
- Zia Insight - You can get actionable insights in the form of digestible narrations for your reports. This enables you to get the insights immediately instead of manually interpreting reports.
- Information - The Information option provides details such as Created Time and Modified Time of an Owned dashboard. For a Shared dashboard, additionally, you can get details about Created by and Shared by.
- Delete - You can delete the workspaces which you own using the Delete icon.
- Tips - The help tips section illustrates the various interactions you can have with your reports. These are user-navigation guides that are report-specific.
- Change chart type (specific to charts) - You can change your chart type by using this option. From the corresponding charts, select More > Change chart type. Choose from the available chart types listed in the Chart Options pane at the bottom. Save the changes made. The modifications made to the charts in your mobile app will get reflected on the Zoho Analytics web as well.

Comments
Zoho Analytics - Dashboards app offers an effective method to foster collaboration with both colleagues and clients. By enabling real-time commenting on a shared dashboard, users can engage in discussions about crucial business metrics. This feature promotes collaborative decision-making, allowing teams to make informed choices together.
To allow users to comment, share the dashboard with them and ensure they have the "Allow Commenting" permission. To learn about Sharing and Publishing your dashboard, click here.
Commenting on a Dashboard:
- Open the Zoho Analytics - Dashboards app.
- Locate and open the dashboard where you want to comment.
- Tap on the Comment icon at the top right corner of the dashboard.
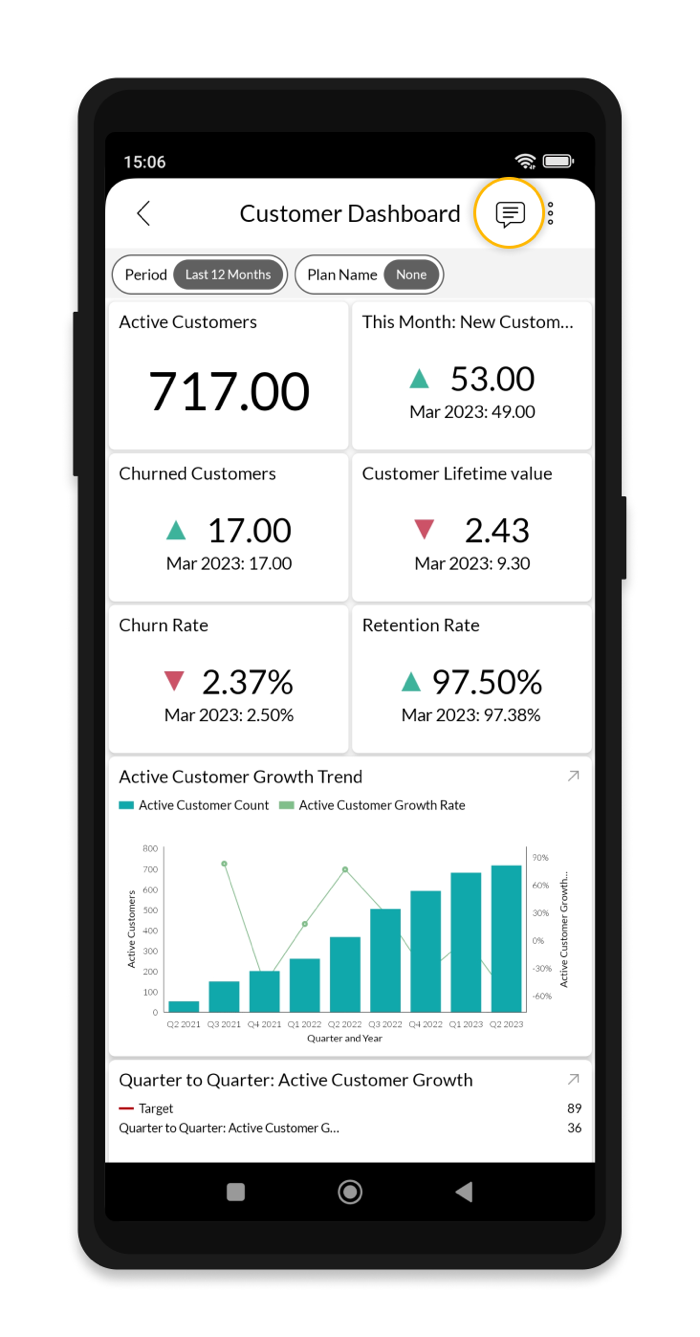
- The Comments page will appear, providing a space to enter your comment.
- Type your comment in the text box at the bottom of the page.
- If you wish to add emphasis to your comment, use the available formatting options like Bold, Italics, Underline, or Strike-through.
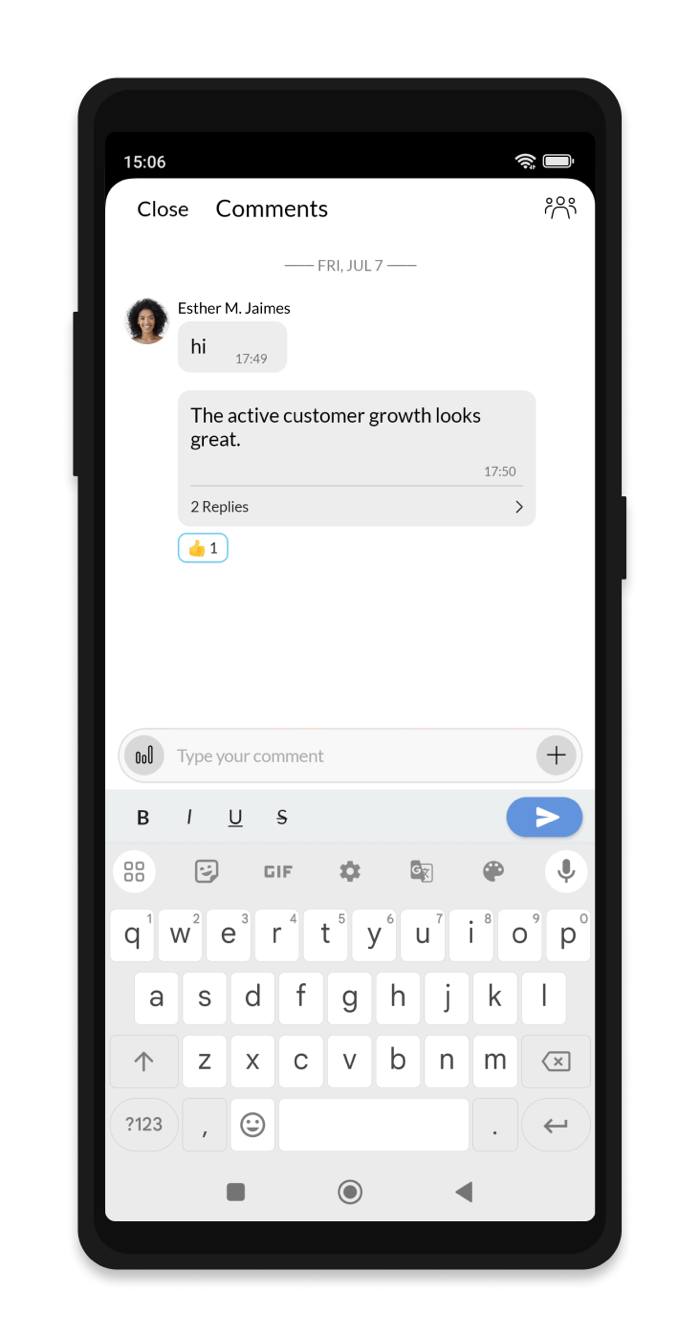
- You can also insert an emoji, by selecting it from the emoji picker.
- Tap on the Send button to share your comment with others.
- You can view comments from all the users on the Comments page.
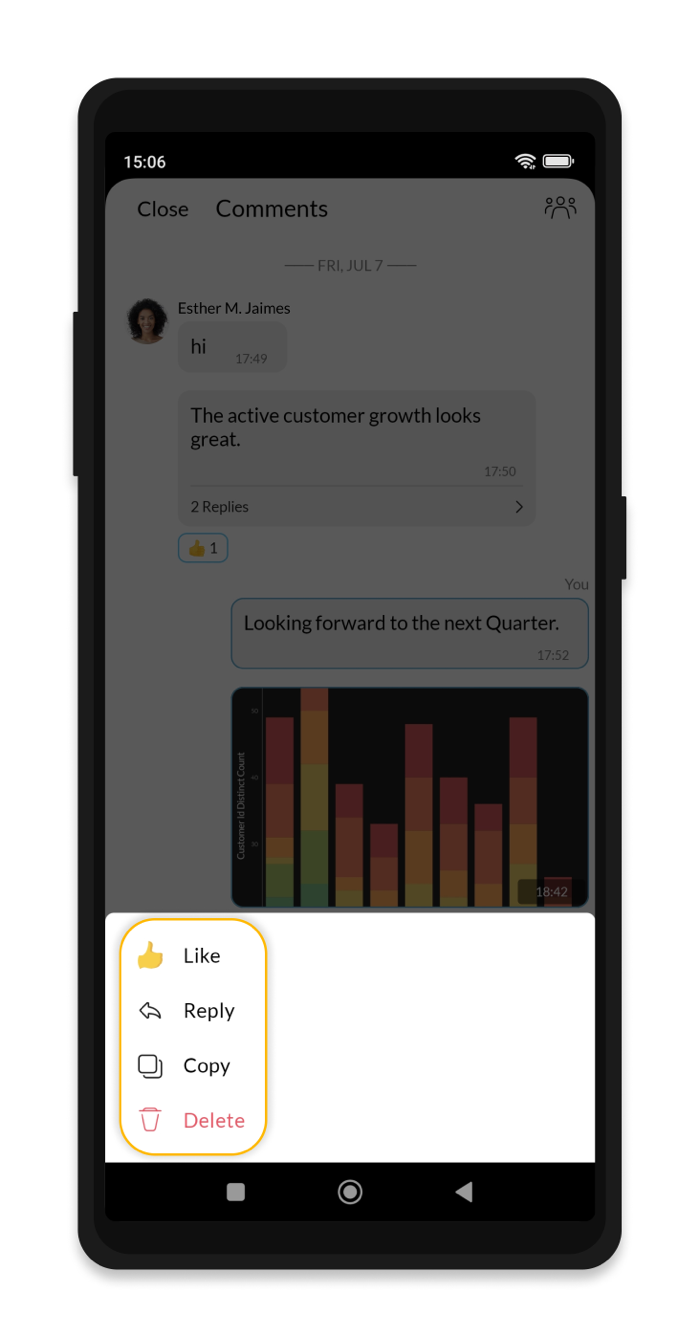
- To perform actions on a specific comment, long-press on that comment. You can Like, Reply, Copy, or Delete the comment.


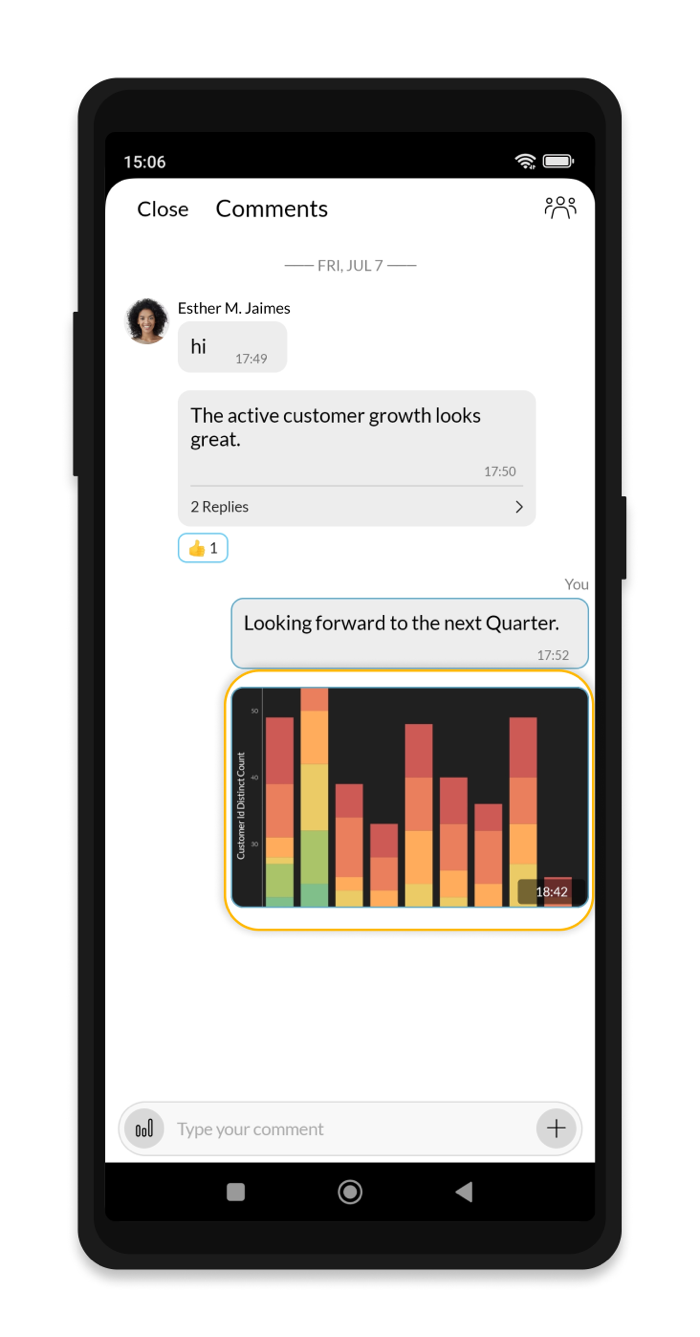
Adding Attachments to Comments:
- For more detailed comments, click on the "+" Add icon on the right side of the comment box.
- Select and attach images, screenshots, or documents related to your comment.

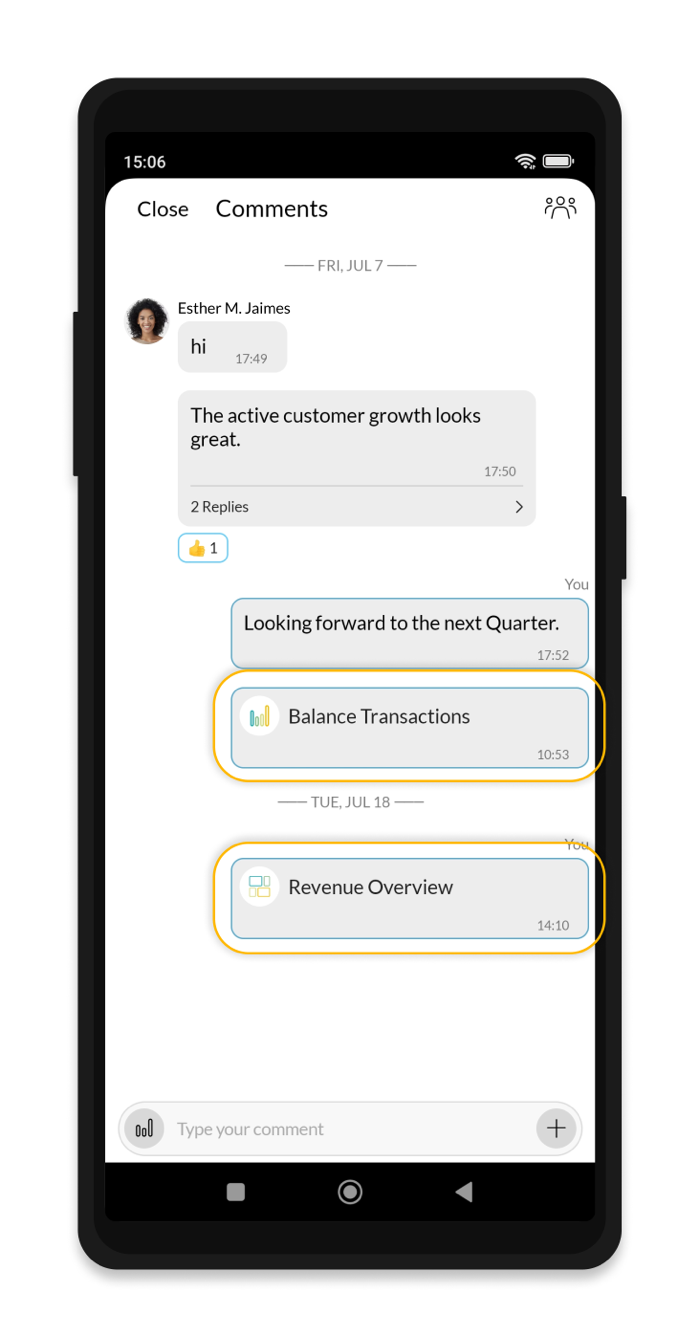
Including Specific Dashboards and Reports in Comments:
- To enhance discussions, you can include specific dashboards and reports in the comment section.
- Click on the Reports icon on the left side.
- Add the relevant Dashboards and Reports to your comment section.

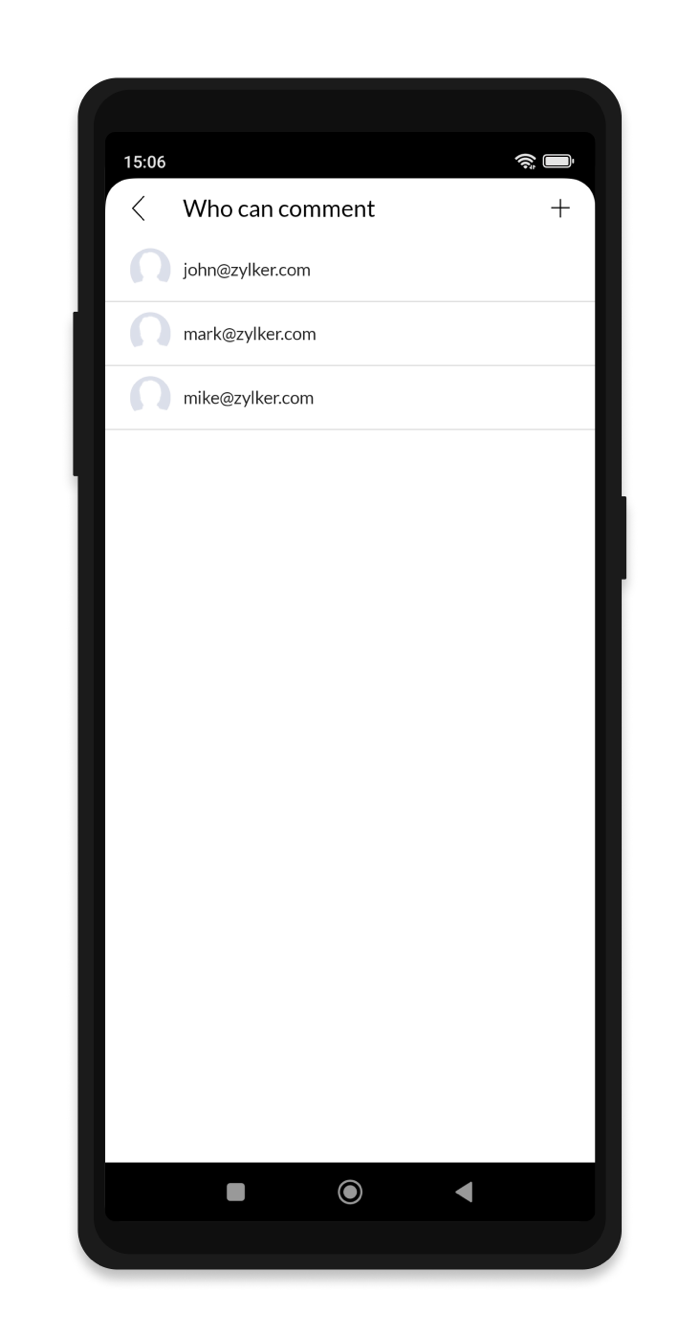
Managing Users Who Can Comment:
- To see the list of users who can comment on your dashboard, tap the Users icon located on the top right of your Comments page.
- To enable the commenting feature for a new user, tap the "+" Add icon.
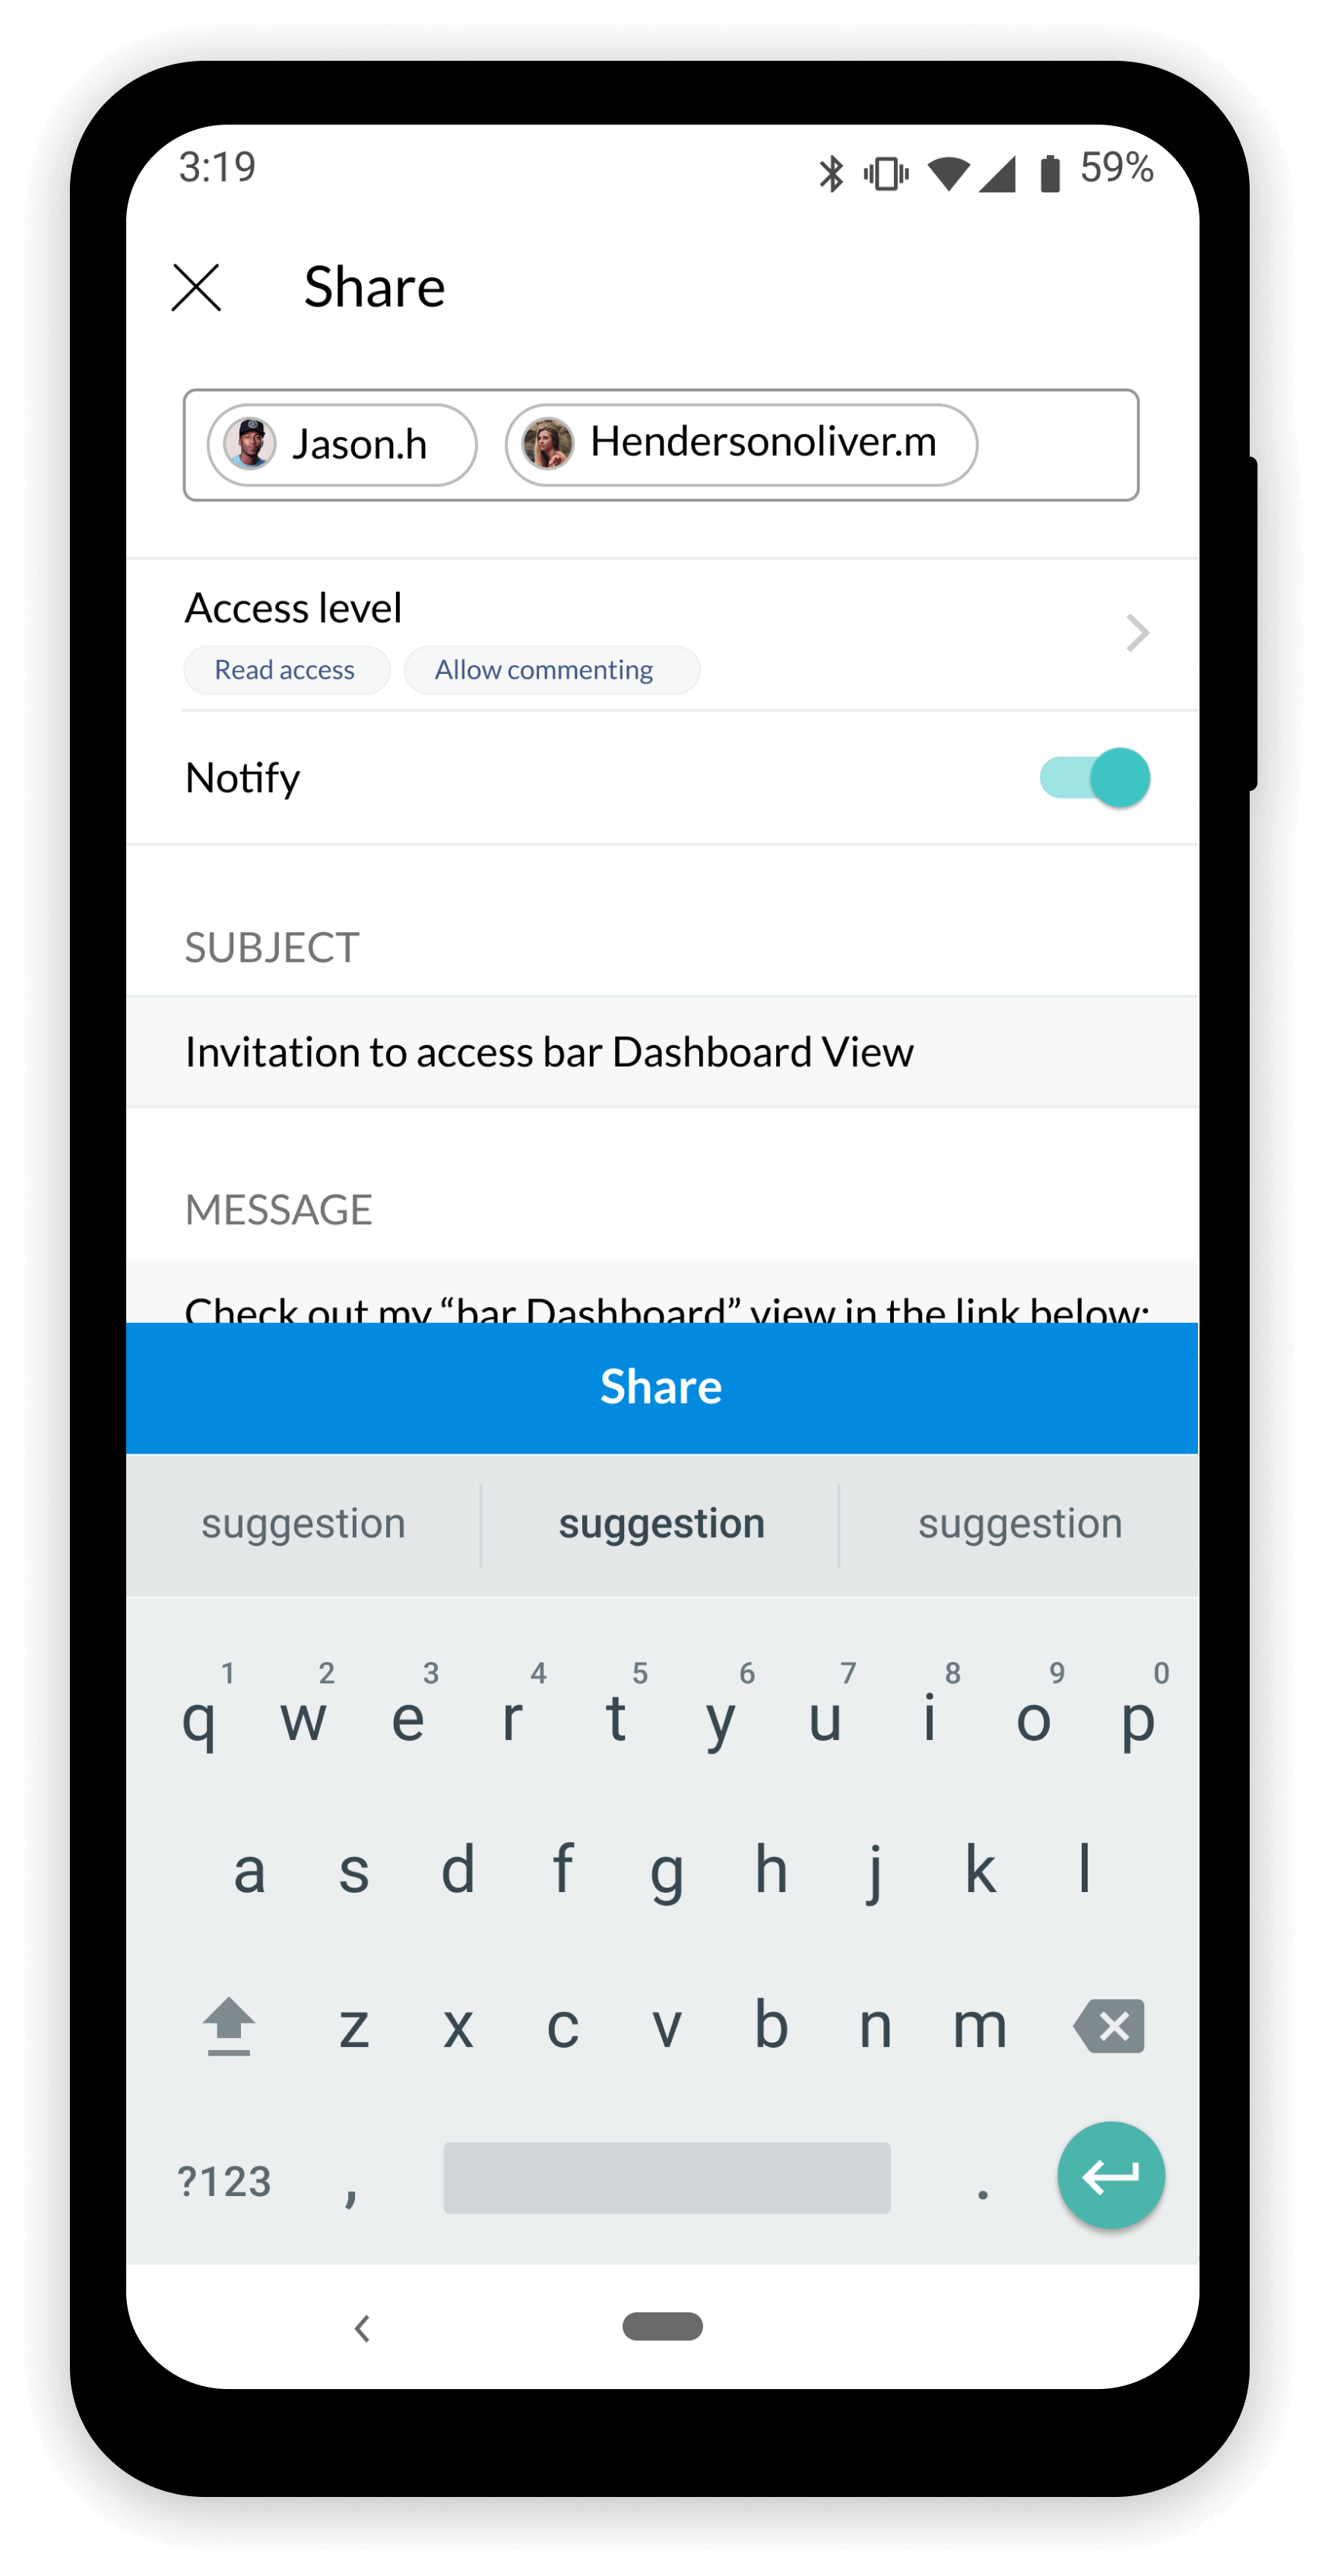
- The Share page will open. Add the user you want to enable commenting for.
- In the Access level tab, enable Allow Commenting to grant the user commenting privileges.


Zoho Analytics - Dashboards App Settings
You can navigate to the mobile app settings by tapping your profile picture icon. Here, you will notice the following options:
- Mark as Default - You can choose to make a workspace default by tapping this option and selecting the required workspace from the list of available workspaces. Once you mark a workspace default, then it will be the opening screen of your Zoho Analytics - Dashboards app when you sign-in. Only one workspace can be set as the default at any given time.
- Dark Theme - The Dark Theme will be the default theme of the Zoho Analytics - Dashboards app. You can enable/disable this theme using the toggle bar inline.
- Tips - Provides help tips on user interactions and mobile gestures that will help you interact with the reports in your dashboards in a more efficient way.
- Privacy & Security - You can view Zoho's privacy policy from here.
- Feedback - We would love to hear from you. Tap this option and mail us your feedback.
- About - If you want to know more about us, this is the right place to get started.
Notifications
In Zoho Analytics - Dashboards app, Notifications will be delivered whenever,
- A view or dashboard is shared with you.
- A user is added or removed from a group.
- A new comment, reply, like or attachment is added to a shared view.
- A scheduled import fails.
- There is an update/change on the status of data integration.
- An alert is triggered.
To enable/disable notifications:
- Open the Zoho Analytics - Dashboards app.
- Tap the Profile icon. The Settings page will open.
- From the Privacy & Security section, tap Push Notifications toggle button to enable/disable push notifications for the Zoho Analytics - Dashboards app.
- From the Settings page, tap Notification Preferences to enable the following:
- Share: Get notified each time a view or dashboard is shared or when an user is added as a workspace admin.
- Group: Get notified each time a user is added to a group.
- Commenting: Get notified each time a new comment is added to a shared view/ dashboard.
- Schedule: Get notified each time, when a scheduled import action fails.
- Account Actions: Stay updated on account related activities like adding or removing a user, and changing the user role.
- Data Sync: Get notified about the status of data integration in the workspaces.