Advanced Analytics for Pipedrive
Integrate Pipedrive data with Zoho Analytics to understand the sales conversion process, assess sales representatives' performance, identify reasons that contribute to customer churn, and develop strategies to mitigate them.
This integration comes with prebuilt reports and dashboards that help you get started with the analysis. Track key metrics like average deal size, average sales cycle, and much more.
- Setting up the Integration
- Handling Data Synchronization Failure
- Manage Data Sources
- Data Modeling & Preparation
- Data Visualization/Analysis
- Sharing & Collaboration
- Help & Support
Setting up the integration
A user with administrator privileges (Account admin, Org admin, and Workspace admin) can configure the integration.
Note:
- The initial fetch might take a few minutes depending on the volume of the data to be imported. An email and an in-app notification will be sent, once the initial fetch is complete.
- The setup process can sometimes fail for a variety of reasons. In this case we request you to access the Data source tab and click the retry link to import again. If the issue persists then write to support@zohoanalytics.com
Modules and Fields
The below table lists the modules and fields that will be synced to Zoho Analytics.
| Modules | Fields |
| Activities | Activity ID, Activity Done, Type, Subject, Assigned to user, Conference Meeting Client, Conference Meeting URL Conference Meet, Due Date, Due Time, Busy Flag, Add Time, Marked As Done, Public Description, Organisation, Contact person, Deal, Updated Time, Updated User ID, Source Timezone, Lead, Apartment/suite no of Location, House number of Location, Street/road name, District/sublocality, Location Locality, Location Admin, Area 1, Region of Location, Location Country, Location Postal Code, Full/combined address of location, Busy Flag Status, Activity Duration, Overdue Activities, Location, Duration |
| Activity Attendees | Activity ID, Email ID, Name, Status, Is Organizer, Attendee Person ID, Attendee User ID |
| Activity Participants | Activity ID, Participant Person, Primary Flag |
| Activity Types | Activity Types ID, Name, Key Name, Active Flag, Custom Flag, Add time, Update Time |
| Call Logs | Log ID, Activity ID, Organization ID, Person ID, Deal ID, Duration, Outcome, Phone Number, Has Recording, Start Time, End Time, User ID |
| Currencies | Currency ID, Currency Code, Name, Symbol, Decimal Points, Active Flag, Custom Flag |
| Deal Followers | Follower ID, User ID, Deal ID, Add Time |
| Deal Label Association | Deal ID, Label |
| Deal Labels | Label ID, Label, Color |
| Deal Participants | Participant ID, Person ID, Deal ID, Active Status, Added By |
| Deal Products | ID,Deal ID, Product ID, Product Variation ID, Name, Duration Unit, Formatted Sum, Formatted Quantity, Tax, Comments, Last Edit Time, Add Time, Enabled Flag, Active Flag, Currency, Sum, Duration, Item Price, Quantity, Discount Percentage |
| Deals | Deal ID, Contact person, Organisation, Pipeline ID, Stage, Owner, Creator, Next Activity Subject, Products Count, Files Count, Notes Count, Followers Count, Email messages count, Total activities, Done activities, Activities to do, Participants Count, Expected Close Date, First Won Time, Next Activity Type, Next Activity Duration, Next Activity Note, Currency of Weighted value, Rotten Time, CC Email, Organization Hidden, Person Hidden, Title, Value Currency, Stage Change Time, Active, Status, Probability, Next Activity Date, Next Activity Time, Next Activity ID, Last Activity ID, Last Activity Date, Lost reason, Formatted Value Add Time, Update Time, Weighted value, Formatted Weighted Value, Won Time, Lost Time, Close Time, Stagechange, Age in Days, Age Tier, Amount Tier |
| Goal Intervals | Goal ID, Start Date, End Date, Target |
| Goals | Group ID, Parent Group ID, Name, Active Flag, Assignment Count, SubGroup Count, Level, Description |
| Goals Activity Type | Goal ID, Activity Type ID |
| Groups | Group ID, Parent Group ID, Name, Active Flag, Assignment Count, Sub Group Count, Level, Description |
| Label ID | Name, Label Color, Add Time, Update Time |
| Leads | Lead ID, Title, Person ID, Organization ID, Creator ID, Owner ID, Visible to, Amount, Currency, Expected Close Date, archived, Source Name, Seen, Next Activity ID, Add Time, Update Time, CC Email |
| Notes | Note ID, Active Flag, Project ID,Content, Organization, Contact person, Deal title, User, Lead, Add Time, Update Time, Pinned to Deal Flag, Pinned to Person Flag, Pinned to Organization Flag, Pinned to Lead Flag, Pinned to Project Flag, Last Update User ID. |
| Organization Followers | Follower ID, User ID, Organization ID, Add Time. |
| Organization Label | Label ID, Label, Color |
| Organizations | Organizations ID, Owner, Next Activity ID, Name, Open deals count, Closed deals, Related Closed Deals count, Email messages count, Total activities, Done activities, activities to do, Files count, Notes count, Followers count, Won deals, Related Won deals, Lost deals, Related Lost deal, Active Flag, People count, Category ID, Country Code, First character, Update Time, Add Time, Last Activity ID, Label ID, Address, Apartment/ suite address, House number of address, Street/road name, District/sublocality of Address, City/town/village, Address Admin Area level 1, Region of address, Address country, Address Postal Code, Full/ combined address of address, CC Email, Related Open Deals, Next Activity Date, Last Activity Date, Next Activity Time |
| Permission Sets | Permission Set ID, Name, Assignment Count, App, Type |
| Person Email | Person ID, Label, Email ID, Primary |
| Person followers | Follower ID, User ID, Person ID, Add Time |
| Persons Label | Label ID, Label, Color |
| Person Phone Number | Person ID, Label, Primary, Phone |
| Persons | Person ID, Name, Organization, Owner, Person created, Update time,Visible to, Won deals, Lost deals, Closed deals, Total activities, Done activities, Activities to do, Email messages count, Last email received, Last email sent, First name, Last name, Open Deals Count,Next Activity Date, Next Activity Time,Last Activity Date,Updated Time, Added Time, Label ID, Related Open Deals Count, Related Closed Deals Count, Participant Open Deals Count, Participant Closed Deals Count, Files Count, Notes Count,Followers Count, Related Won Deals Count, Related Lost Deals Count, Next Activity ID, Last Activity ID, Cc Email |
| Pipelines | Pipeline Name, Deal Probability, Pipeline ID, URL Title, Is Active, Added Time, Updated Time, Is Selected |
| Product Category | Category ID, Label |
| Product Followers | Follower ID, User ID, Product ID, Add Time |
| Product Prices | Price ID, Product ID, Price, Currency, Cost, Overhead Cost |
| Product Variation | Product Variation ID, Name, Product ID, Description |
| Product Variation Prices | Variation Price ID, Product ID, Product Variation ID, Currency, Cost, Comment, Price, Price Formatted |
| Products | Product ID,Tax,Category ID,Active Flag,Selectable,Files Count,Add Time,Update Time,Name,Product code,Visible to,Unit,Description,Owner |
| Stages | Stage ID, Stage Name, Active Flag, Deal Probability,Pipeline ID, Rotten Flag, Rotten Days, Updated Time, Add Time |
| Subscription Payment | Payment ID,Subscription ID, Deal ID, Active Status, Currency, Description, Add Time, Update Time, Amount, Due Date, Revenue Movement Type, Payment Type |
| Subscription | Subscription ID, User ID, Deal ID, Active Status, Cycle Amount, Cycle Count, Infinite, Currency, Start Date, End Date, Description, Add Time, Update Time, Lifetime Value, Interval, Final Status |
| Team Users | Team ID, User ID |
| Teams | Team ID, Team Name, Description, Manager ID, Active Flag, Add Time, Creator ID |
| User Access | User ID, App, Admin Access, Permission Set ID |
| Users | User ID, Name, Email, Timezone, Default currency, Active Flag, Group ID, Has Created Company, Is Admin, Locale, Timezone, Timezone Offset, Created Time, Is You, Last Login Time, Modified Time |
Data Sync Frequency
Zoho Analytics offers flexible sync schedules to ensure that your data is always up-to-date for effective analysis. These schedules allow you to automate the process of updating your data, ensuring that your analyses are based on the latest information.
- 1 Hour (Enterprise plan only)
- 3 Hours
- 6 Hours
- 12 Hours
- Every day
Handling Data Synchronization Failure
Data synchronization can fail,
- If the data type of a field is changed in the Pipedrive Application.
- If the Modules and Field selected for analysis are deleted in the source application.
- If the user who configured the integration no longer has permission to access the modules.
In any of the above mentioned cases, the data sync will be paused. You will be notified via email and in- app notification with the exact reason for failure along with the solution.
To resolve the sync failure, delete or restructure the views, or restore the specific modules and fields from the source application. Refer to Data Sync failure and solutions article for more details.
Once you have made the changes, click the Sync now option in the data source tab to resume data sync. If the issue persists, contact support@zohoanalytics.com
Manage Data Sources
The Data Sources tab provides essential information to monitor and manage the integration setup. It also allows you to edit the settings as needed. Users with administrator privileges will be able to view and modify the connection settings.

Data Source Permalink
The Data Source Permalink helps you directly access the Synchronization Status tab. Users can know the synchronization details like whether the last data sync was successful or not, when the last data sync happened, when the next sync is scheduled to happen, etc.

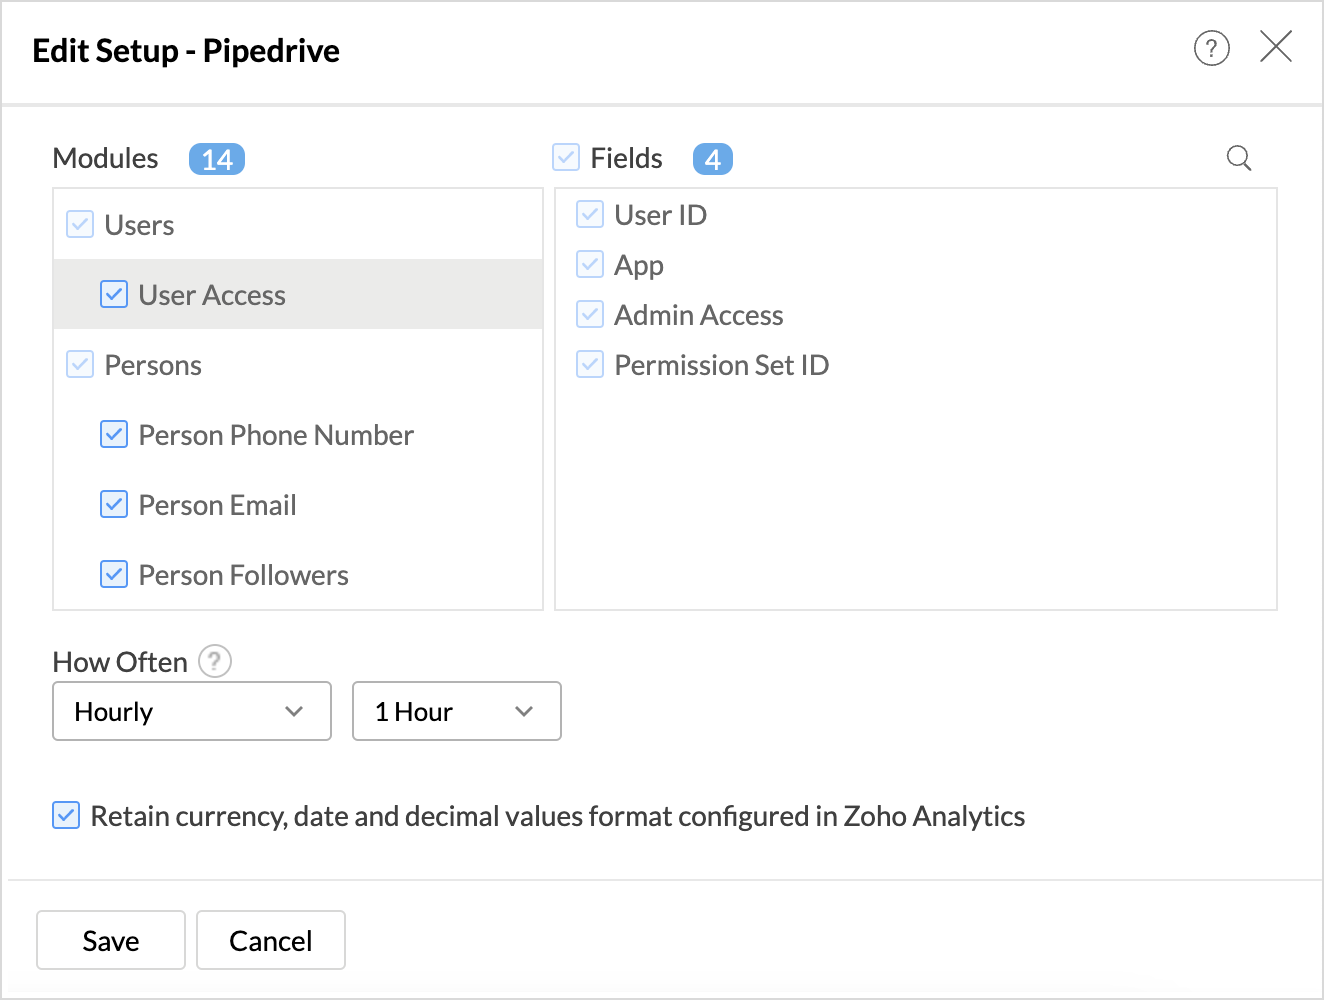
Edit Setup
The Edit Setup tab allows you to add or delete modules or fields, change the schedule interval, and modify other settings specific to the business application.
To modify the settings,
- Click Data Sources > Edit Setup.
- The Edit Setup - Pipedrive dialog will open. Modify the settings as needed and click Save.

Re- Authenticate
Re-authentication will be helpful when the API key or password is changed. In this case, the data sync will be paused, and the administrator who configure the connector setup must re-authenticate to resume the data sync.
To re-authenticate,
- Click Data Sources > Re-Authenticate.
- The Re-authenticate - Pipedrive dialog will open. Click Authenticate Pipedrive.
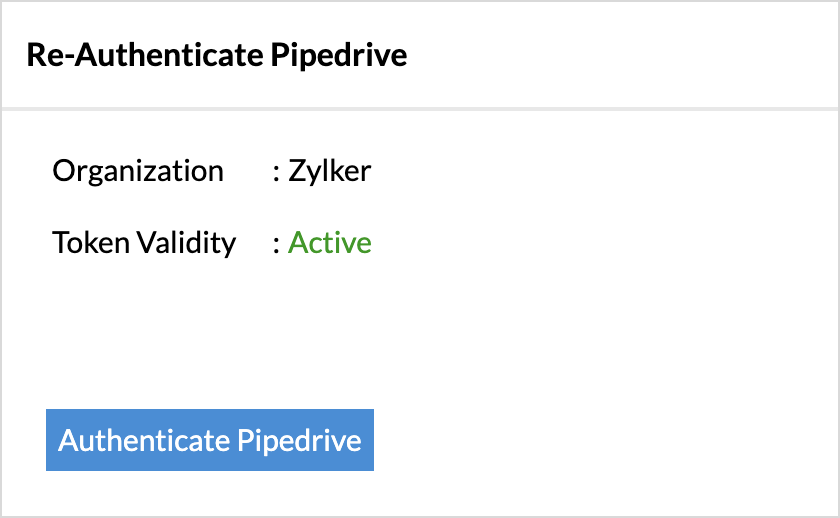
- Login in to your Pipedrive account for Zoho Analytics to verify the identity.

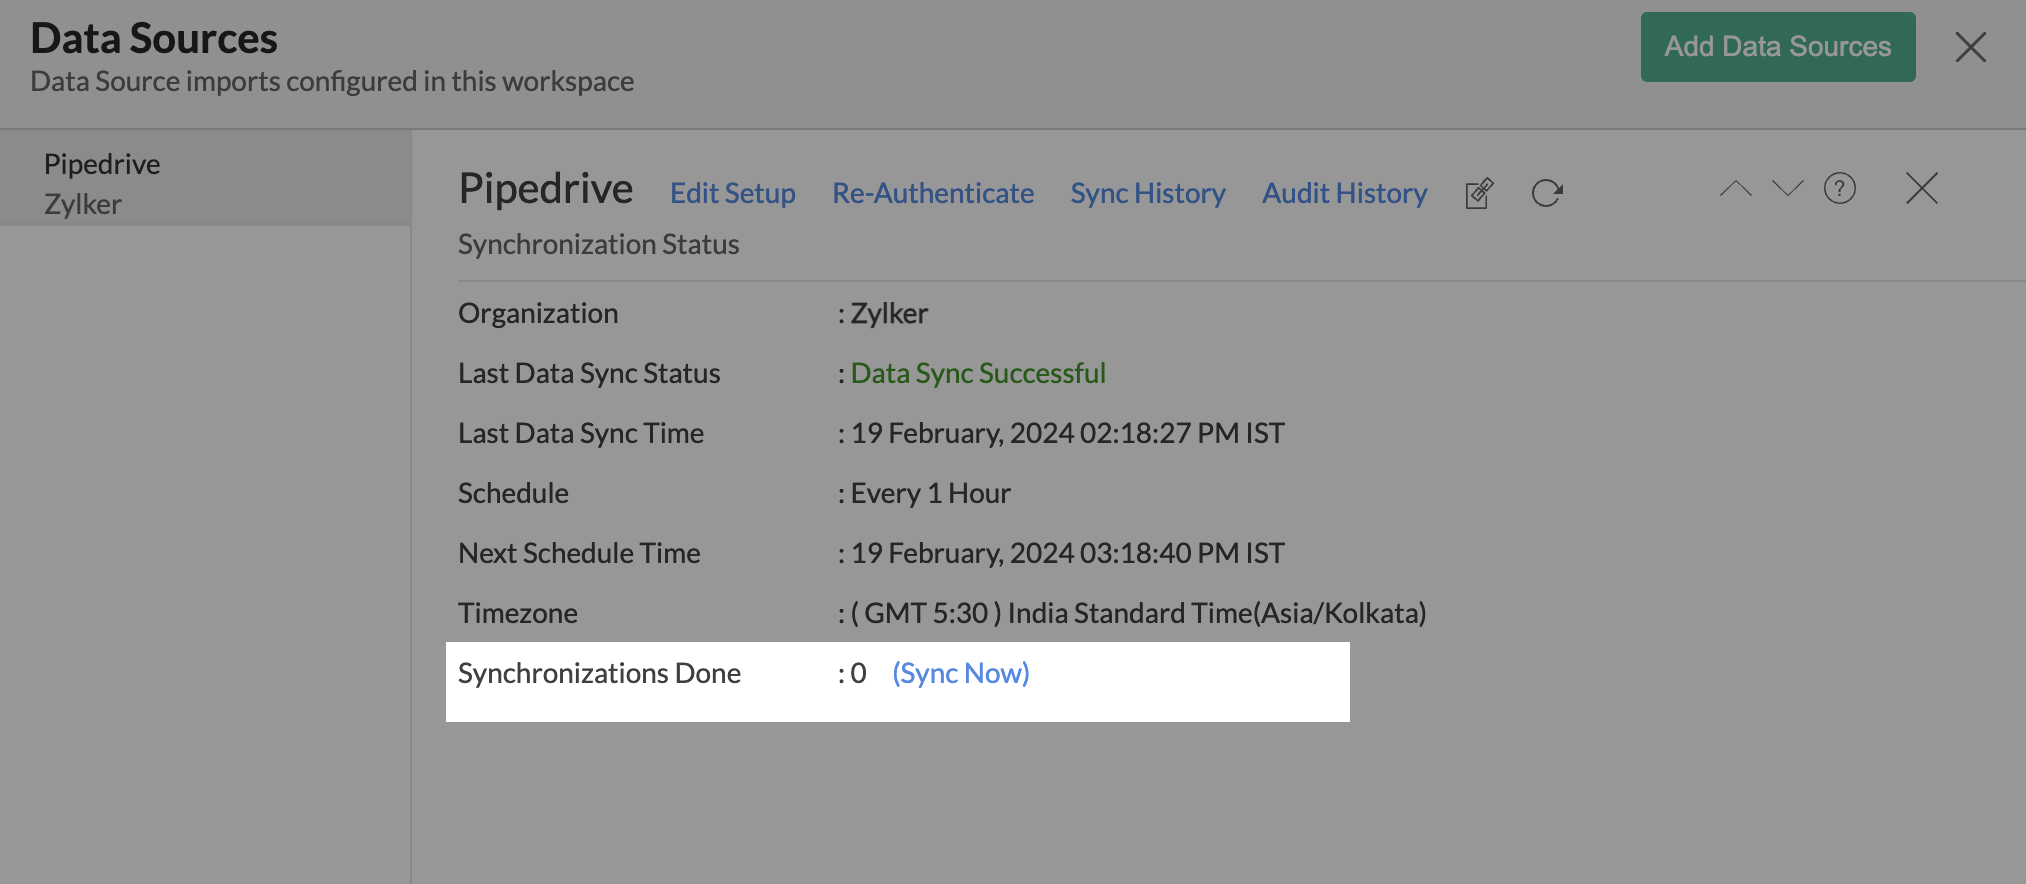
Sync Now
The Sync Now option helps import data without having to wait until the next scheduled interval.
To initiate a full data fetch,
- Access the Data Sources tab.
- Click Sync now to import data without having to wait till next sync schedule.

Sync History
The Sync History tab provides details about the data sync for the last 45 days. A successful data sync is marked in green, and a sync failure is marked in red.
To view the Sync history,
- Click Data sources > Sync History.
- A calendar with the Sync History of the last 45 days will open. The date when the data sync has happened will be highlighted. Hover to view the number of times the data had got synced on a specific date.
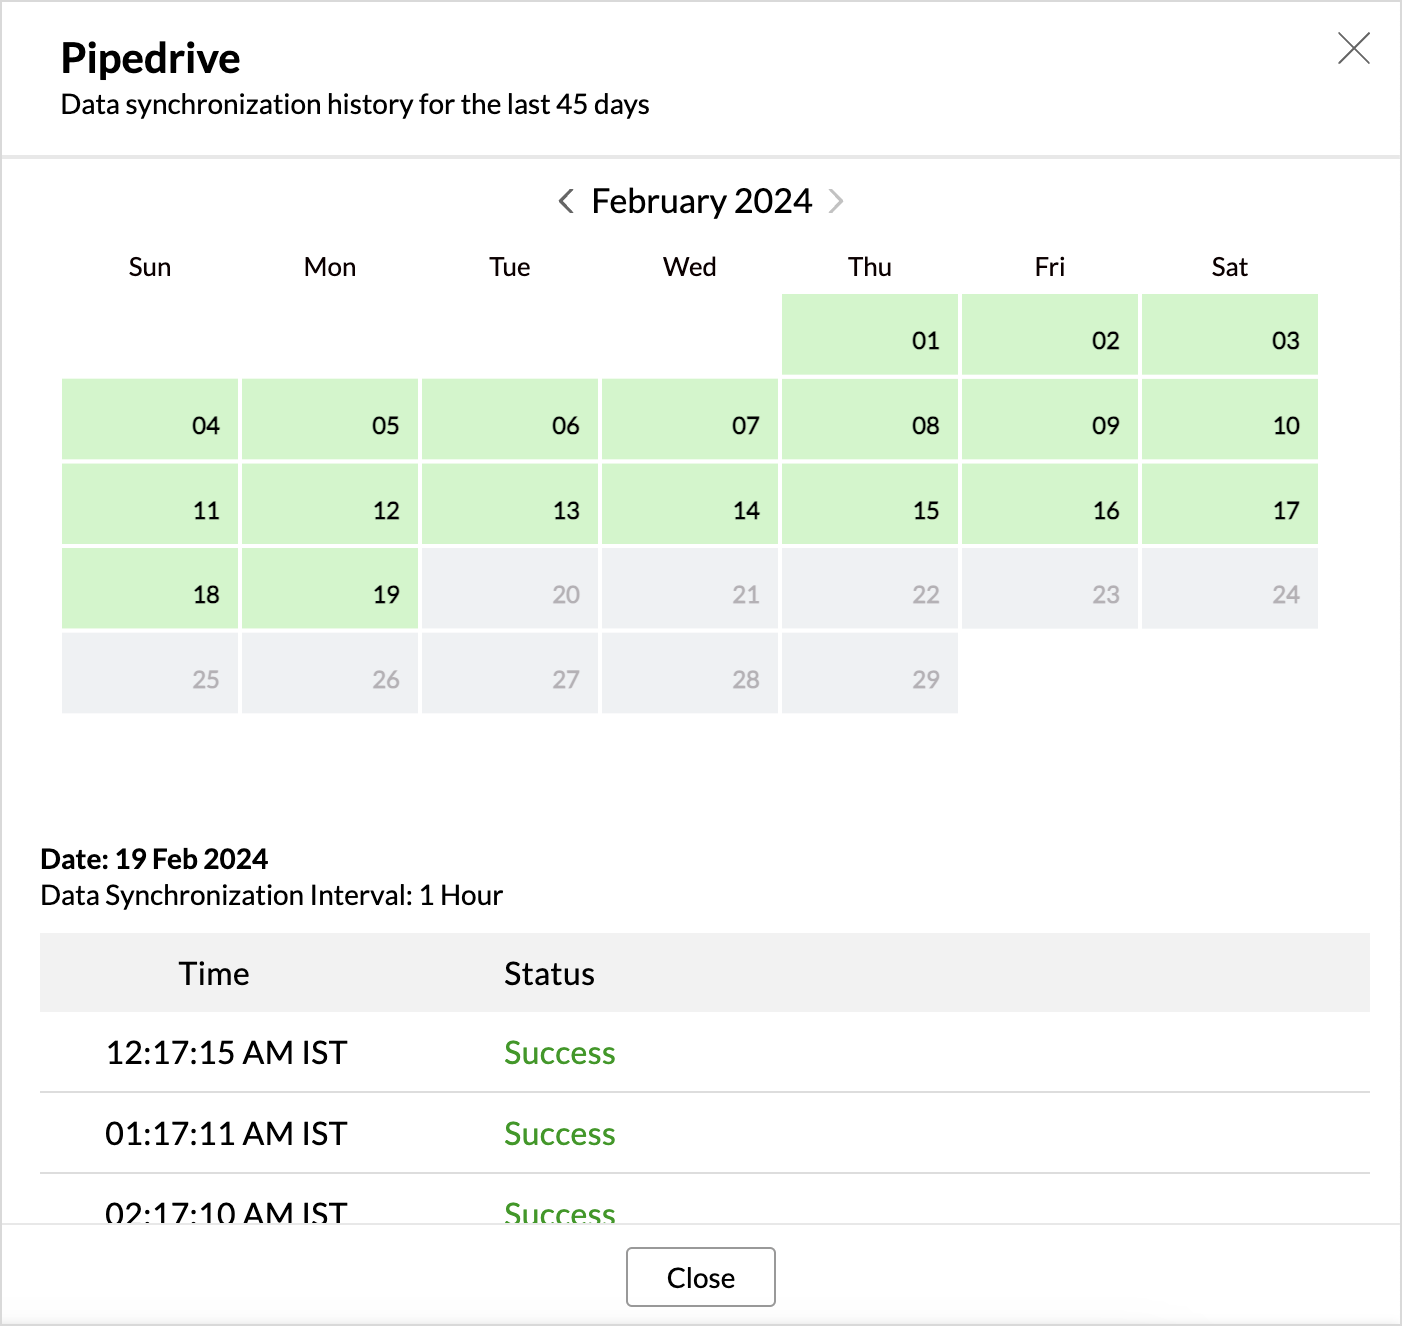
- Click the date to view more details.
- Time - Displays the time when the data is synced.
- Status - Shows whether the sync was a success or a failure.In case of failure, the reason will be displayed. Refer to this page to learn how to resolve the issue and avoid further failure.

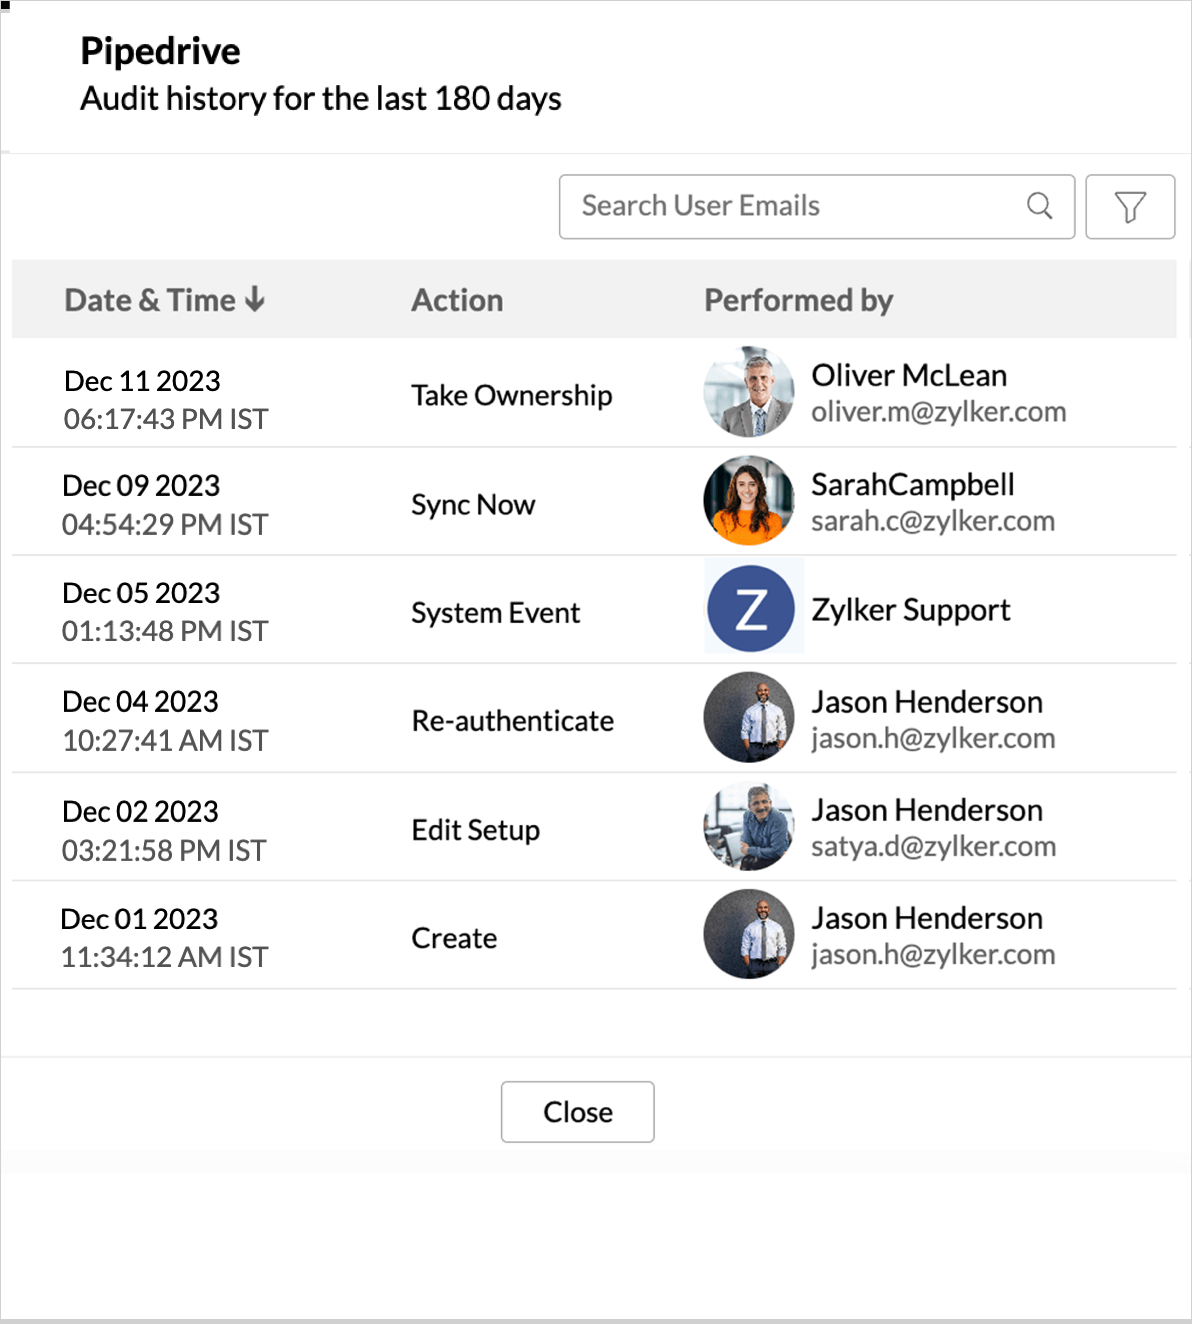
Audit History
Zoho Analytics logs all the user activities and system events within the Pipedrive workspace. The following actions that are logged in Zoho Analytics,
- User Action: Create, Modules Added, Modules Removed, Fields Added, Fields Removed, Schedule Change and Entities Modified, Delete, Take Ownership, Re-authenticate, Sync Now, Retry.
- System Action: Plan upgrade or downgrade.
To view the audit history,
- Click Data Sources > Audit History.
- A dialog with the activities for the last 180 days will open.

Remove Data Source
Zoho Analytics allows you to remove the integration if needed. Removing the integration will suspend further data synchronization. The data tables and the reports will be available.
Click the Settings icon in the Data Sources tab, and select Remove Data Source from the drop-down menu.

Data Modeling & Preparation
Zoho Analytics allows you to combine data from various sources such as Files, Feeds, Databases and Business Applications for an in-depth analysis. Query Tables allows you to combine data from different tables to create reports.
While blending data from other data sources, Zoho Analytics automatically identifies similar columns and provides suggestions for lookups. Refer to the Joining Tables article for more details.
Formulas
The default formulas in the Activities table.
| Formula Name | Formula | Description |
| Formula Column | ||
| Duration | timediff("ADD TIME","Due date") | Gives the duration |
| Flag Status | if("Busy Flag"=0,' free', if("Busy Flag"=1, 'busy', null)) | Denotes the status of each activity |
| Duration | to_duration( ((to_decimal(substring_before("Duration",':')))*3600) + (to_decimal(substring_between( "Duration", ':', ':'))*60) + substring_after("Duration", ':', 2)) | Gives the duration of each activity in HMS format. |
| Overdue Activities | if("Due date"<date(today()) AND "Activity Done"='No', 'Yes', 'No') | Helps identify activities that are overdue. |
| Aggregate Formula | ||
| Activities per Won Deal | count_if("Activities"."Activity Done" = 'Yes')/count_if("Deals"."Status" = 'won') | calculates the ratio of the number of completed activities to the number of deals marked as won. |
| Overdue Activities Count | count_if("Activities"."Overdue Activities" = 'Yes') | Gives the number of overdue activities |
The default formulas in the Deals table.
| Formula Name | Formula | Description |
| Age in days | datediff(ifnull("Close Time",now()),"Add Time") | Calculates the number of days it took for a deal to be closed. |
| Age Tier | if( "Age in Days" >= 0, if( "Age in Days" <= 60, '1. 0 - 60 days', if( "Age in Days" <= 120, '2. 61 - 120 days', if( "Age in Days" <= 180, '3. 121 - 180 days', if( "Age in Days" <= 360, '4. 181 - 360 days','5. Above 360 days')))), '6. Negative - Not Valid') | Classifies the time spent on deals to close them. |
| Amount Tier | if( "Weighted value" >= 0, if( "Weighted value" <= 500, '1. 0 - 500', if( "Weighted value" <= 1000, '2. 501 - 1K', if( "Weighted value" <= 10000, '3. 1,001 - 10K', if( "Weighted value" <= 50000, '4. 10,001 - 50K','5. Above 50K')))), '6. Negative - Not Valid') | Classifies the deals based on the sales value. |
| Aggregate Formulas | ||
| Activities per Won Deal | count_if("Deals"."Done activities")/count_if("Deals"."Status" = 'won') | Provides the count of Activities (Tasks, Events, and Calls) involved to win a deal. |
| Win Rate % | count_if("Deals"."Status" = 'won')*100/count("Deals"."Deal ID") | Provides the Win Rate (in %) of sales. This is calculated as a Ratio between number of deals won and total number (won + lost) of deals |
| Won Amount | sum_if("Deals"."Status" = 'won',"Deals"."Weighted value",NULL) | Total amount of sales won (made) |
| Won Deals Count | count_if("Deals"."Status" = 'won') | Gives the total number of deals won |
| Average Deal Size Won | sum_if("Deals"."Status" = 'won',"Deals"."Weighted value",NULL)/count_if("Deals"."Status" = 'won') | Calculates the average revenue generated from sales. |
| Average Sales Cycle | avgif("Deals"."Status" = 'won',"Deals"."Age in Days") | Calculates the average number of days to convert a deal. |
| YTD Sales | ytd(sum(if(year("Deals"."Close Time") = year(today()),"Deals"."Weighted value",NULL)),"Deals"."Close Time") | Calculates the total sales |
| YTD Won Deals | ytd(count(if(year("Deals"."Close Time") = year(today()),"Deals"."Deal ID",NULL)),"Deals"."Close Time") | Calculates the won deals |
| Lost Amount | sum_if("Deals"."Status" NOT IN ('won'),"Deals"."Weighted value",NULL) | Calculates the total amount of sales lost |
| Lost Deals Count | count_if("Deals"."Status" NOT IN ('won')) | Calculates the total number of deals lost. |
| Lead Conversion Rate | count("Deals"."Deal ID")*100/count("Leads"."Lead ID") | Calculates the percentage of leads converted. |
Data Visualization/Analysis
Zoho Analytics offers a wide range of visualization types to conduct your analysis.
Creating Reports over Pipedrive data
Chart Types in Zoho Analytics
| Visualization | Types |
Bar | Stacked bar, Histogram, Horizontal bar |
Stacked Bar | Horizontal Stacked bar, 100% vertical and horizontal stacked bar |
Area | Area with markers, Smooth Area, Smooth area with Markers |
Line and Bar Combination chart | Bar with Line, Bar with Bubble, Bar with Scatter, Bar with Area, Area with Bubble, Line with Bubble and Custom Combination |
Bubble Chart | Bubble Pie, Packed Bubble, Word Cloud |
Stacked Area | Stacked area with markers, Smooth stacked area, Smooth stacked area with markers |
Map | Heat Map, Map Scatter, Map Bubble, Map Pie, Map Bubble Pie, Map Filled, Geo Heat Map |
Tree map | Not Applicable |
Pie | Pie, Ring, Semi Pie, Semi Ring |
Doughnut | Not Applicable |
Matrix View | Pivot table |
Tabular | Summary and Tabular view |
Dashboards and KPI widgets | Single Numeric Widget, Dial Chart Widget Bullet, Chart Widget |
Sharing and Collaboration
- Share data and reports with your colleagues & friends with fine-grained permission
- Enable real-time commenting on a shared view to efficiently collaborate with your users
- Publish reports for wider consumption. Embed reports/dashboards within your websites, web applications, and blogs.
- Export, Email, and Print reports in a variety of formats.
- Use Zoho Analytics mobile apps (optimized for both IOS and Android platform) and access the reports and dashboards on the go.
Help & Support
We offer 24x5 technical support (Monday to Friday). In case if you need our assistance kindly do mail us your questions to support@zohoanalytics.com.
You can also reach out to us on our toll-free numbers.
United States: +1 (888) 900 9646
United Kingdom: +44 (20) 35647890
Australia: +61-2-80662898
India: 044 - 69656060