• 16K

    Customers

  • 3M

    Users

The data is there. The answers aren't.

Leadership teams are short on a single place where data makes sense together.

  • Data scattered across every tool

    Revenue in the CRM. Costs in the accounting tool. Campaign spend across three ad platforms. Getting a complete picture means chasing down five different logins and stitching numbers together in a spreadsheet.

  • Reports that are outdated before they're read

    By the time someone pulls the data, reconciles the numbers that don't match, and sends the report, it's already partially wrong. Decisions made on last week's figures aren't data-driven.

  • Dashboards built for analysts, not decision-makers

    Many BI tools are optimized for the people building the reports, not the people reading them between meetings. When every small change requires a data analyst's help, the dashboard stops being a tool and starts being a bottleneck.

Meet Zoho Analytics, the executive dashboard software used by 20,000+ businesses

Connect all your data, build live executive dashboards, and share them with your leadership team.

Connect 500+ data connectors

CRM, finance, marketing, HR, databases, and spreadsheets. Connect once, sync automatically.

Ask Zia, the AI agent

Ask questions in plain language. Get reports, forecasts, diagnostics, and recommendations instantly.

Recognized in the Gartner Magic Quadrant

Recognized as a Niche Player in the 2025 Gartner Magic Quadrant.

How to create an executive dashboard in Zoho Analytics

Most users have a working dashboard in the same session they sign up. Here's how it works.

Ready-to-use executive dashboard templates and examples for every function

Here are the four executive dashboards our customers build most often. Each comes with a pre-built template, connects to your existing tools, and refreshes automatically.

Executive sales dashboard showing pipeline health, conversion rates, and quota attainment

Executive Sales Dashboard

Sales dashboard software pulls directly from your CRM and gives you a live view of pipeline health, stage-by-stage conversion, rep performance, and forecast vs. actuals, without rebuilding a report every time you need to check.

KPIs typically tracked: Pipeline value, win rate, average deal size, quota attainment by rep, revenue forecast vs. target, deals by stage, average sales cycle length etc.

View sales dashboard templates

Executive Finance Dashboard

Finance dashboard software connects to your accounting software and pull revenue, expenses, cash flow, and P&L in real time. You can also blend your financial data with CRM data to see which customer segments drive the most profitable revenue, not just the highest top-line number.

KPIs typically tracked: Revenue vs. budget, gross margin, cash flow, accounts receivable aging, operating expenses by category, profit and loss by product line, budget variance etc.

View finance dashboard templates
Executive finance dashboard showing revenue vs. budget, cash flow, and P&L
Executive marketing dashboard blending data from Search Console, Google Ads, Meta, HubSpot, and CRM

Executive Marketing Dashboard

Marketing data is scattered across more tools than almost any other function. Organic traffic in Search Console. Paid spend in Google Ads and Meta. Email in HubSpot or Mailchimp. Pipeline attribution in the CRM.

Marketing dashboard software blends all of these into one view so you can see the full picture from first touch to closed deal, and actually answer where your best leads come from.

KPIs typically tracked: CAC by channel, marketing-sourced pipeline, MQL to SQL conversion, ad spend vs. revenue, email performance, website traffic by source, SEO trend etc.

View marketing dashboard templates

Executive Helpdesk and Operations Dashboard

When support data lives alongside CRM data, you can answer harder questions than "how many tickets did we close?" Which customer segments generate the most support volume? Which product lines have the highest defect rates? Where are you spending support resources on accounts already at churn risk?

KPIs typically tracked: First response time, resolution rate, SLA compliance, CSAT score, support volume by category, cost per ticket, ticket trend by product line, etc.

View helpdesk dashboard template
Executive helpdesk and operations dashboard showing tickets, SLA compliance, and CSAT trends

Every feature your executive dashboard needs. Already built in.

Real-time data. Always current.

Set your sync schedule once, hourly, daily, or real-time for supported connectors, and your dashboards stay current automatically. When someone asks you a number in a meeting, you open the dashboard knowing it reflects today.

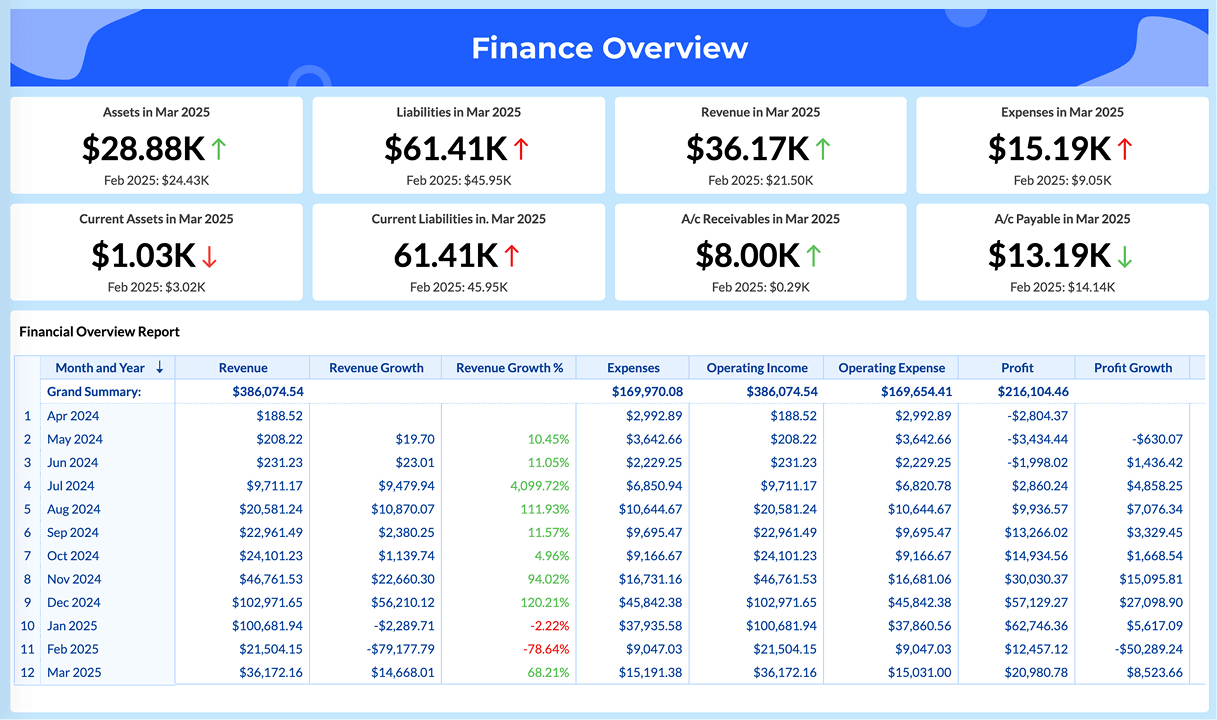
Blend data across tools without a data team

Zoho Analytics' data blending joins datasets from different sources, including CRM and finance, marketing and sales, or support and CRM, so you can answer cross-functional questions without a custom integration or a data engineer.

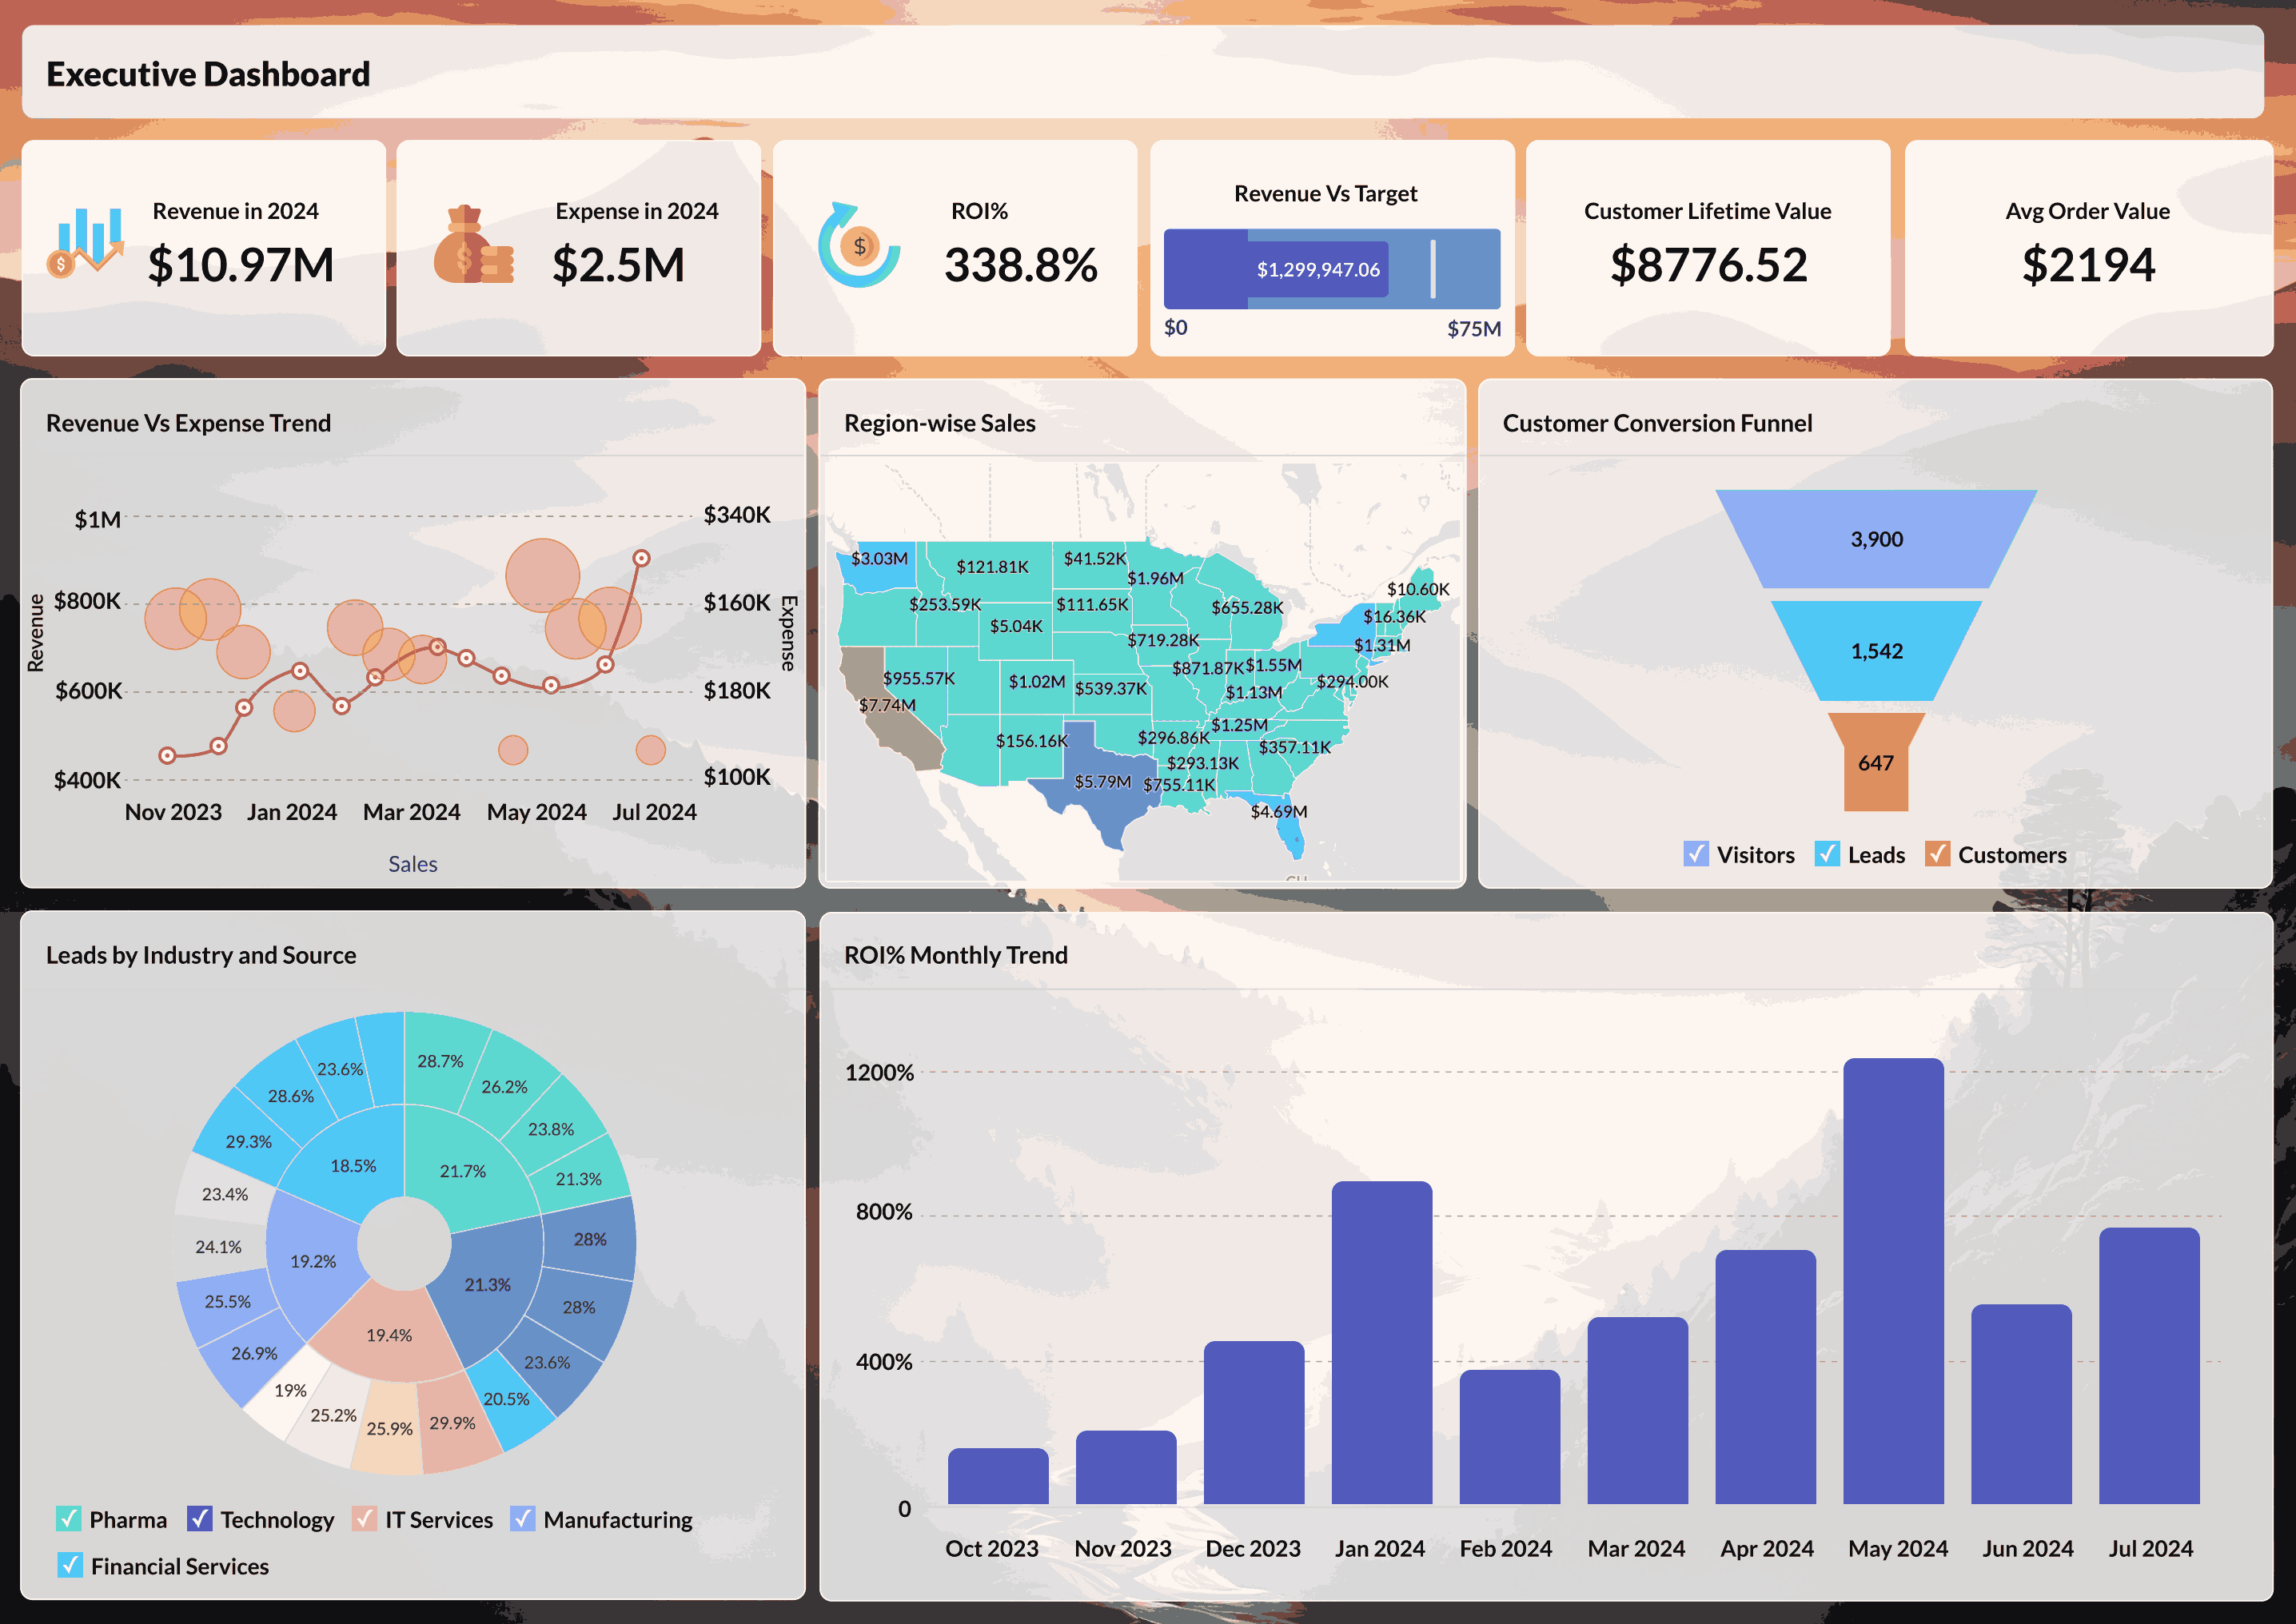
Drill down. Filter. Explore.

Every Zoho Analytics dashboard is interactive. Filter by region, date range, product line, or sales rep. Click a bar in a chart to see the underlying records. Compare this quarter to last year without rebuilding the report. The dashboard isn't a static image of your data.

Share and embed with precision

Share a secure link. Embed in your intranet. Schedule a PDF to leadership every Friday. Control exactly who can view, filter, or edit. Executives get a view tailored to them. Analysts keep the full working environment. Board members get read-only access without seeing anything proprietary.

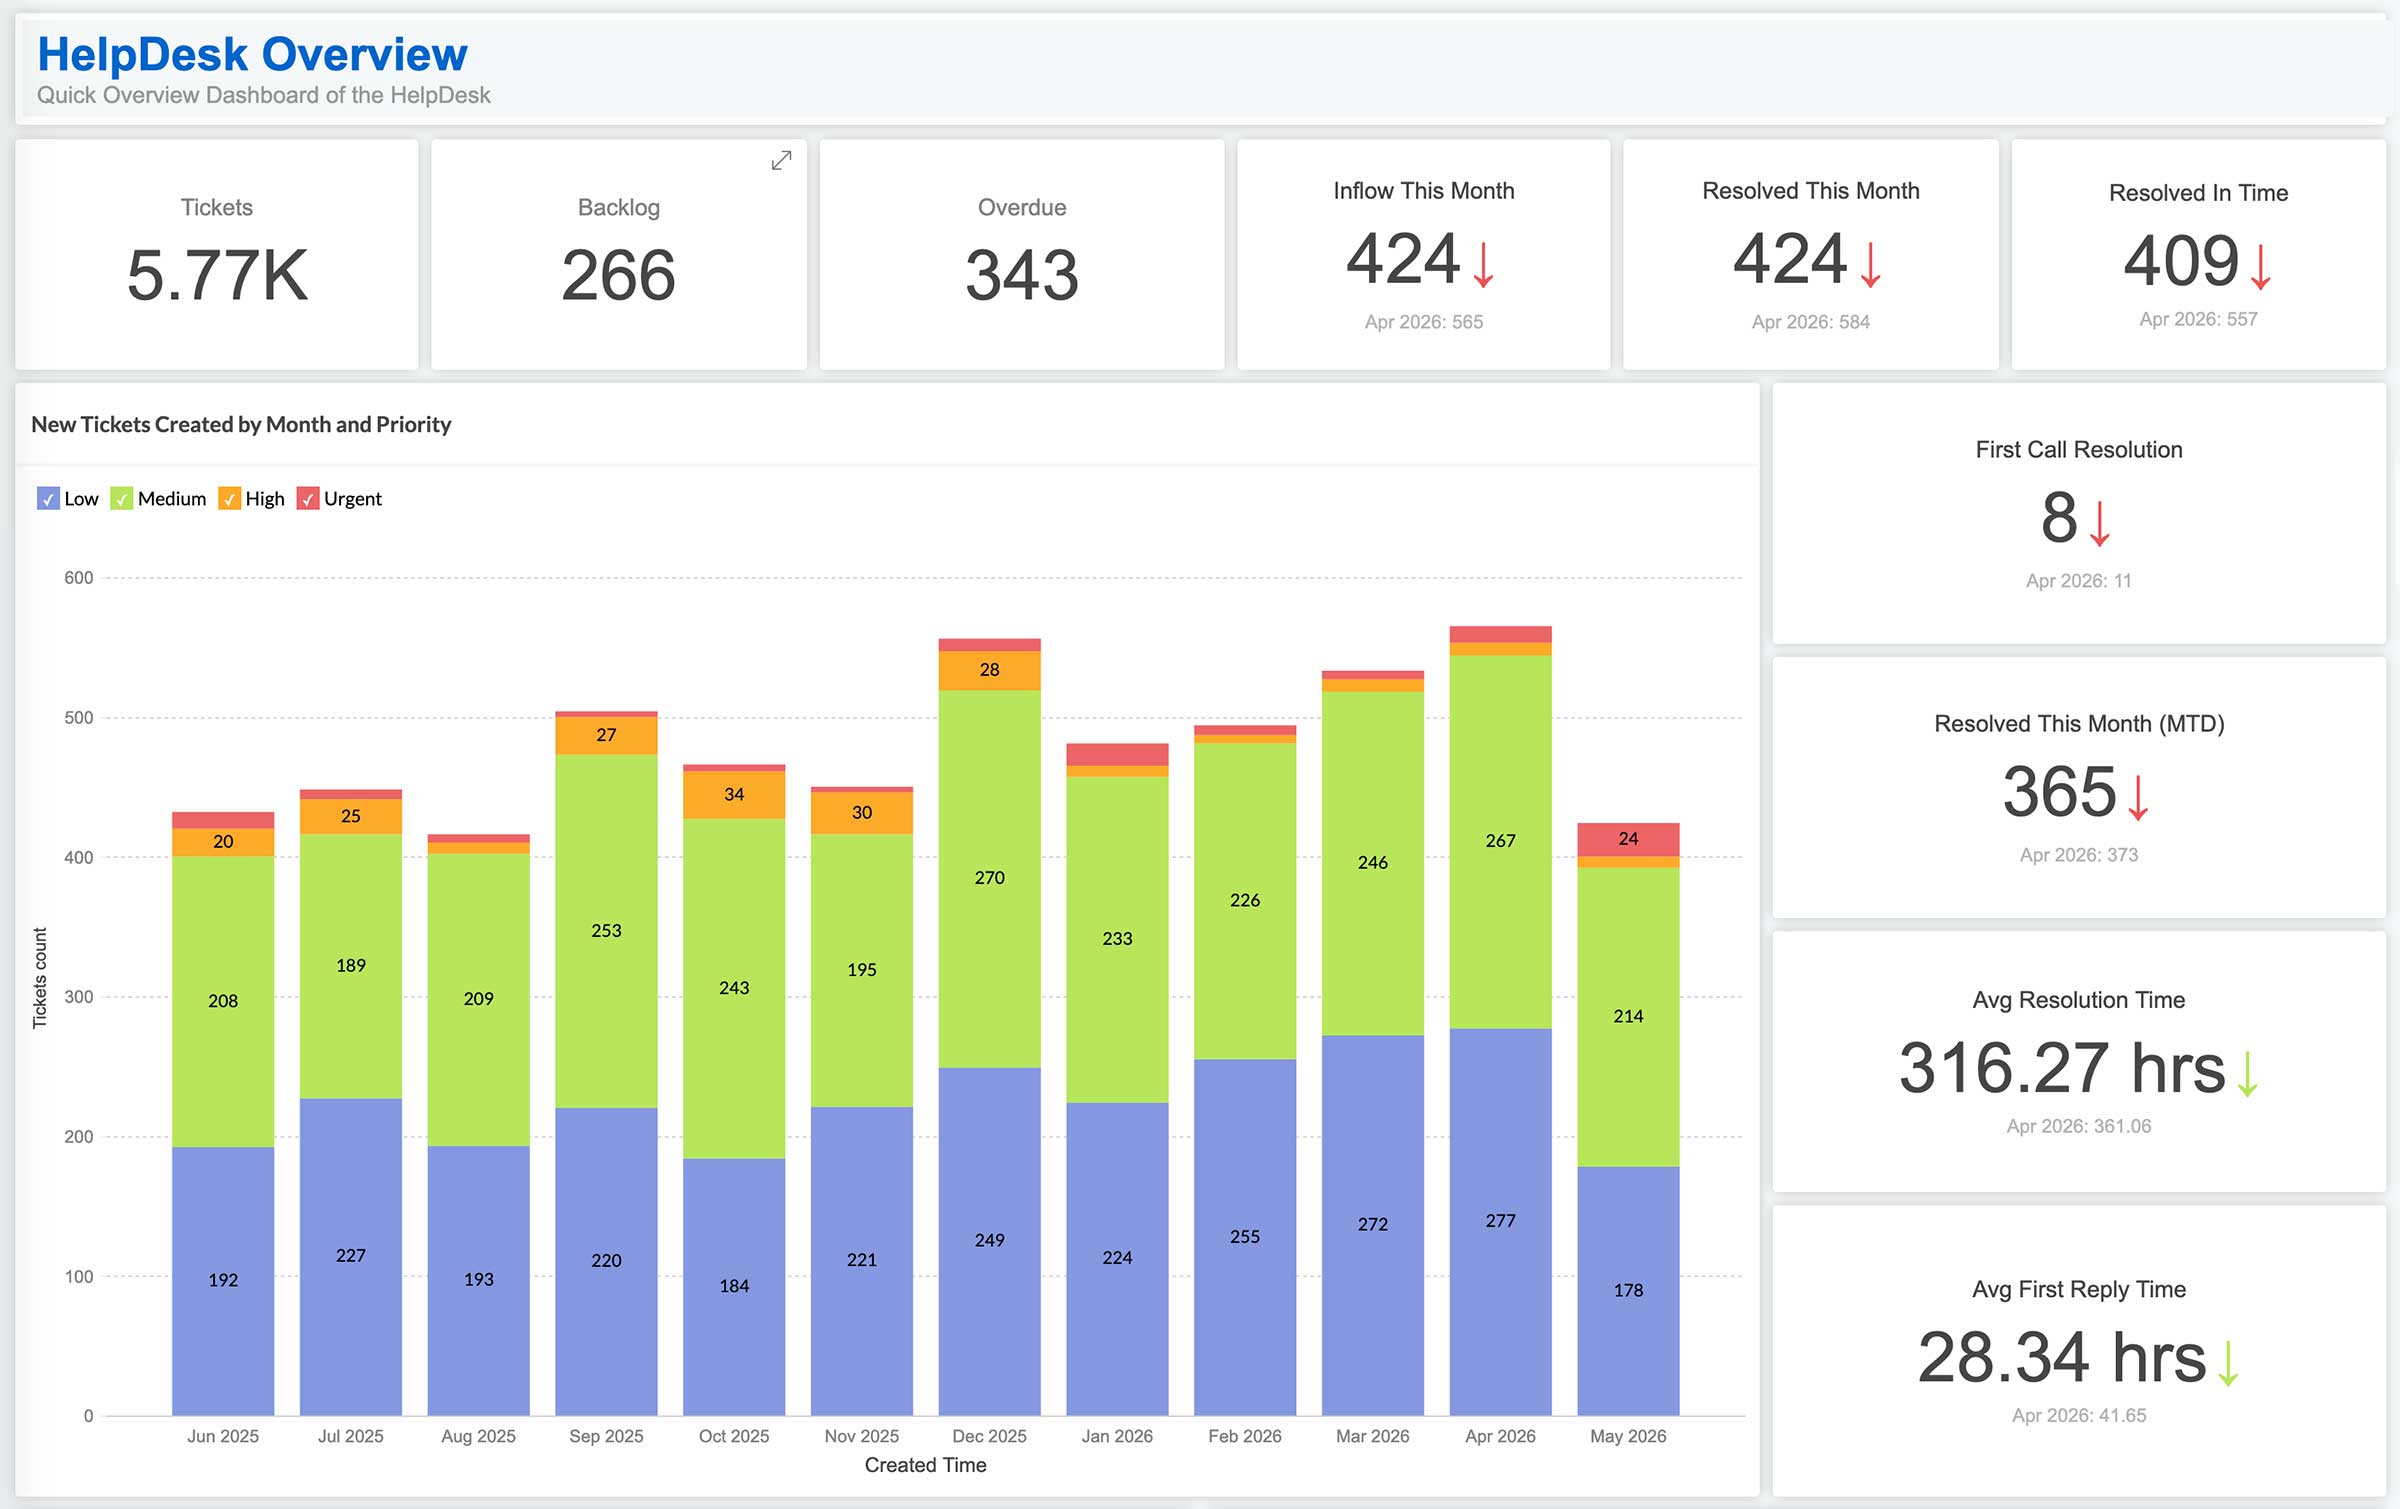
Mobile-ready dashboards for executives on the move

The Zoho Analytics Dashboards mobile app (iOS and Android) gives you full access wherever you are. Swipe through KPIs, drill into numbers, apply filters, and receive AI-generated alerts when a key metric crosses a threshold you've set.

Enterprise-grade security, without enterprise complexity

Role-based access controls, encryption in transit and at rest, audit trails, and compliance with GDPR, HIPAA, ISO 27001, and SOC 2 Type II. Data that executives should see stays accessible. Data they shouldn't see stays protected.

Hear what happy customers say about our finance dashboard software

See all testimonials
Connor Nobert, Director of Analytics and Technology at Pulse LLC
Connor Nobert
Director of Analytics and Technology, Pulse LLC

"Zoho Analytics gives us a superior edge over Power BI and Tableau, when it comes to the aesthetics of visualization. ‌We're very happy with Zoho's capability."

Steve Dubane, Founder & CEO of Wingman Media
Steve Dubane
Founder & CEO, Wingman Media

"Zoho Analytics created a tremendous amount of value for the agency and takes our relationship with clients to the next level. The preparedness to integrate the data, build alluring visualizations, and its shrewdness have given us the ability to retain clients.

Korvi Rakshand, Founder of JAAGO Foundation
Korvi Rakshand
Founder, JAAGO Foundation

"Our main intent was to make data-driven decisions. We use Zoho CRM and Zoho Books and we wanted to precisely analyze every single data point from these apps. So we fell back on Zoho Analytics. The visualization with data precision is impeccable and we are extremely happy with the Zoho suite of products."

ED Levis, Head of IT at NYC Navigator
ED Levis
Head of IT, NYC Navigator

"Data visualization is important for any BI tool. It's great to present data in a way that is meaningful to the audience, helping them quickly grasp the content. That's where Zoho Analytics is very strong. We now analyze our sales, operations, and finance using Zoho Analytics."

Daniel Franey, Director & Shareholder at Courier logistics limited
Daniel Franey
Director & Shareholder, Courier logistics limited

"With Zoho Analytics, the ability to visualize things became easy. Most of my managers now use Zoho dashboards and quickly create reports themselves. Its usability features, like easy drag and drop filters and drill down options, are top-notch."

Ben Smith, Advisor and former COO of Sugarfina
Ben Smith
Advisor and former COO of Sugarfina

"Zoho Analytics is the only product with the right mix of cost and value—with features like data visualization, integration, data blending, collaboration, user filters, drag and drop, geomaps, and much more at an affordable price"

Maurizio Pisana, IT Manager at Caffe Moak
Maurizio Pisana
IT Manager, Caffe Moak

"Zoho Analytics—being fast, simple, yet compelling BI software—made our lives easier for importing, integrating, and analyzing data. Visualization is another plus in this product, and dashboards are very appealing"

Build the executive dashboard you wish you had last quarter

Connect your first data source, pick a template, and see your business in one view before you need it.

Sign up for free

Finance dashboard FAQs

What is an executive dashboard?

  • An executive dashboard is a single-screen view of your business's most important KPIs, pulled from multiple data sources and updated automatically. It gives leadership a quick read on performance across sales, finance, marketing, and operations without digging through individual reports.

What should be in an executive dashboard?

  • The essentials are revenue vs. target, pipeline health, gross margin, CAC, and operational KPIs relevant to your business. The goal is breadth over depth, enough to spot what's off plan and know where to investigate further, all from one view.

How do I build an executive scorecard or report?

  • In Zoho Analytics, connect your data sources, pick a pre-built template, and it populates with your numbers instantly. You can also use the drag-and-drop builder or tell Ask Zia what you need, and it generates the full dashboard from a single prompt.

What are the leading executive dashboard software in 2026?

  • Zoho Analytics, Tableau, and Power BI are among the most widely used. Zoho Analytics stands out for combining depth, AI capabilities, and 500+ native connectors at a price point that works for both mid-market and enterprise teams.

How do executive dashboard software tools work?

  • Most dashboard software tools connect to your data sources, sync data on a schedule you set, and display it as live charts, KPI widgets, and tables. Executives can filter, drill down, and share views without touching the underlying data or waiting on a report to be built.

Can executive dashboard tools handle real-time data?

  • Yes. Zoho Analytics supports real-time sync for many connectors, with hourly and daily options for others. For most executive use cases, a daily sync is sufficient. For live operations or revenue-critical tracking, real-time is available and straightforward to configure.

What to look for in a CEO dashboard software for executives?

  • Prioritize breadth of data connectors, ease of use without technical help, cross-source data blending, mobile access, and flexible sharing controls. AI-powered querying is increasingly important, as it lets executives ask questions directly rather than waiting for someone to build a new report.