Working with Dashboard
Zoho Advanced Analytics offers a wide range of interactive options for dashboards when accessed by an end-user. The options include Viewing Underlying data, sorting, exporting, and printing. In this section, we will discuss each of the below-mentioned options in detail.
Interactions with Dashboards
Dashboards enable you to do exploratory analysis using immersive and interactive features. In this section, we are going to learn about the advanced interactive features such as View Underlying Data, Drill down and Change Chart Type.
Note: All these capabilities are available in the View Mode only.
View Underlying Data
Users of a dashboard can view the underlying data of a report in the dashboard.
To view the underlying data of a chart,
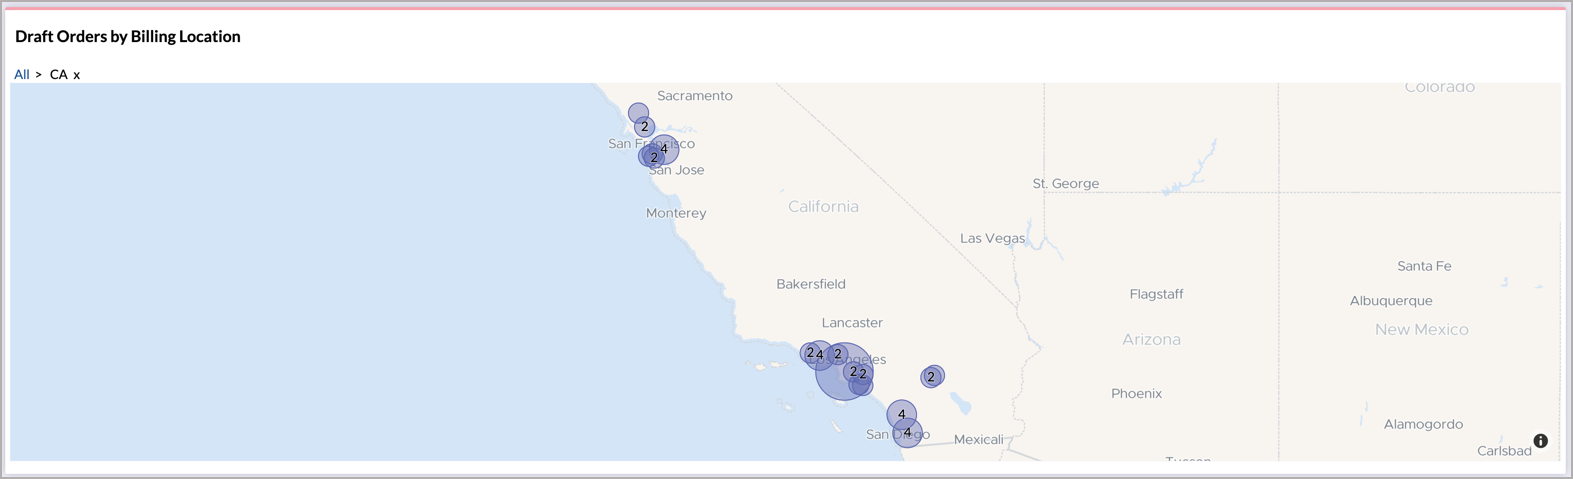
- Click the data point for which you wish to view the underlying data.
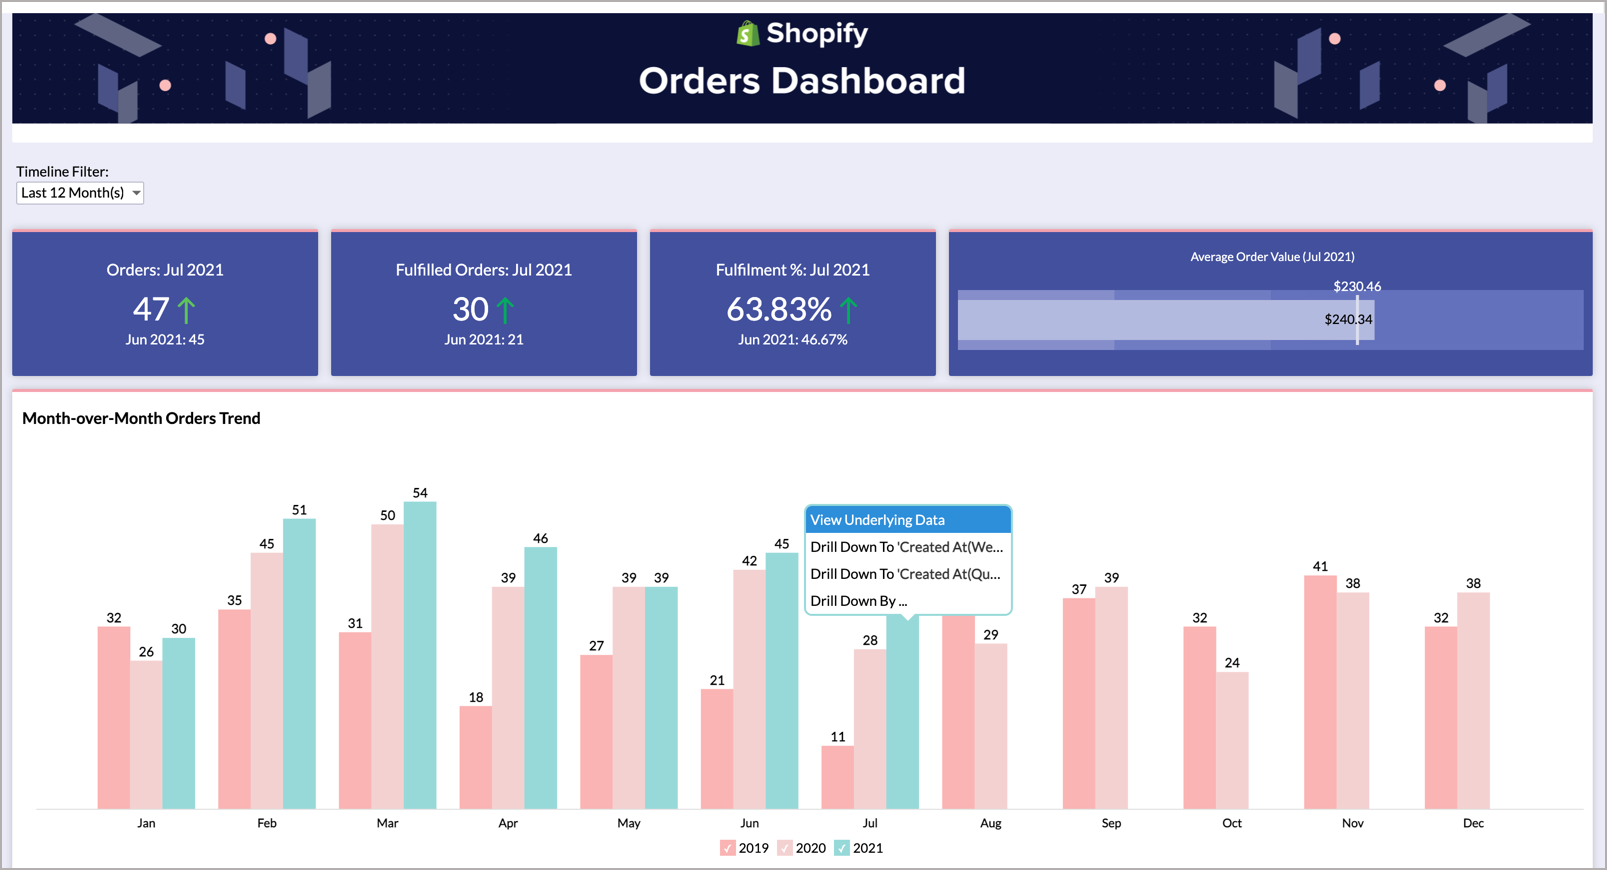
- Select View Underlying Data. The underlying data of the data point will be displayed as shown below.
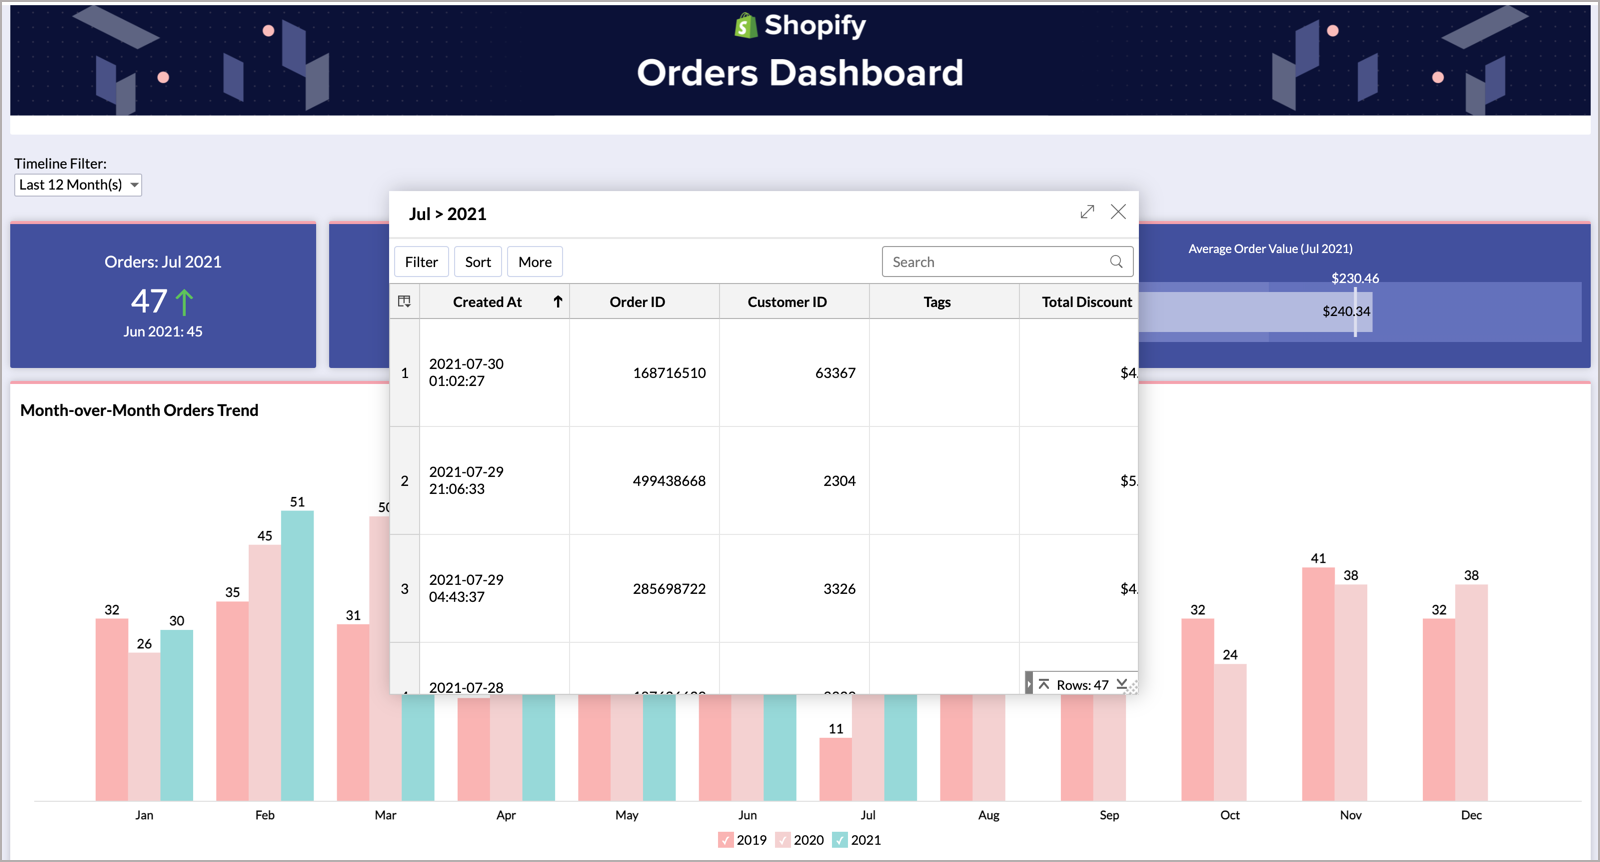


Alternatively, you can also view the entire underlying data of the report by clicking the More option and selecting View Underlying Data.

Drill Down
The Drill Down option allows you to perform powerful exploratory analysis. Using this feature, you can click on any data point in a chart and visualize the underlying data as a chart. You can either drill down using the path that is already set for the chart or choose from the list of compatible columns suggested by Zoho Advanced Analytics. Read more.
To drill down a chart,
- Click the data point that you wish to drill down.
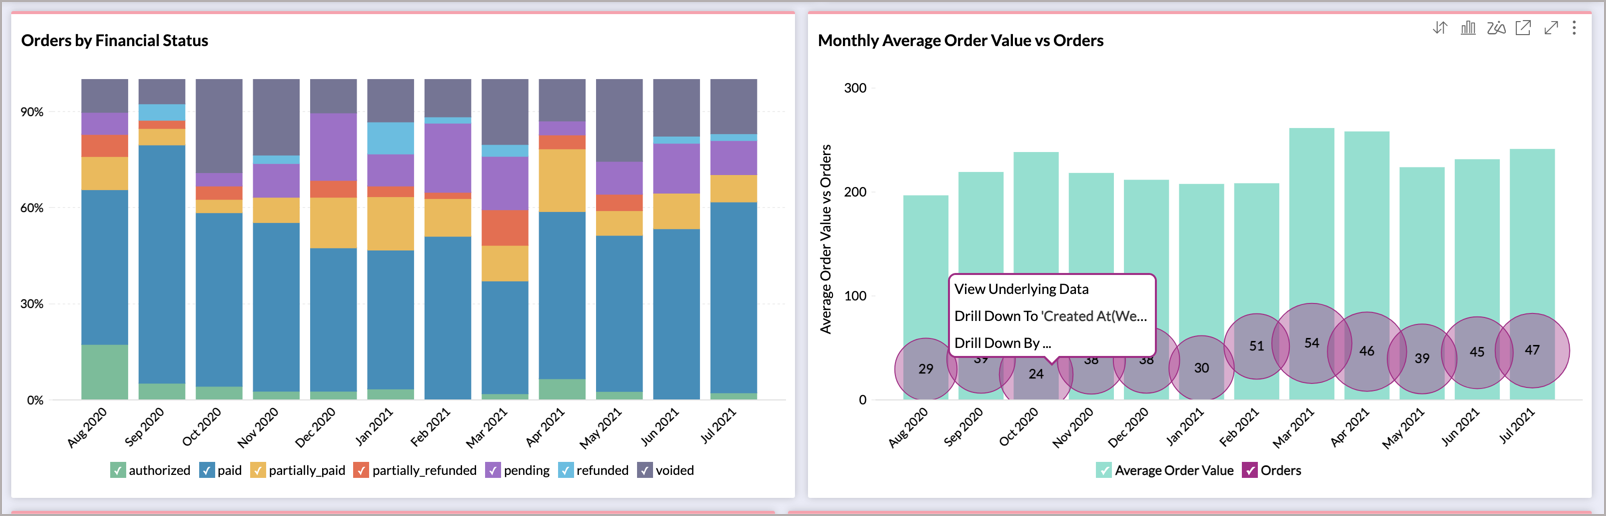
- Zoho Advanced Analytics offers two options to drill down - Drill Down and Drill Down By.
- Drill Down will only allow you to drill down the chart based on the column that is set as a drill down path while creating the chart.
- Drill Down By option will allow you to dynamically select a column from the wide list of columns that you can use to drill down the chart.

Let us see how to drill down a chart using the Drill Down By option.

- Select the column by which you wish to drill down.
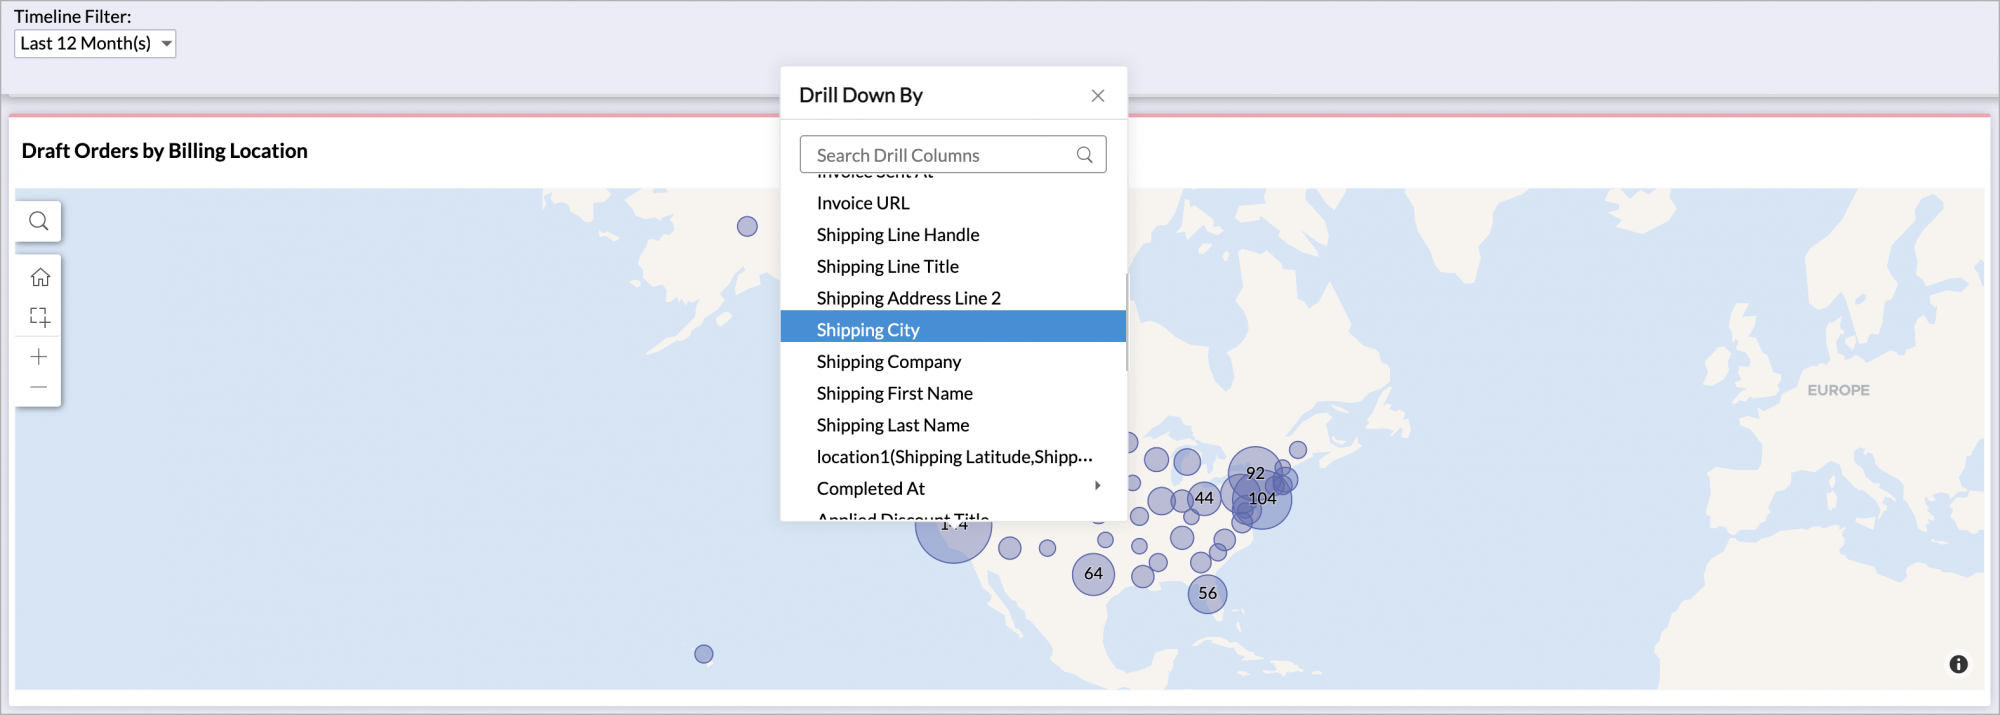
- The chart will get drilled down/get structured based on the path selected by you. The path will be displayed as a breadcrumb on the top.


Click to learn more about the drill down option.
Change Chart Type
Zoho Advanced Analytics allows you to visualize the chart that you have created using different chart type options. You can change the chart type of individual charts in a dashboard by clicking the Change Chart Type option. Please do note this is applicable only for a particular session and cannot be saved.

Maximize Embedded Report
You can maximize the embedded report to view in full dashboard layout by following the below steps.
- Click the Maximize icon in the top left corner of the report. You can also Double-click on the header to do the same.
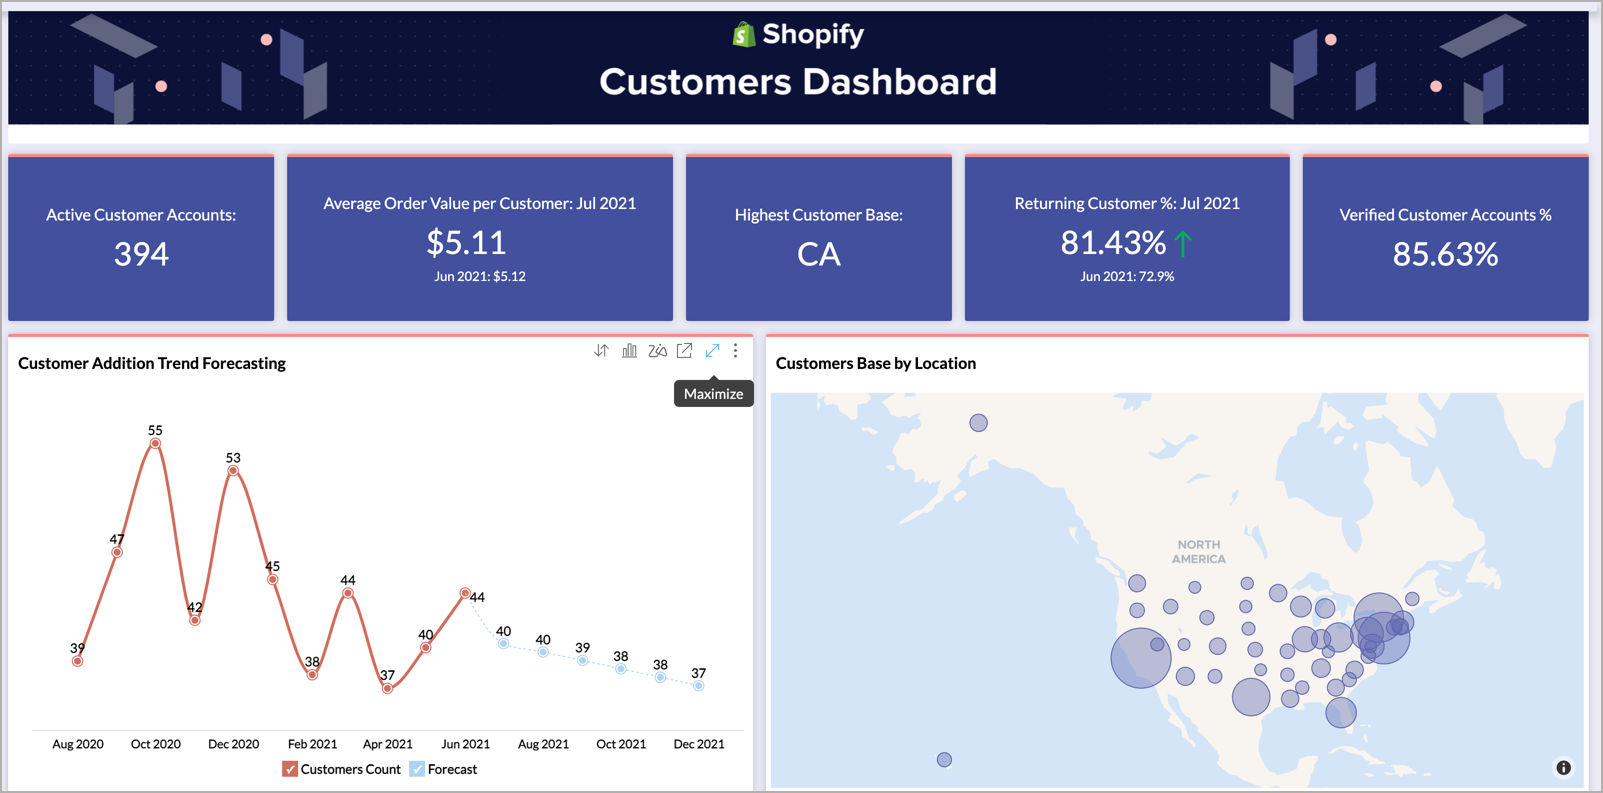
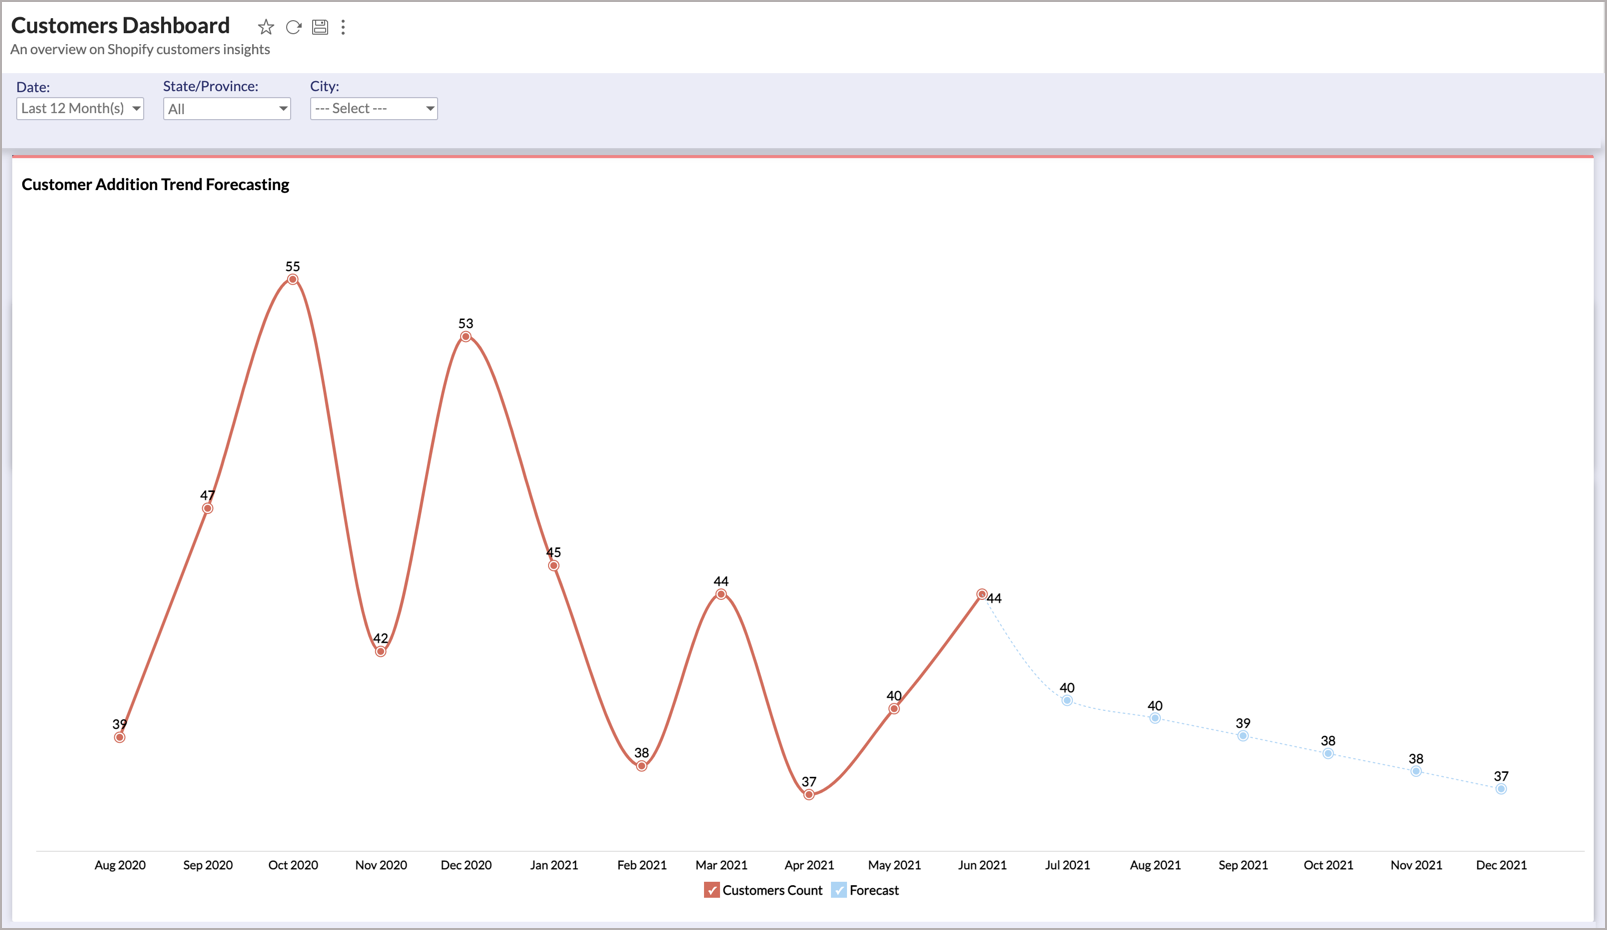
- The report will open in full dashboard layout. Rest of the components will be hidden, except the user filter. However, when you apply the user filter in this mode, it will be applied to all components in the dashboard.
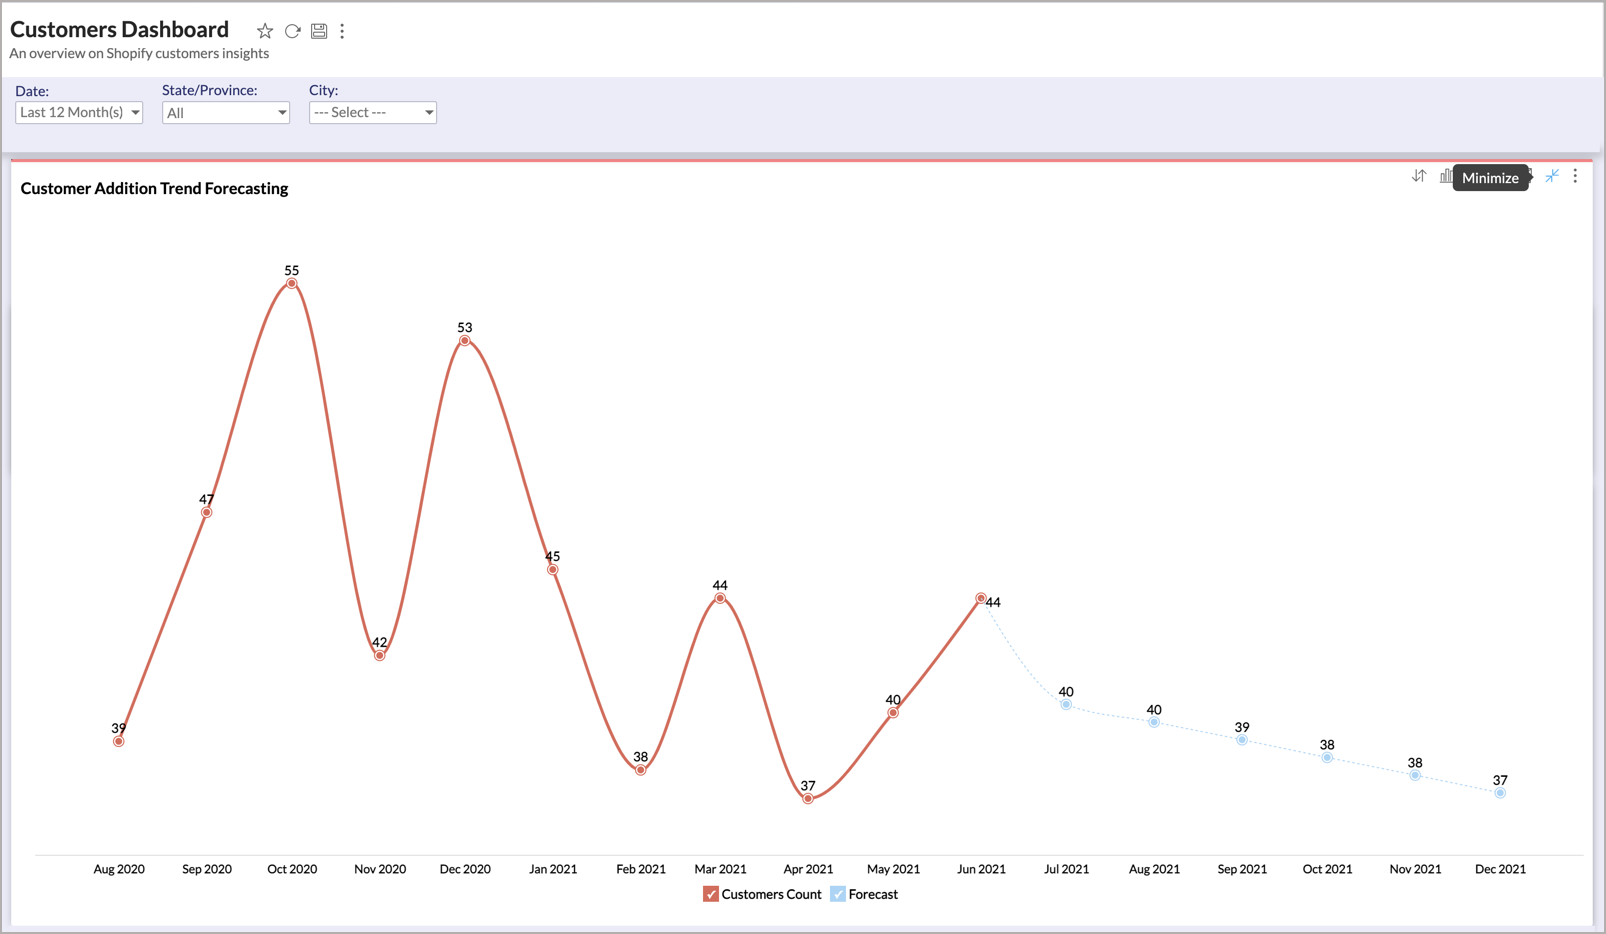
- Click Minimize icon to revert to the embedded size.


Exporting and Emailing Dashboards
Zoho Advanced Analytics offers exporting and emailing capabilities that enable you to view the dashboard when you work offline.
Exporting Dashboard
Zoho Advanced Analytics allows you to export your Dashboard as an HTML zip file or as a PDF.
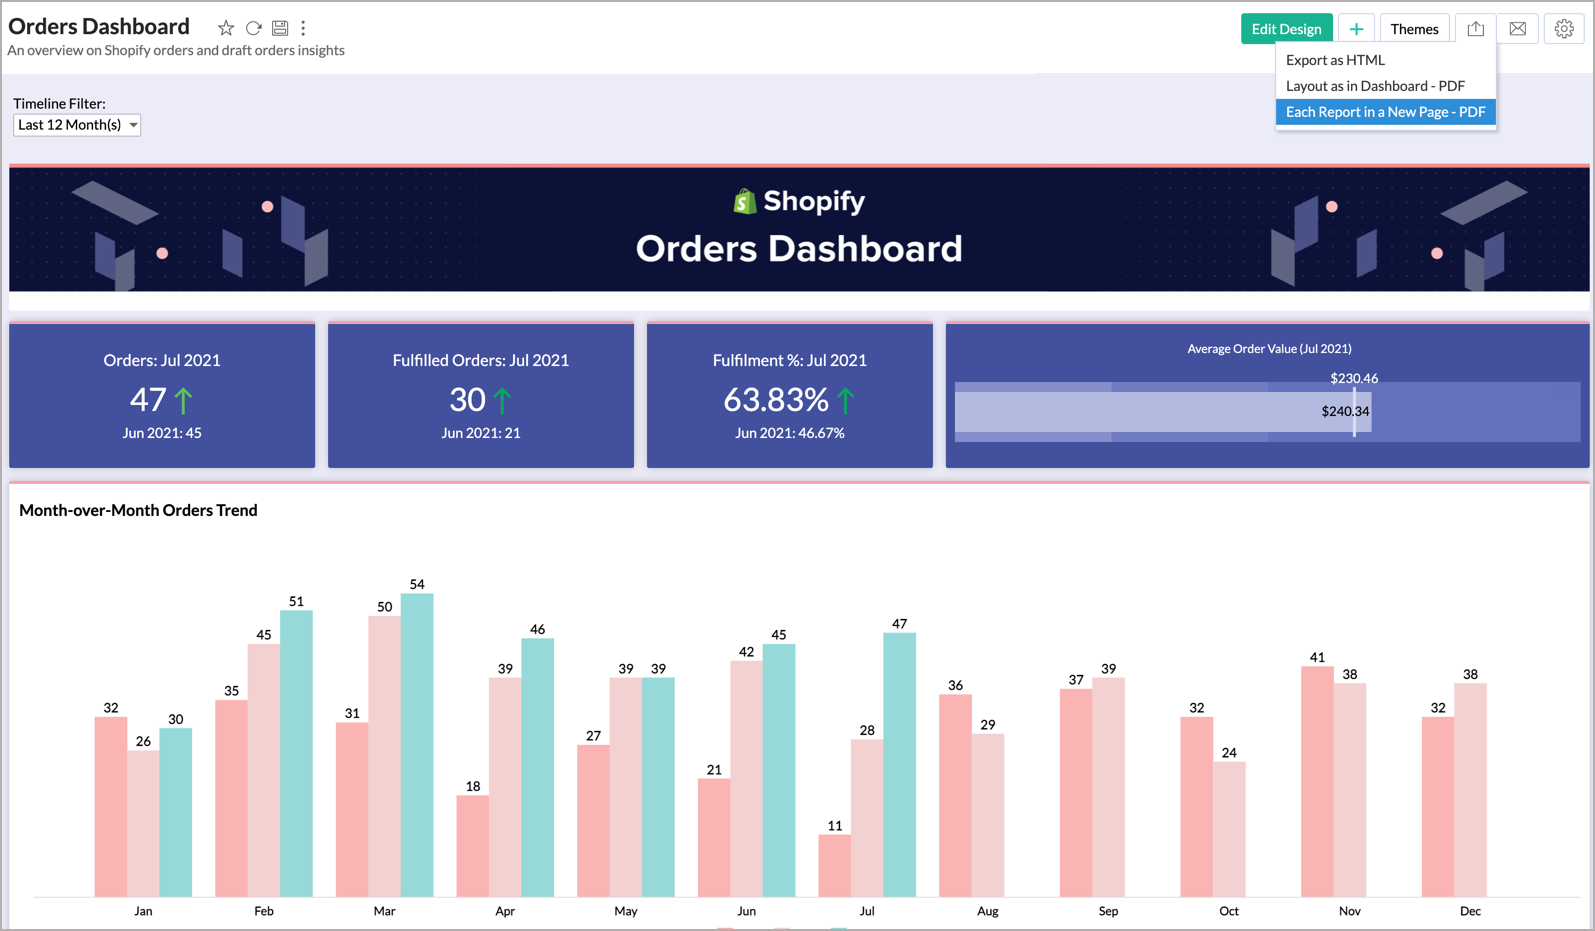
Export as HTML
Follow the steps given below to export a dashboard as HTML.
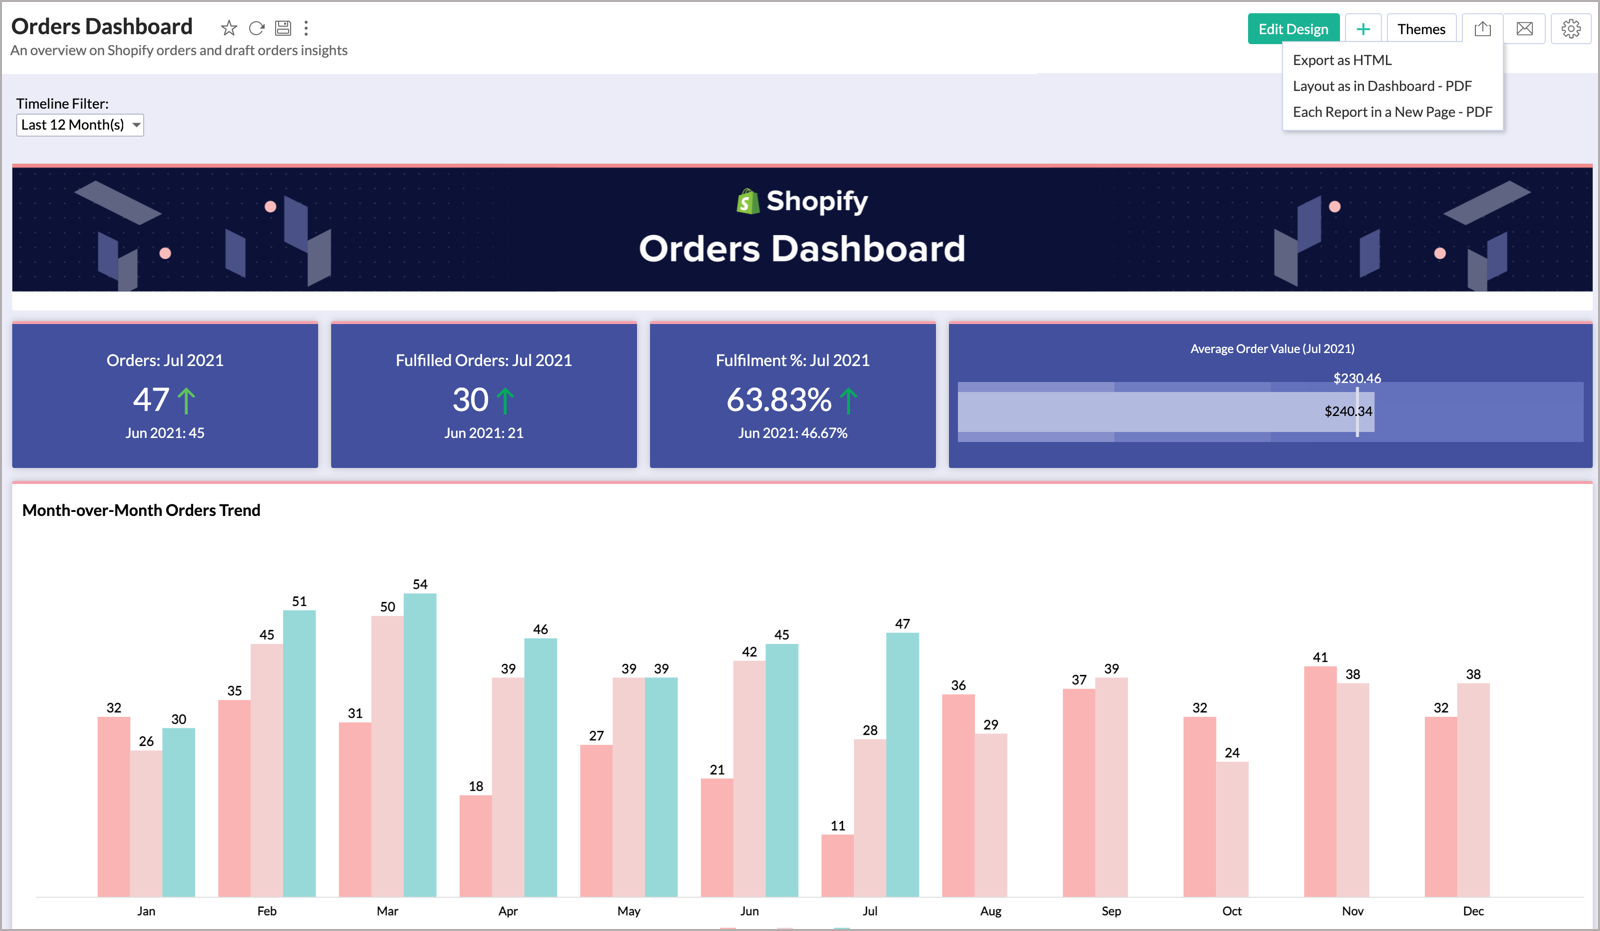
- Click the Export icon and then select Export as HTML.
- The ExportAs HTML : Settings page will open.
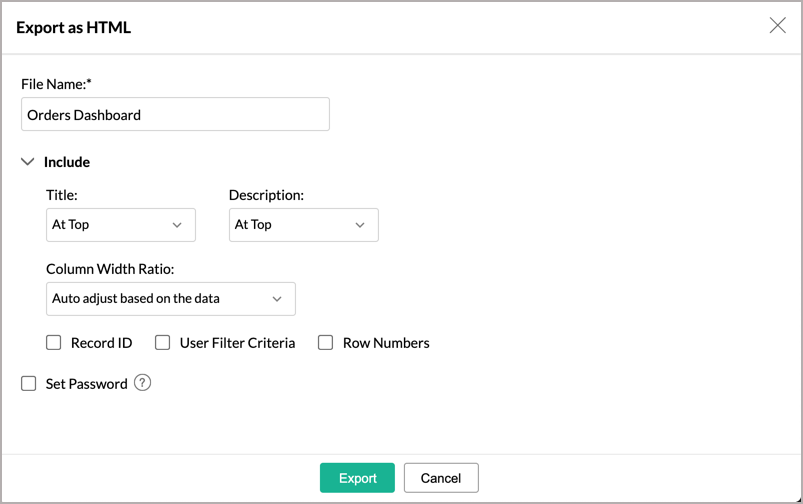
- Specify a name for the exported HTML file in the File Name field.
- Select required options to display title and description. The possible options to customize the layout of title and description are: At Top, At Bottom and None (without title or description correspondingly).
- Specify the Column Width Ratio for the table styles reports (pivot, summary, table etc.,) in your dashboard. Available options are:
- Auto adjust based on the data - Choose this to auto-adjust the width based on the data columns.
- Equal width for all columns - Choose this to have an equal width for all columns.
- Proportionate width as in the report - Choose this to set proportional column width based on the design of the original report.
- Select Record ID and Row Numbers option to add a label for user filter applied.
- Select User Filter Criteria option to add a label for user filter applied.
- Set Password to protect your exported file with a password to avoid any unwanted access. The exported file will be zipped and the specified password will be set.
- Click Export. Your dashboard will be exported into an HTML file.


Export as PDF
Zoho Advanced Analytics allows you to export the dashboard as PDF in two different layouts.
This option will export the dashboard in the same layout as arranged in the dashboard.
Note: This PDF export option is optimized for Dashboards containing charts and KPI widgets. Export may fail if it contains table styled reports, especially with huge data.
Follow the given steps to export with Layout as in Dashboard.
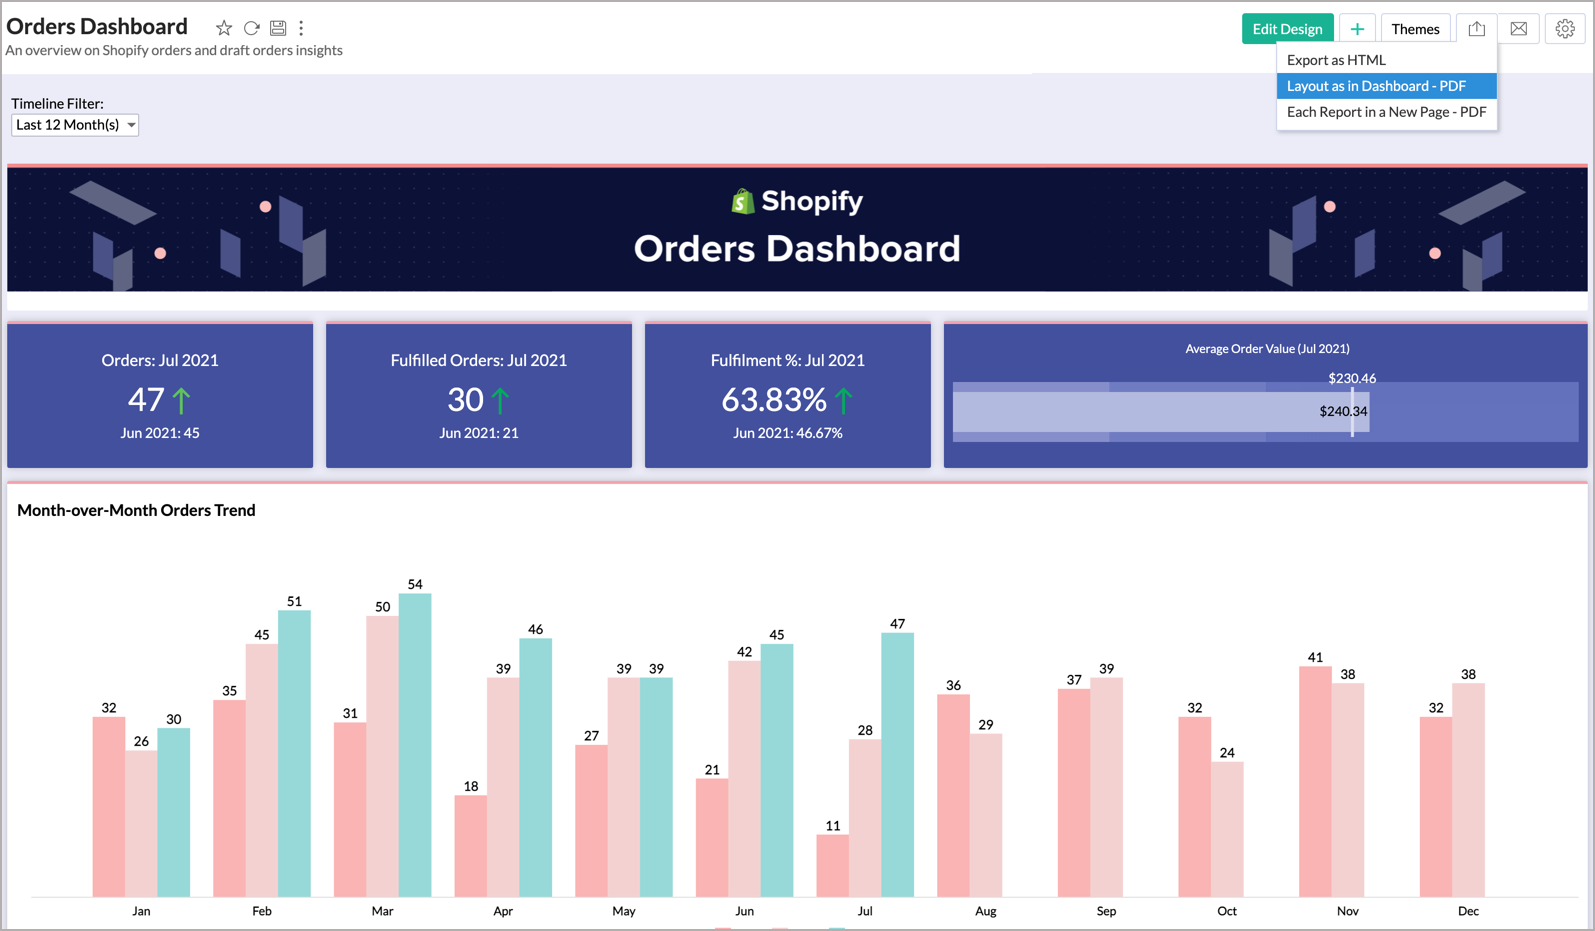
- Click the Export icon > Layout as in Dashboard - PDF.
- This opens the Export as PDF: Settings page as shown below.
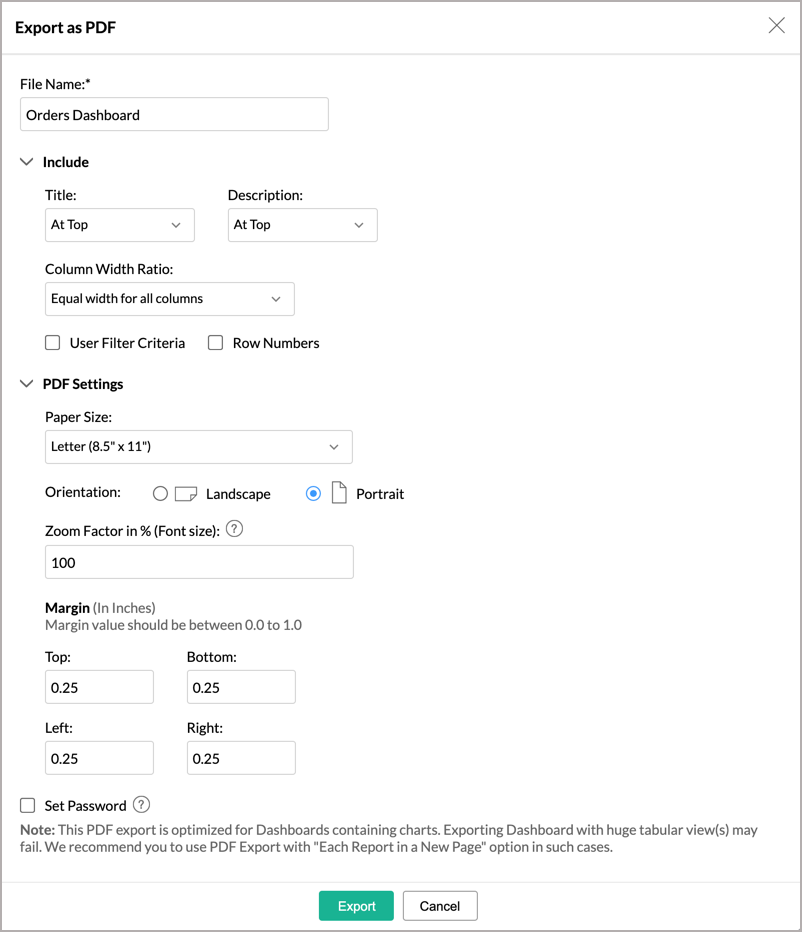


- Specify the files name in the File Name field.
- Set the paper size on the Paper Size option, in the Paper section.
- Set the orientation as Portrait or Landscape.
- In the Zoom Factor in %, specify a value in percentage to scale the font size in your dashboards to fit the page size appropriately. This could be scaled between 1 to 100%.
- Specify the Margin (in Inches). The margin value should be between 0.0 to 1.0.
- Select required options to display title and description. The possible options to customize the layout of title and description are: At Top, At Bottom and None (without title or description correspondingly).
- Specify the column width radio for the table styles reports (pivot, summary, table etc.,) in your dashboard. Available options are:
- Equal width for all columns - Choose this to have an equal width for all columns.
- Proportionate width as in the report - Choose this to set proportional column width based on the design of the original report.
- Select Show User Filter Criteria option to add a label for user filter applied.
- Click Export. Your dashboard will be exported into a PDF file with the layout as in dashboard.
This layout will export the dashboard in a single column layout displaying each report in a new page in the PDF.
This type provides the following benefits.
- Supports exporting dashboard containing tabular views with large data.
- Supports adding a Table of Content.
- Supports adding Header and Footer on each page.
- Supports customizing the language.
- Supports more file size for the exported PDF.
- Supports displaying filter criteria applied at the dashboard level and in the reports level.
Follow the given steps to export the dashboard with each report in a new page.
- Click the Export icon and then select Each Report in a New Page - PDF.
- This opens the Export as PDF: Settings page as shown below.


- Specify the files name on the File Name field.
- Select the Language.
- Set the paper size on the Paper Size option, in the Paper section.
- Set the Orientation as Portrait or Landscape.
- Select required options to display title and description. The possible options to customize the layout of title and description are: At Top, At Bottom and None (without title or description correspondingly).
- Select Show User Filter Criteria option to add a label for user filter applied.
- Select Generate TOC checkbox to include a table of content of your dashboard in the exported PDF file.
- Specify how to add KPI widgets in the exported file. Available options are.
- None - Select this to exclude the widget from the exported copy.
- Each in a New Page - Display each widget in a new page.
- Associate to Nearest Report - Display widget along with the nearest page.
- Specify the Margin (in Inches). Margin value should be between 0.0 to 1.0
- You can choose to add Header and Footer for this layout. There are three positions (Left, Right or Center) and you can choose to display one of the following in these positions.
- Blank - Displays nothing in this position
- Title - Displays the title of the file
- Date Time - Displays the date and time of export
- Page # - Displays the page number
- Page # of # - Displays the page number out of total pages
- Custom Text - Displays the custom text that is entered in the nearby field
- Logo - Displays the logo
- Click Export. Your dashboard will be exported into a PDF file with each report in a new page.
Export a Report
Apart from exporting the dashboard as a whole, Zoho Advanced Analytics also provides an option to export the individual reports in the dashboard.
To export a report,
- In the View Mode, select the More icon that appears on mouse over
- Select Export and choose the file type that you wish to export the report as.

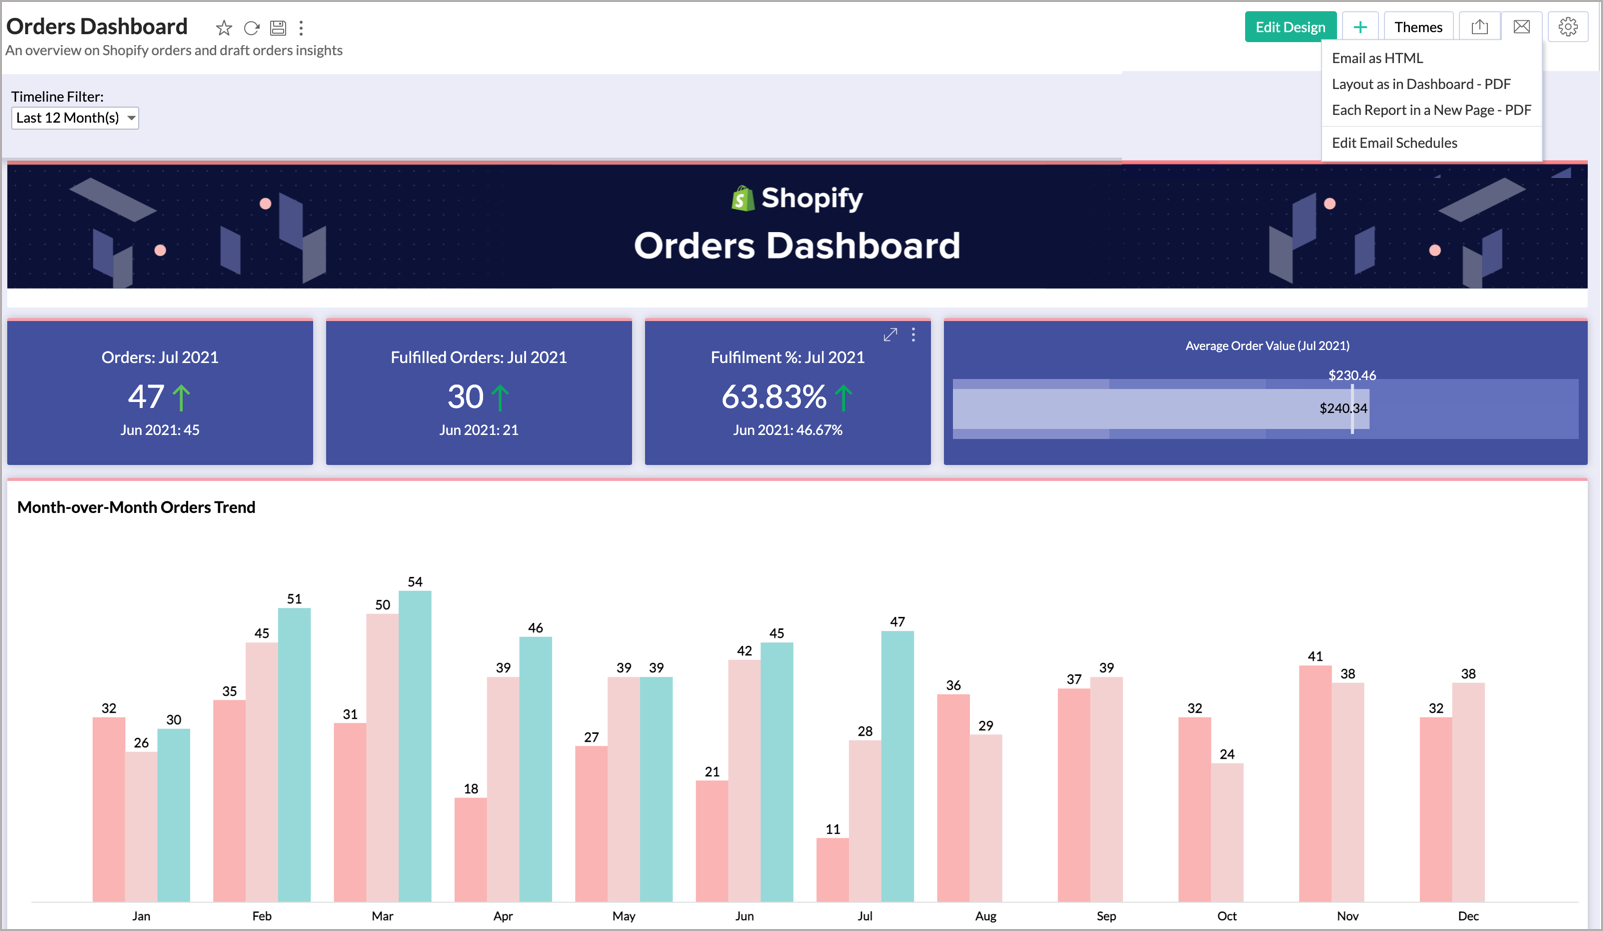
Emailing Dashboard
Zoho Advanced Analytics allows you to e-mail your dashboard to your colleague and clients. You can also schedule emailing your dashboards.
To e-mail your dashboard follow the given steps:
- Click the E-mail icon and select one of the following options.
- Email as HTML - Email the dashboard in HTML file format.
- Email as PDF - Email the dashboard in Portable Document Format (PDF) file format.
- E-mail tab provides various options to specify users email addresses and to customize your message.

- Specify the email addresses in the Enter E-Mail Addresses text box.
- Customize your e-mail subject and message using the Subject box and the Message box respectively.
- Specify whether the dashboard should be mailed As Inline Message or As Attachment in the Mode. This option is available only for emailing as HTML file.
- You can also schedule to send the exported copy at a recurring date and time using the Schedule this Email options.
- Click Send to send the report to the specified users.


Report Options will be similar to that of Exporting option. Read more.