Creating a Tabular View
A Tabular View as the name implies is a simple table-like report, that can be created with an intuitive drag and drop interface, over your data tables. With Tabular View, you can easily summarize, structure, group, filter, and customize data the way you want.
In this section, we will see how to create a Tabular View:
- Creating a Tabular View
- Applying Summary Functions on Columns
- Applying Filters
- Providing User Filters
- Adding Formula
Creating a Tabular View
You can create a Tabular View in Zoho Advanced Analytics by following the below steps:
- Open the workspace containing the data tables on which you want to create a Tabular View.
- Click Create > Tabular View.
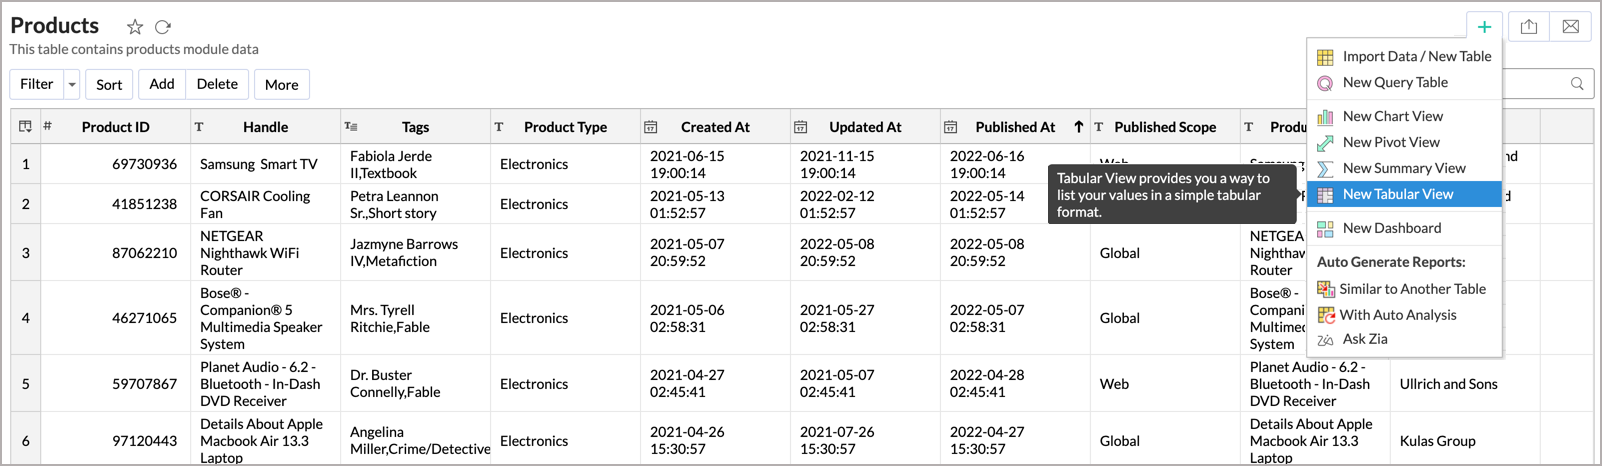
- In the Select Base Table dialog box, choose the data table on which you want to create the Tabular View and click OK. Alternatively, you can also create a new Tabular View by opening the corresponding data table and clicking the New > New Tabular View option in the toolbar.
- In the Tabular View Edit Design page that opens, drag and drop the columns from the Column List pane on the left to the corresponding shelves in the Design Area on the right.
You can also select the checkbox adjacent to each column to auto-place the columns into the appropriate shelves.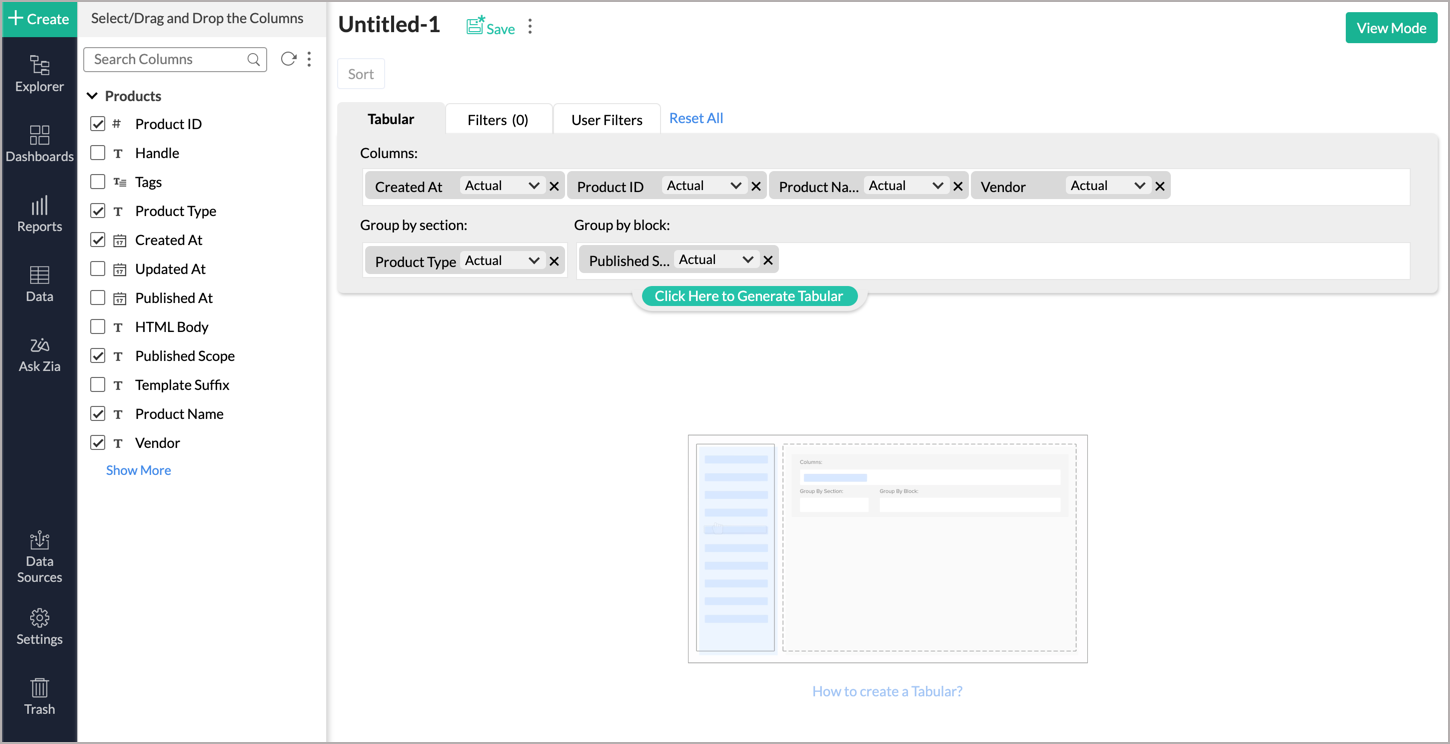
- Click Click Here to Generate Report.
- Once you have added the required data, click the Save button in the toolbar. In the Save As dialog box that appears, type a Name and Description for the tabular view and choose the folder where the view is to be saved.
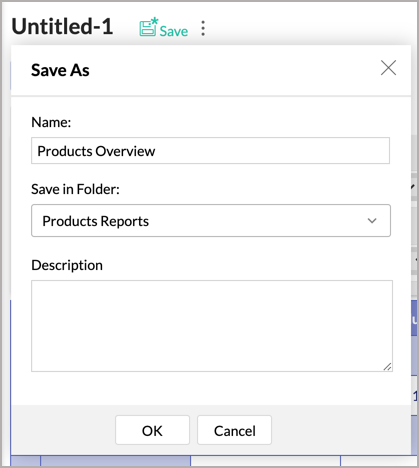
- Click OK.


A tabular view will be created and saved in your workspace. You can customize the look and feel of your tabular view using the various customization options available. Learn more.
About Shelves
The following is a brief description of each shelf in the Design Area of the Tabular View.
Columns: Data from the columns dropped in this shelf will be added as columns in the Tabular View. You can drop any number of columns in this shelf.
Group by section: Columns dropped in this shelf will be used to group the Tabular View into sections. You can only have one sectional grouping in a Tabular View.

Group by block: Columns dropped in this shelf will group your Tabular View data rows into blocks. When you add multiple columns, they will be displayed as categorized layers (a group within a group) of data horizontally.

We will understand about Tabular View shelves using an example. Let's look at how to create a Tabular View with groups and summaries from the Product data table like the one shown below.
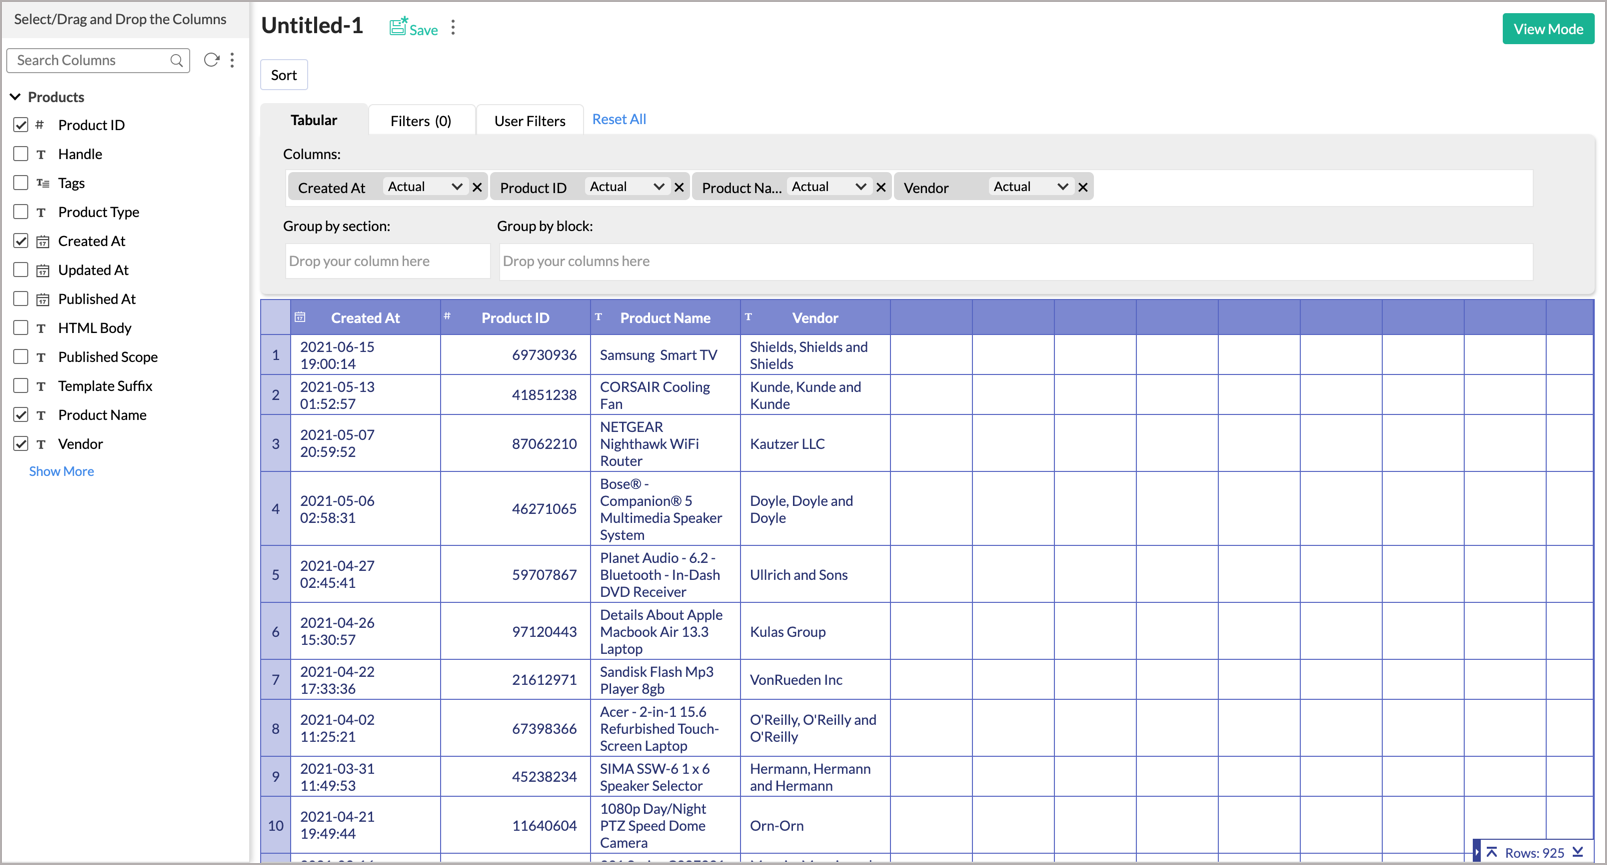
We will create a Tabular View to analyze the Products table. To do this, we will add the following data columns from the Products table into the Columns shelf with the corresponding function selected.
| Column Name | Function |
| Created At | Actual |
| Product ID | Actual |
| Product Name | Actual |
| Vendor | Actual |
The generated Tabular View will be displayed as below.
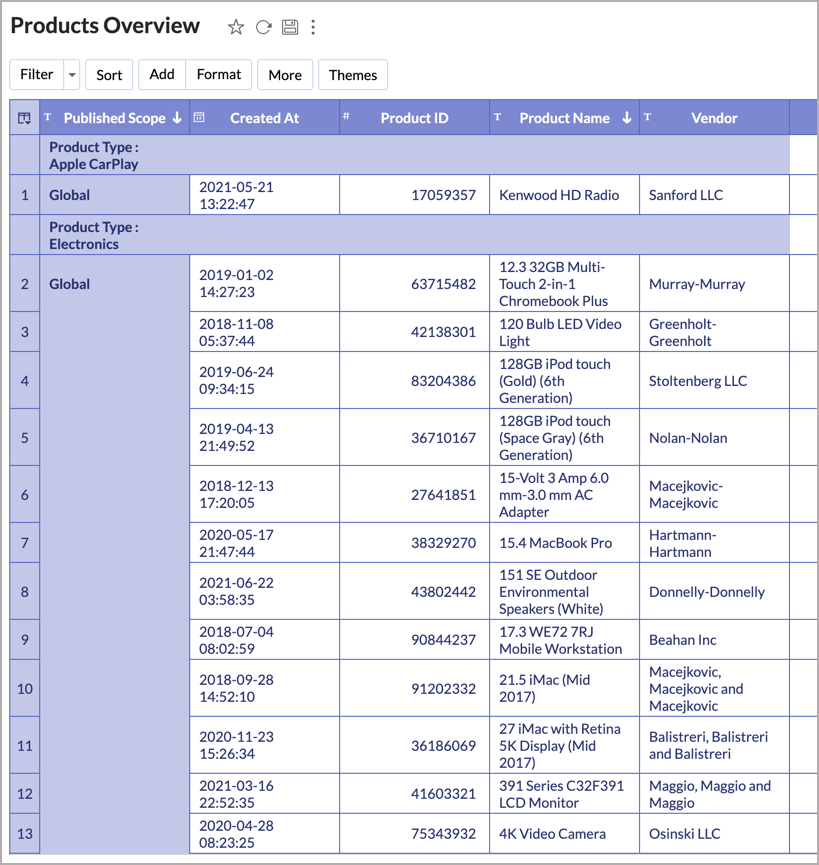
We will add further details to this table by grouping them into sections based on Product Type and blocks based on Published Scope. To do this, add Product Type to the Group by section shelf and Published Scope to the Group by block shelf and click the Click Here to Generate Report button.

Once you are satisfied with the generated Tabular View, provide a Name and Save the changes made. The final table will be as displayed below.
You have successfully created a Tabular View in Zoho Advanced Analytics. You can further add Filters, User Filters, and customize the created tabular view as required.
Applying Summary Functions on Columns
Zoho Advanced Analytics enables you to apply one or more summary functions to the columns in the Tabular View. When you apply a summary function over a column, a summary row for each group (block and section) and a grand summary row for the view will be displayed. Listed below are the sets of summary functions supported by Zoho Advanced Analytics for a tabular view and their functionalities.
| Numeric and Currency Data Type | |
| Function | Description |
| Sum | Returns the sum of all the values in the column. If the columns are grouped, summation will be applied at the group level. |
| Average | Returns arithmetic mean of all the values in the column. In case grouping has been applied, it will return the average value at the group level. |
| Count Records | Returns a count of the number of records in the column. If grouping is applied, it then provides the total number of records at the group level. |
| Min | Returns minimum value in the column. If the columns are grouped, then the minimum value will be applied at the group level. |
| Max | Returns maximum value in the column. If the columns are grouped, then the maximum value will be applied at group level. |
| Standard Deviation | Returns the standard deviation of the column. If the columns are grouped, then it will then display the standard deviation at the group level. |
| Variance | Returns the variance of the column. If the columns are grouped, then the function will be applied at the group level. |
| String Data Type | |
| Count Records | Returns the count of the number of records in the column. If grouping is applied, it then provides the total number of records at the group level. |
To apply summary functions:
- Drag and drop the required columns into the Columns/Group by block shelf.
- Click the Function drop-down from the dropped column and click the Show Summary option.
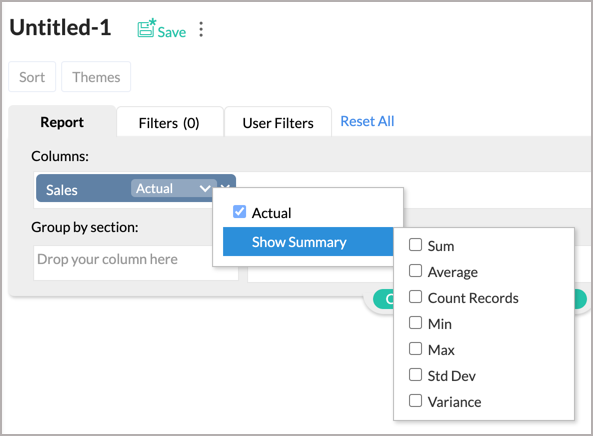
- You can choose from the displayed list of possible summary functions. You can also choose to apply multiple summary functions.Note: You can apply summary functions only over the columns dropped in Columns and Group by block shelf.
- Click the Click here to Generate Report link, after selecting the required summary function, to generate the report.

Applying Filters
Zoho Advanced Analytics allows you to filter a column for specific ranges, individual values, date ranges, and more, depending on the data type of the column. You can also apply multiple filters (based on multiple columns) in a Tabular View.
Here, we will filter the created Product Overview Tabular View to display only the data for 2019, 2020, and 2021. To do this:
- Click the Edit Design option in the toolbar.
- Click the Filters tab next to the Report tab in the Design Area.
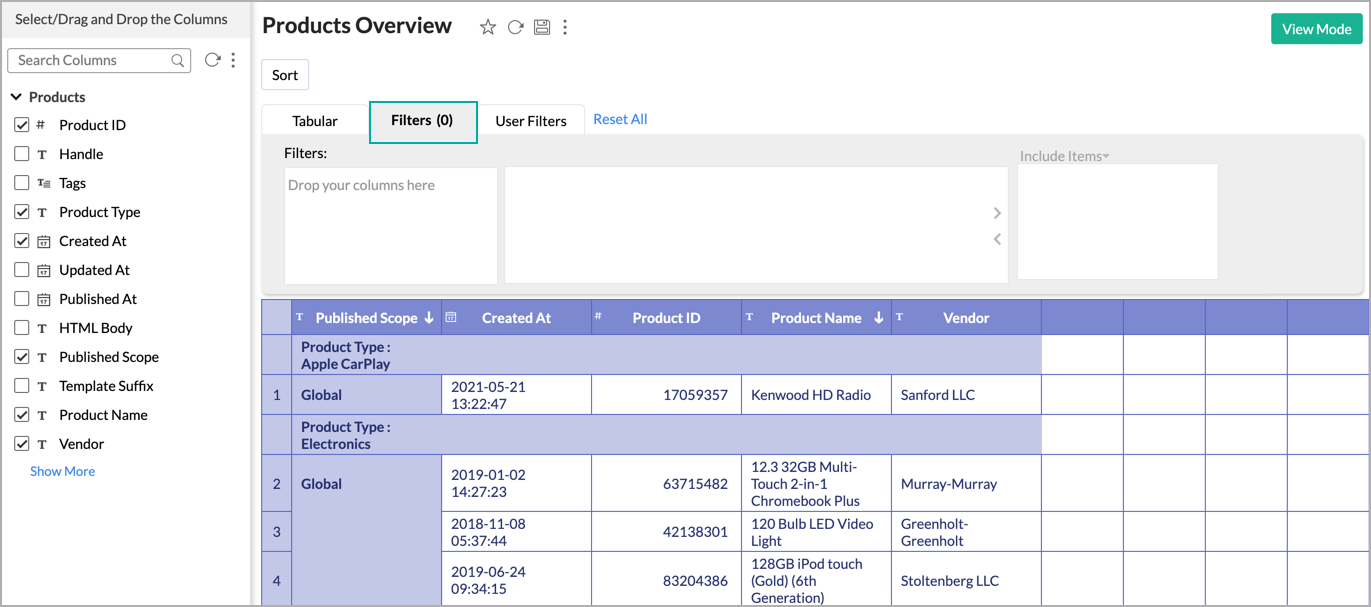
- Drag and drop the Created At column from the Column List pane on the left into the Filters shelf. Once a column is dropped, a list of all the possible options available for filtering the data will be displayed in the box next to the Filters shelf.
- Filtering options vary depending on the data type of the dropped column. After you have dropped the column, select one or more values to filter by. Here, we will filter to display data pertaining to the years 2019, 2020, and 2021. The selected filter items will appear in the third box on the right.
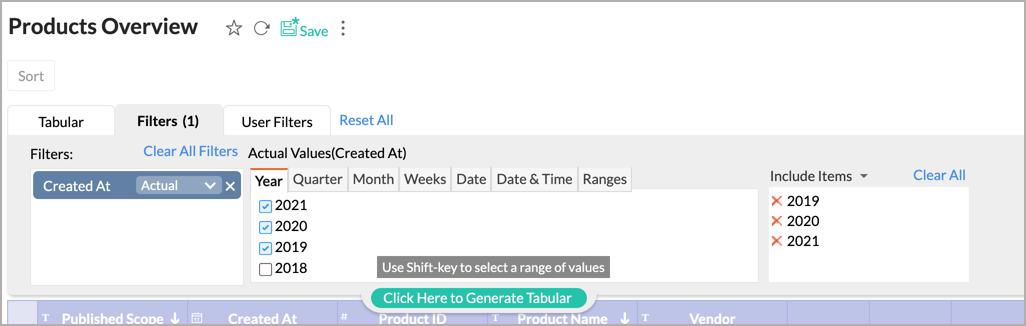
- Click the Click Here to Generate Report button.


As shown in the below screenshot, data that matches the applied filter will be displayed. You can view the generated Tabular View by navigating to the View Mode.

Please note that the filtering options are the same for all types of reports that you create in Zoho Advanced Analytics namely charts, pivot table, summary views, and tabular views. Refer to Chart Filters to learn more.
Providing User Filters
Zoho Advanced Analytics also allows you to include dynamic filters, called User Filters. This enables your users who access the report to apply dynamic filters on the report data using the filter columns exposed as part of the User Filters. The filter columns included in User Filters can be displayed using a variety of display components, such as Drop Down boxes, Slider, and Date range chooser to suit your needs.
The steps to provide User Filters are the same for all types of reports that you create in the Zoho Advanced Analytics app. Learn more.
Adding Formula
Zoho Advanced Analytics allows you to define powerful formulas and derive custom metrics to meet your specific reporting requirements. This enables you to perform from simple calculations such as addition and subtraction to a complex calculations using built-in functions. The output of the formula adds a new column in the tabular view as well as add it as formula column in the underlying data table.
To create a formula column:
- Click the Add button > Formula Column.
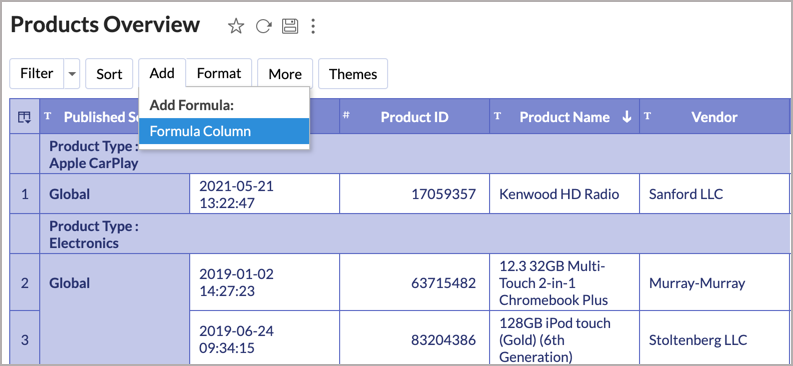
- In the Add Formula Column dialog that opens, type the formula you wish to create and click OK.

A new column using the specified formula will be added in the Tabular View.