Color Palettes in Zoho Advanced Analytics app
Color Palettes are a collection of colors that allow you to customize and beautify your charts. Zoho Advanced Analytics app offers you a wide variety of color palettes to choose from. You can also add your own color palettes to suit your reporting requirements. By default, when you create a chart, the colors assigned to your chart are those that are set in the Zoho Advanced Analytics app.
- What are color palettes?
- What are the color palette types supported in the Zoho Advanced Analytics app?
- How do I access the color palettes?
- How can I add a new color palette?
- Can I preview the new color palette?
- How do I set a default color palette for my Zoho Advanced Analytics app?
- How can I change the chart colors for all the charts in my Zoho Advanced Analytics app?
- Can I apply different colors for a chart?
- How do I edit a palette?
- Can I copy a palette?
- Can I delete a palette?
1. What are color palettes?
Color Palettes are a collection of colors that you can easily apply over your charts. Zoho Advanced Analytics app offers you a wide variety of predefined color palettes to choose from. You can also create your own palette where you can define a set of colors to be applied to your charts, instead of manually assigning chart colors every time.
2. What are the color palette types supported in the Zoho Advanced Analytics app?
Zoho Advanced Analytics app offers four types of color palettes. They are:
Solid Color
Solid Color is a collection of plain solid colors with a maximum of 32 colors in a palette. The Zoho Advanced Analytics Default palette will be selected and applied by default. You will find a wide variety of color palettes of solid colors to choose from.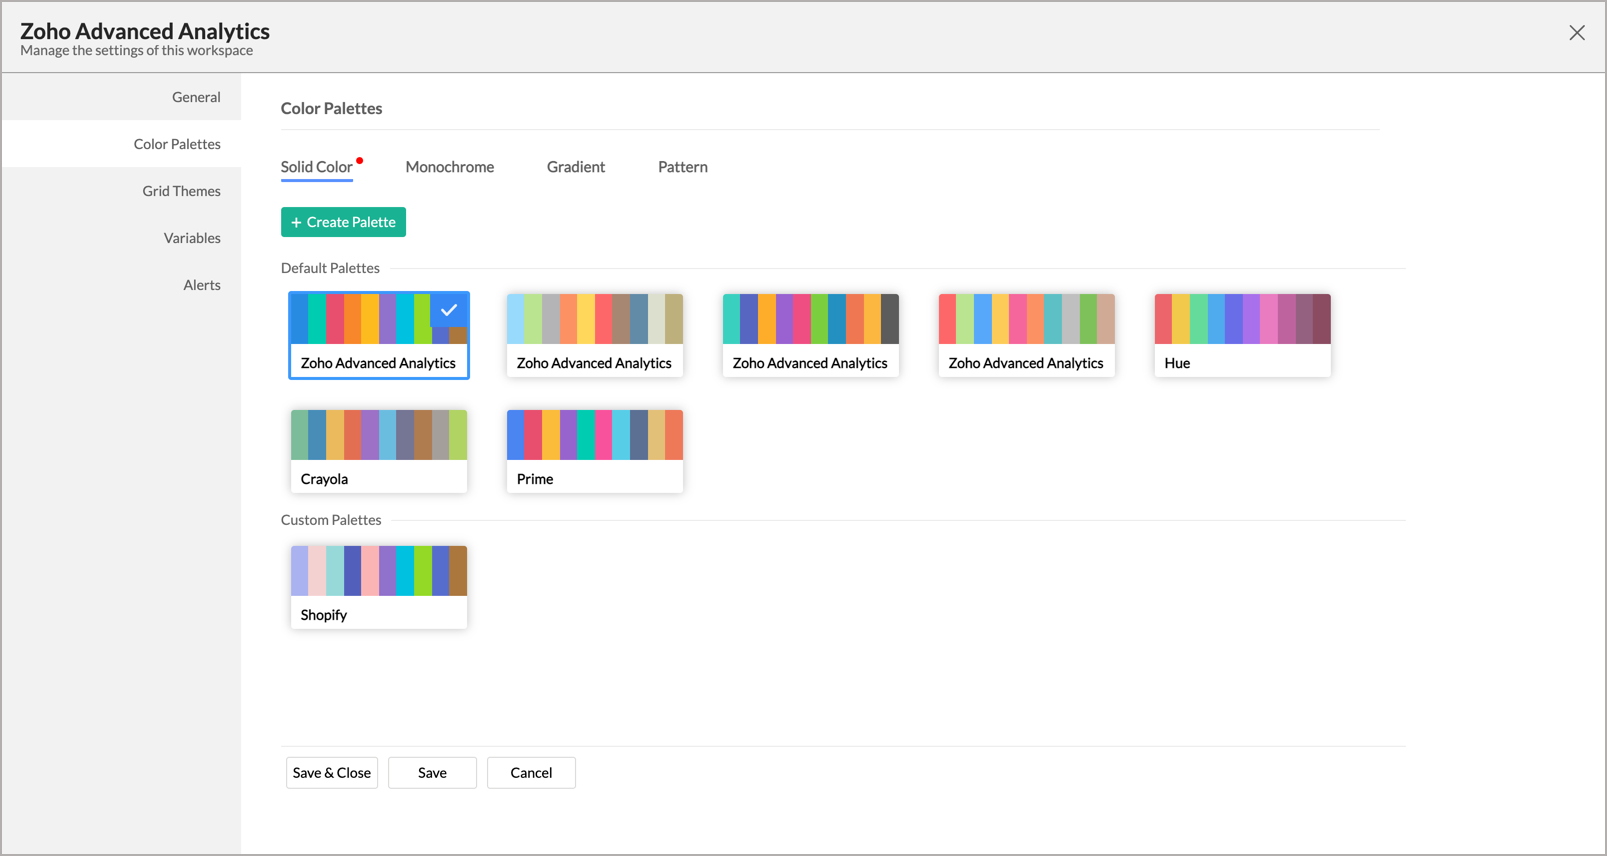
A report with a solid color palette applied.
Monochrome
Monochrome, as the name suggests, is the shade of a single color. The categories are differentiated by the tones and tints of the same color applied across the different cells in a chart.
A report with a monochrome color palette applied.
Gradient
The Gradient is a combination of multiple colors where transitions between one color and another are in a smooth fusion.
A report with Gradient color palette applied.
Pattern
Zoho Advanced Analytics app provides a pattern fill palette to enhance the visual appeal of the chart. This will be of immense benefit for users with difficulty in identifying colors.
Pattern palette supports the following types of Palette.
- Single Pattern Fill
- Multiple Pattern Fill with Single Color
- Multiple Pattern Fill with Multiple Color

A report with Pattern palette applied.
3. How do I access the color palettes?
You can access the color palettes from the Chart Palettes tab of the Settings page.
- From your home page, click the Settings from the left navigation bar.
- Open the Chart Colors tab.

You can customize the color palette or create your own palette from this page. When you create a chart, the set colors will be assigned to your chart.
4. How can I add a new color palette?
You can add your own color palettes from the Chart Colors tab of the Zoho Advanced Analytics Settings page.
Follow the below steps to create your color palette,
- From your home page, click Chart Colors.
- Select the Palette type. In this example, we will be creating a Solid Color palette.

- Click Create Palette. The Edit Palette dialog will open.
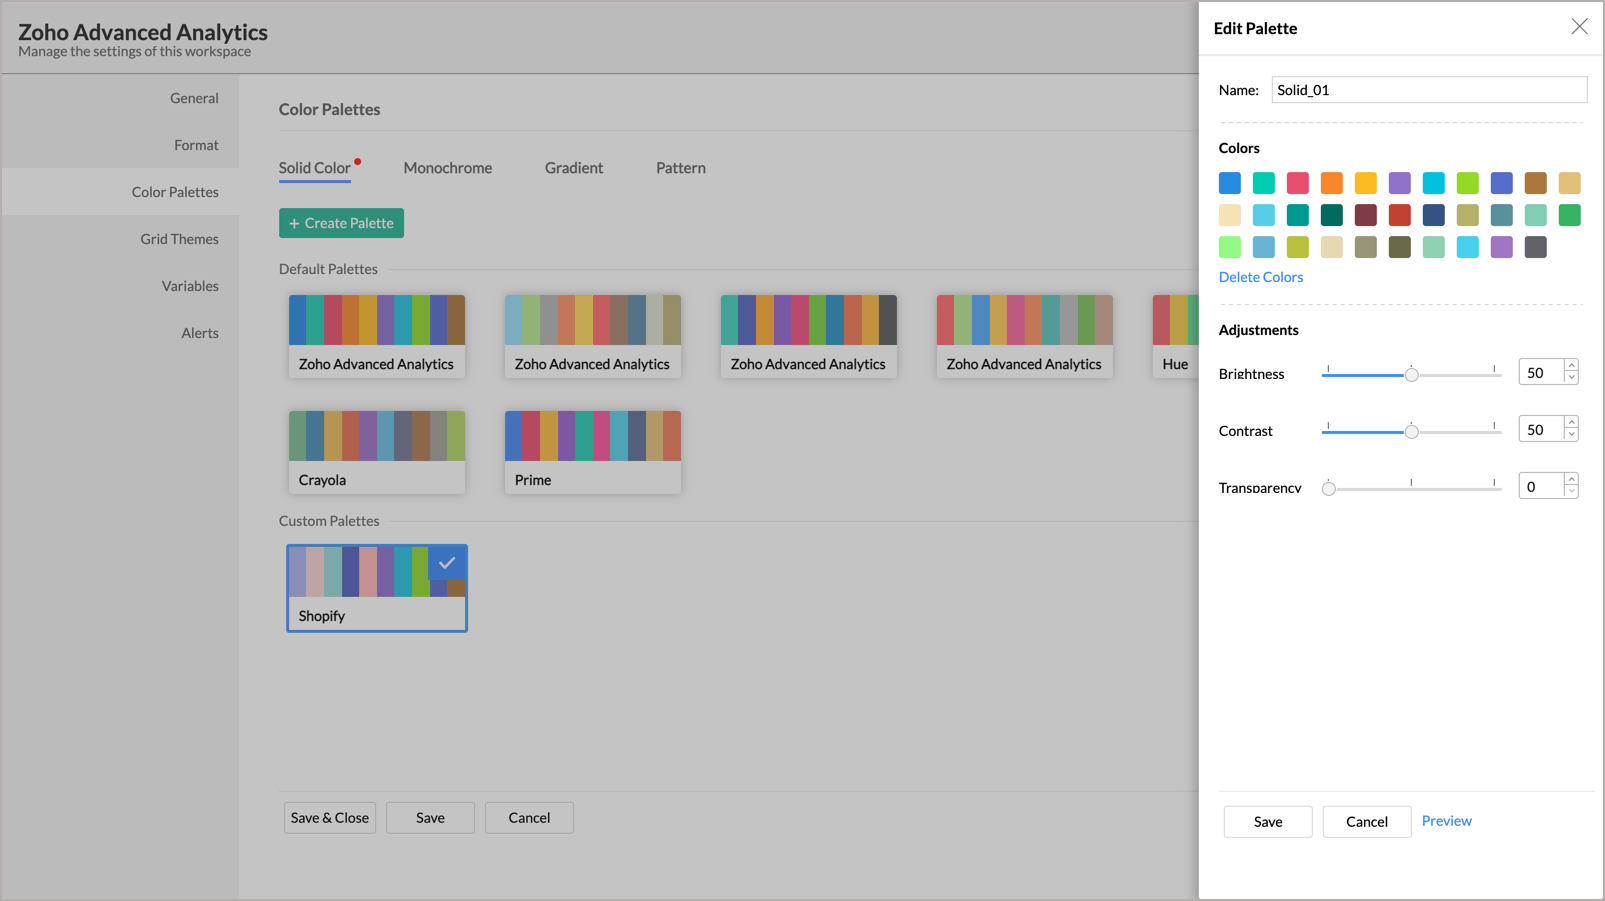
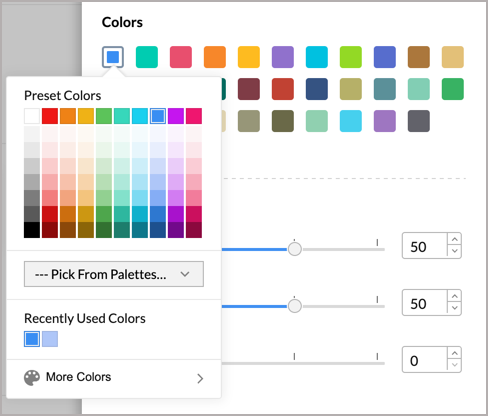
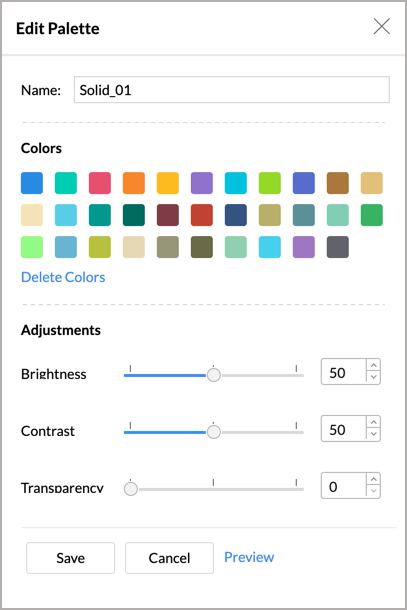
- Provide a Name for the palette.
- The Colors section will list the colors available in the Default palette of the Zoho Advanced Analytics app. Click on each color to replace them with the custom color you want. Colors in the palette will be picked in the same order listed here for your chart series.
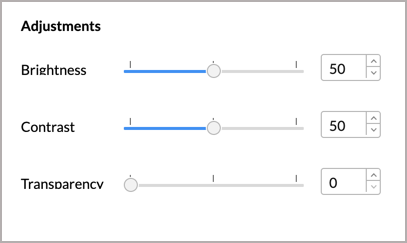
- In the Adjustment section, specify the Brightness, Contrast, and Transparency of the colors using the slider as shown in the below image.
- Once you have provided all the necessary settings, click the Save. The palette will be saved.


Monochrome
In the case of the Monochrome palette, you can choose to set darker to a lighter shade or lighter to a darker shade using the Reverse toggle button.
Gradient
In the case of the Gradient palette, you can modify the following settings:
- In the Color section, add more colors by clicking the + icon. You can add up to six colors.
- The Reverse toggle button allows you to reverse the start and end color order.
- The Merge Gradient toggle button allows you to specify whether the transition between the colors is in smooth fusion or various shades between the two values should be used as distinct colors.
This option will be available only for two-color gradient. Adding more colors will result in a smooth fusion gradient bar.
Pattern
For Pattern palette specify the following:
- Pattern Type - Select the Patten Type as Single Pattern or Multiple Pattern.
- Single Pattern - Same pattern fill will be applied with different colors.
- Multiple Pattern - Different patterns fill will be applied with single or multiple different colors.
- Pattern - This lists a variety of patterns as Grid, Stripes, Shapes, Dotted, etc., Select the desired pattern.
- Color Preview Tiles - All the palette designs will be listed as preview tiles. You can click each the preview tiles and customize them as you need. In case of a single color pattern, you can choose the patterns. For Multi color pattern, you can choose the color.
- Pattern Color - Select a color for the pattern.
- Background Color - Select a color for the pattern background. You can choose one of the Solid Color palettes or choose the individual color by clicking each preview tile.
In the case of Multiple Patterns, you can choose to select either a Single color or Multiple colors. - Swap Colors - This toggle button allows you to swap the Pattern Color and Background Color.
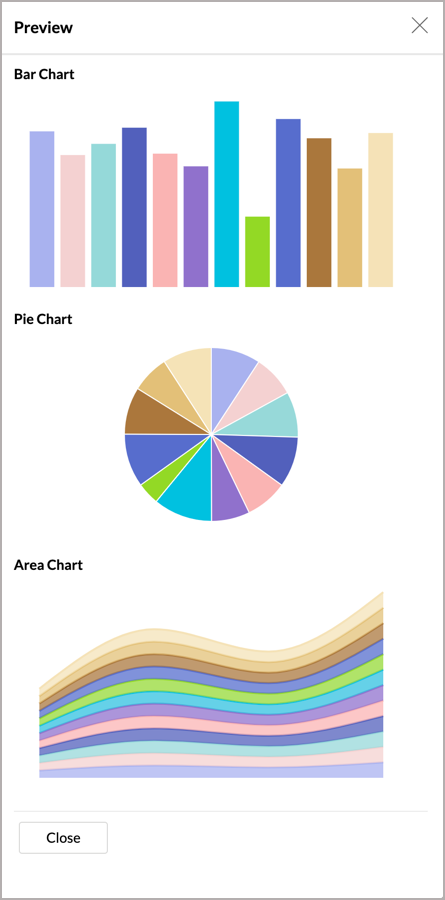
5. Can I preview the new color palette?
Yes, you can preview the color palette. Follow the below steps to preview the selected color palette over different chart types.
- Open the Chart Colors tab in the Zoho Advanced Analytics Settings page.
- Select the palette you want to
- Click the Action icon that appears on mouse-over and select Preview.
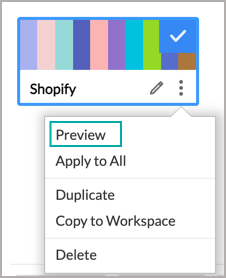
- The preview of the selected color palette on various chart types will be displayed.


6. How do I set a default color palette for my Zoho Advanced Analytics?
The Zoho Advanced Analytics app Default palette will be selected and applied by default. You can change the default palette by following the below steps:
- Open the Settings page.
- Click Chart Colors.
- Select the Palette that you want to make as the default palette.
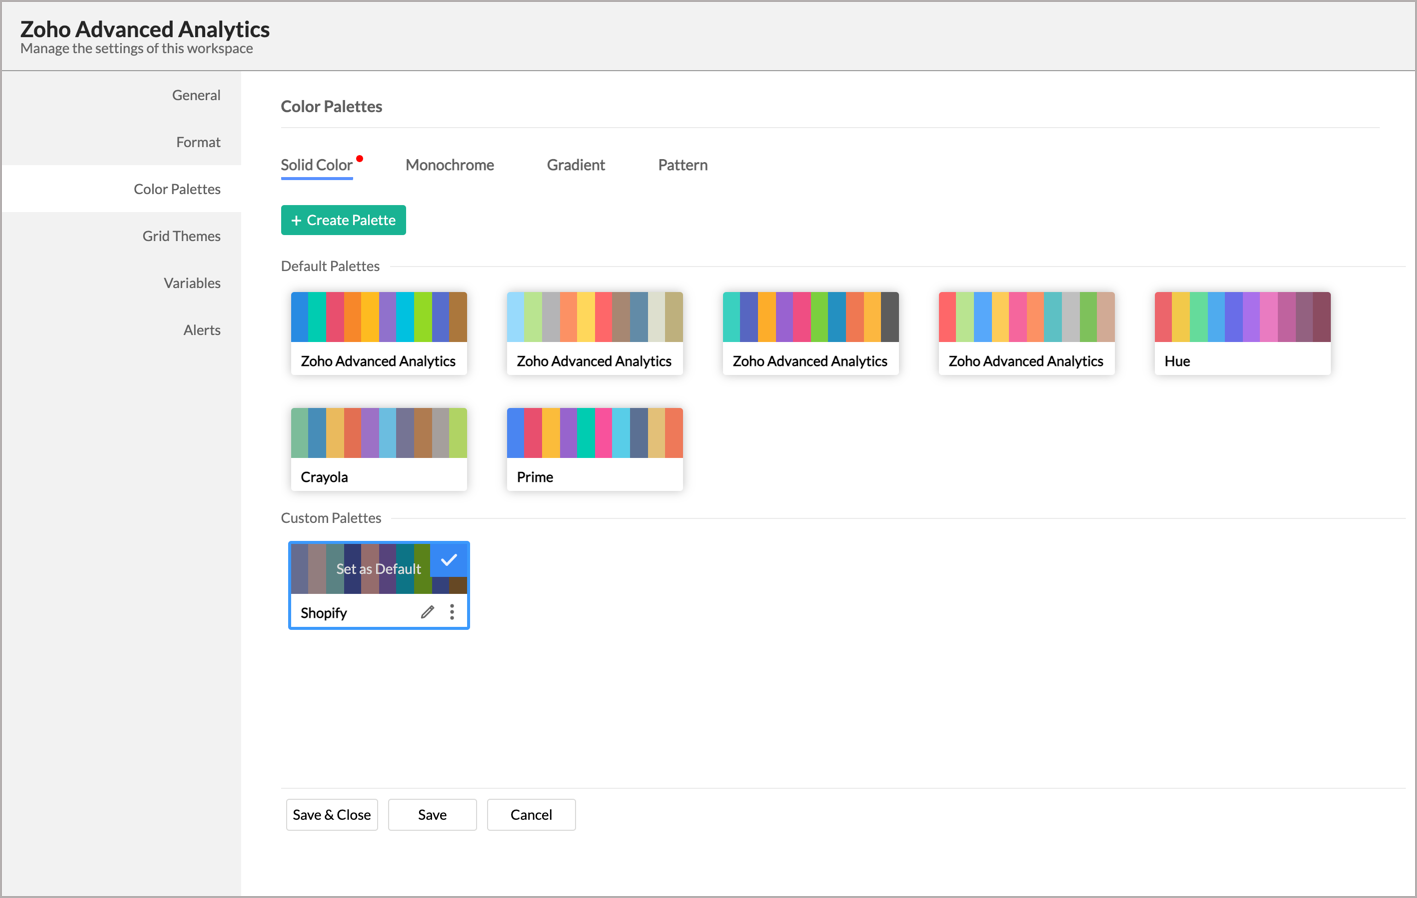
- Click Save & Close. The selected palette will be set as the default palette. When you create a chart, colors from this palette will be applied to the chart series.

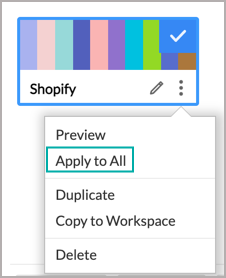
7. How can I change the chart colors for all the existing charts in my Zoho Advanced Analytics app?
By default, when you customize the chart color palette, it will be applied to the new charts created after customizing the palette. To apply the palette over all the existing charts, follow the steps below:
- Open Settings > Chart Colors page.
- Select the palette you want to apply to your existing chart. Learn about adding your own color palette.
- Click the Action icon that appears on mouse-over and select Apply to All. Colors from this palette will be applied over the existing colors. Please note that this action is irreversible.

8. Can I apply different colors for a chart?
By default, when you create a chart, the set palette colors will be assigned to your chart. However, you can choose to change this in a chart from the chart Legend Settings page.
Follow the below steps to do this:
- Open the chart for which you want to apply different colors.
- Click the Settings icon > Legend tab.
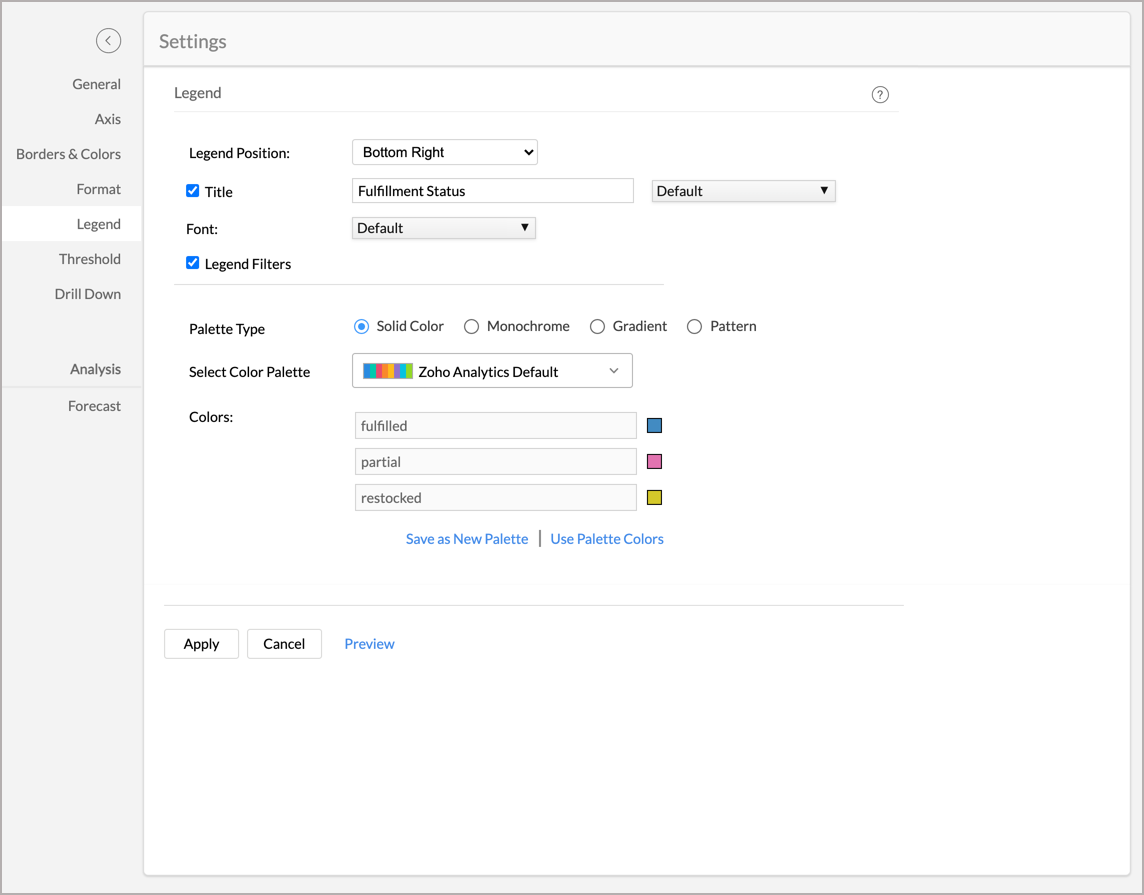
- In the Legend tab that opens, choose the color palette you want for this chart.
- You can also override the colors of the individual series of the chart using the Colors field.
- You can choose to save the customized color as a palette using the Save as New Palette link.
- Click Apply. The color will be applied to the chart.

9. How do I edit a palette?
You can edit the palette by following the below steps.
- Open the Chart Colors tab in the Settings page.
- Select the palette you want to edit.
- Click the Edit icon that appears on mouse-over.
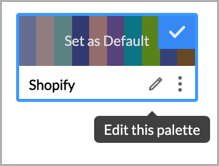
- The Edit Palette dialog will open. Modify the settings as needed and click Save.
- You can also save the modified palette as a new palette using the Save As option.


10. Can I copy a palette?
Yes, you can copy an existing palette. Follow the below steps to do so:
- Open the Chart Colors tab in the Settings page.
- Select the palette you want to copy.
- Click the Action icon that appears on mouse-over and select Duplicate.
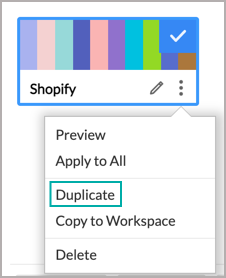
- A new palette with the same colors and settings will be created. You can further edit this palette as needed.

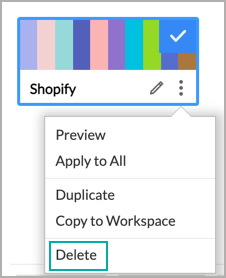
11. Can I delete a palette?
Yes, you can delete your custom palettes. To delete a palette:
- Open the Chart Colors tab in the Settings page.
- Select the palette you want to delete.
- Click the Action icon that appears on mouse-over and select Delete. The palette will be deleted.