Queue Stats
Zoho Voice's Queue Stats dashboard provides powerful analytics for monitoring and evaluating your call center’s queue performance. This dashboard provides insights into call center performance metrics such as service level rate, queue service time index, call abandoned rate, busy rate, repeat call rate, average call duration, peak calls, and more.
To support diverse operational needs, the dashboard supports two configuration views:
Org-level view: A uniform setup applied across the organization by super admin and admins.
On-demand view: A personalized view for all users (except technicians).
With customizable filters and performance thresholds, this dashboard enables data-driven decision-making, helping teams optimize call handling and overall service quality.
Filter options
Customize your dashboard view by applying filters based on:
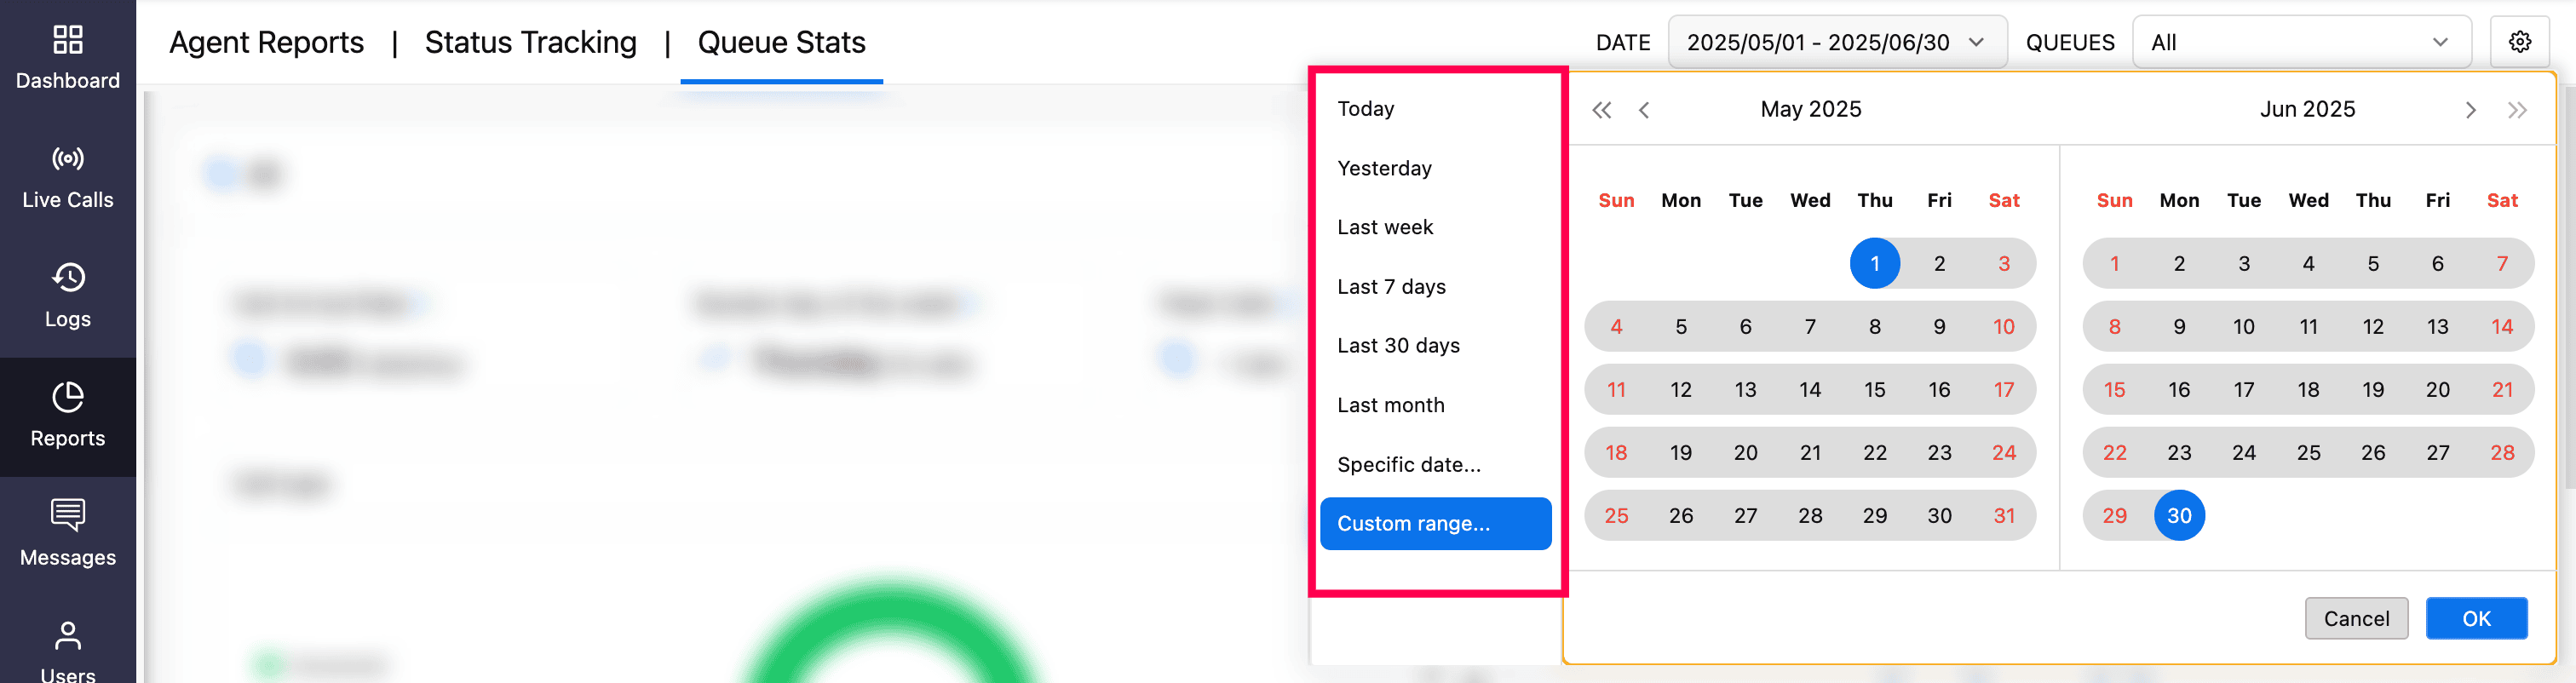
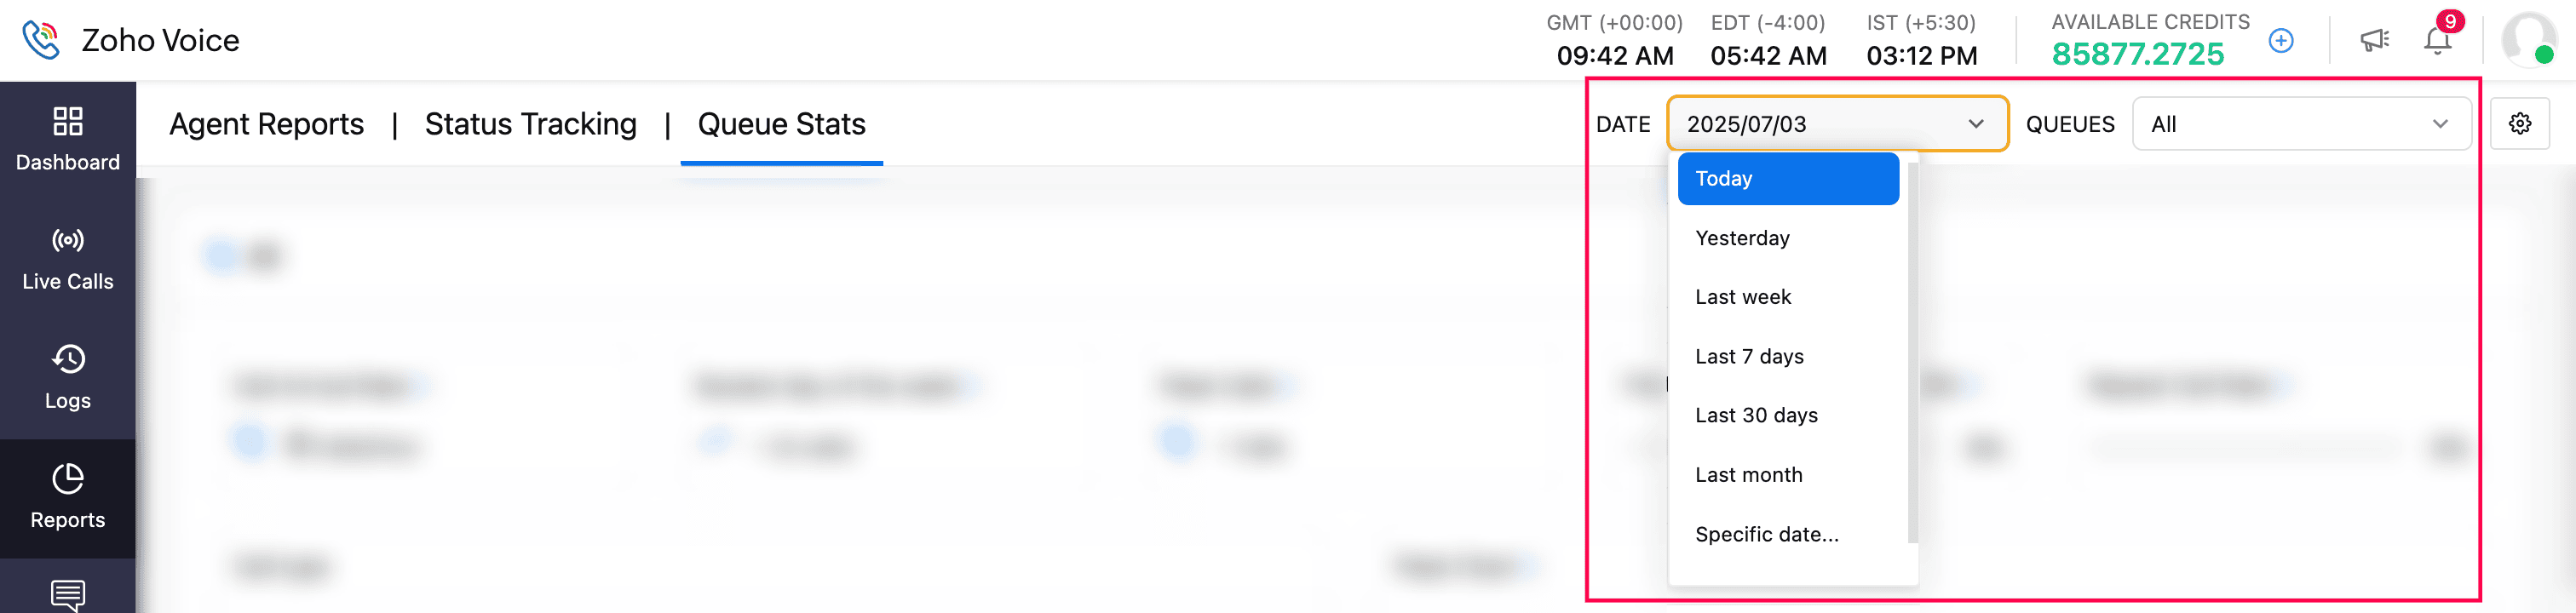
Date: Choose the predefined date ranges like today, yesterday, last 7 days, last 30 days, last month, specific date, or select a custom range (up to one year prior from the current date) for a granular analysis.
Queues: Select one, multiple, or all queues from the dropdown to tailor the data view according to your needs.

Who can set the configuration (Threshold Values) for the Dashboard?
The dashboard offers two configuration levels:
Org-level configuration
The threshold values can be set only by the super admin and admins.
Applies organization-wide and is the default view for all users (including supervisor and supervisor plus roles).
Useful for setting standard threshold values to ensure consistent performance monitoring across the organization.
On-demand configuration
Available for all users except technicians.
The threshold values can be customized by supervisors and supervisor plus users, if permitted by the super admin or admin.
This is a personal configuration view and does not affect other users or organization-level settings.
Configuration is not saved permanently; a page refresh will reset all metrics to default threshold values.
Visibility is limited to the user who sets it.
Note
For On-Demand configuration to be available, the super admin or admin must enable the Allow Edit option in Org-Level Config.
Configure Key Threshold values
Note
Default threshold values are pre-set. You may retain or modify them based on your requirements.
Configure the following key thresholds to tailor your dashboard view:
Key Thresholds | Description |
Talk Time | The duration an agent actively speaks to a caller (excluding hold time). Starts when the call is answered and ends when the call is disconnected. |
Wait Time | The duration a caller spends in the queue before their call is answered by an agent. This metric applies only to answered calls and is used in calculating Service Level Rate and Queue Service Time Index. |
Hold Time | The duration a caller is placed on hold during a live call (after answering, before resuming or ending the call). Used in calculating Queue Service Time Index. |
Short-Abandoned Time | The duration a caller stays in the queue before hanging up the call prematurely. This is usually within a short time (e.g.: under 5 seconds). Calls that end before this defined threshold are categorized as short-abandoned and not counted under standard abandoned calls. |
Peak Hours Sensitivity | Determines how the system detects and highlights high-traffic periods based on incoming call volume. Levels:
|

Steps to configure Key Thresholds values
Go to the Reports module from the left sidebar menu.
Select the Queue Stats tab.
On the dashboard, click the Date filter in the top-right and select a date range.
Click Queues and select one, more or all queues for your analysis.
To configure Org-Level settings (available only to super admin and admins):
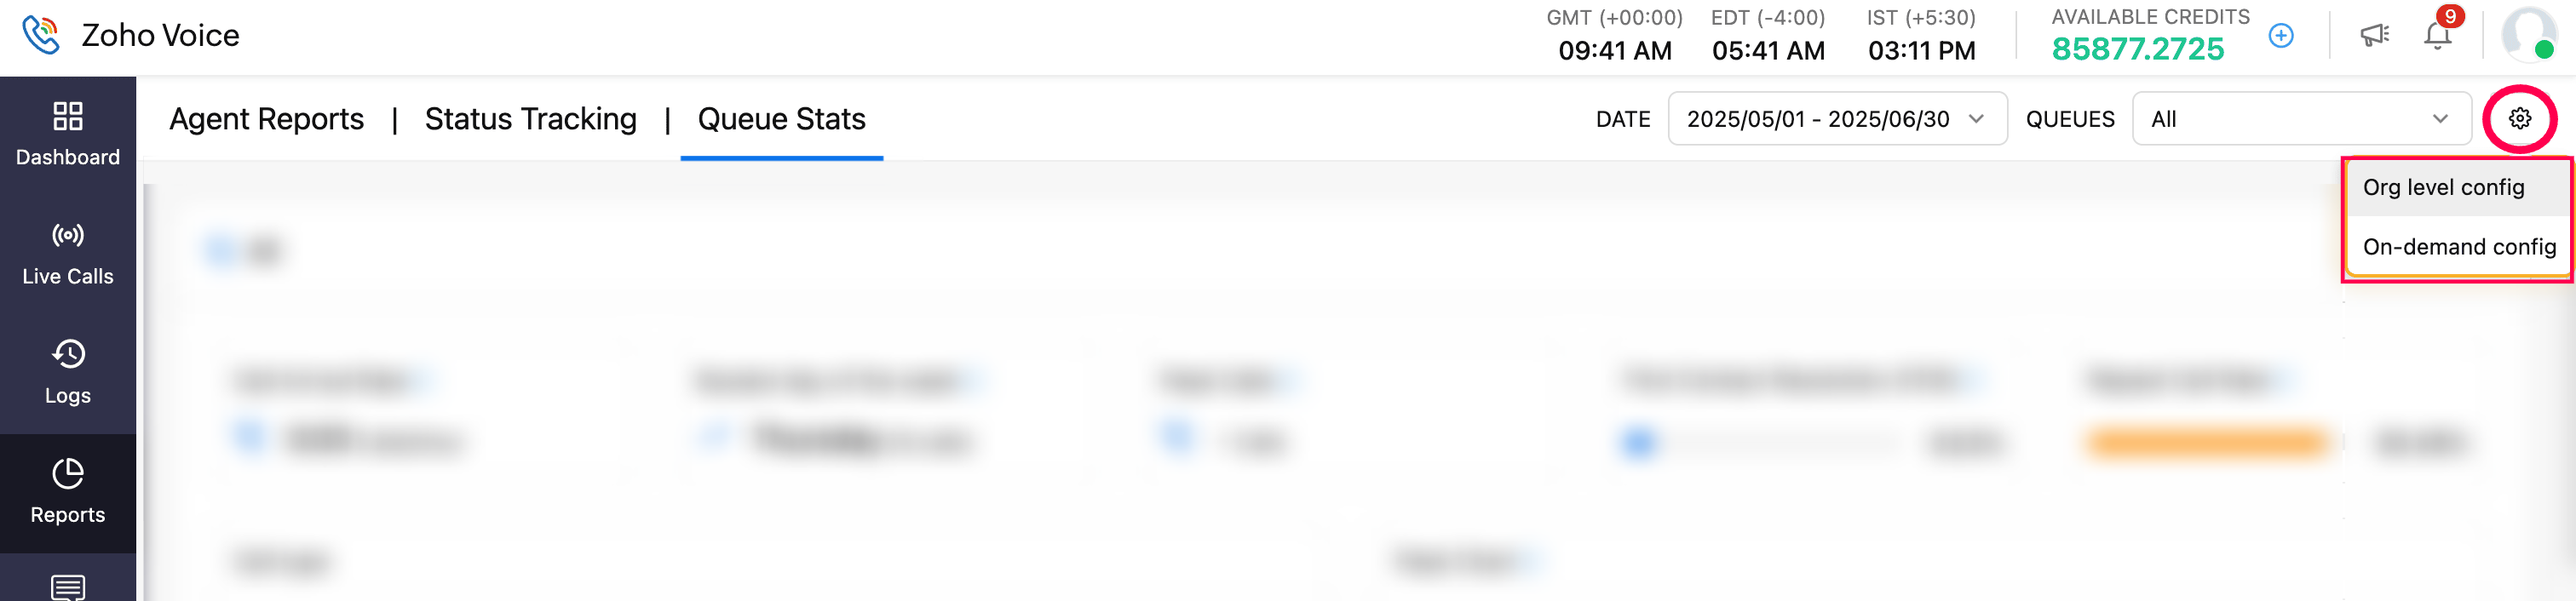
Click the Settings icon in the top-right corner.
Select Org-Level Config.
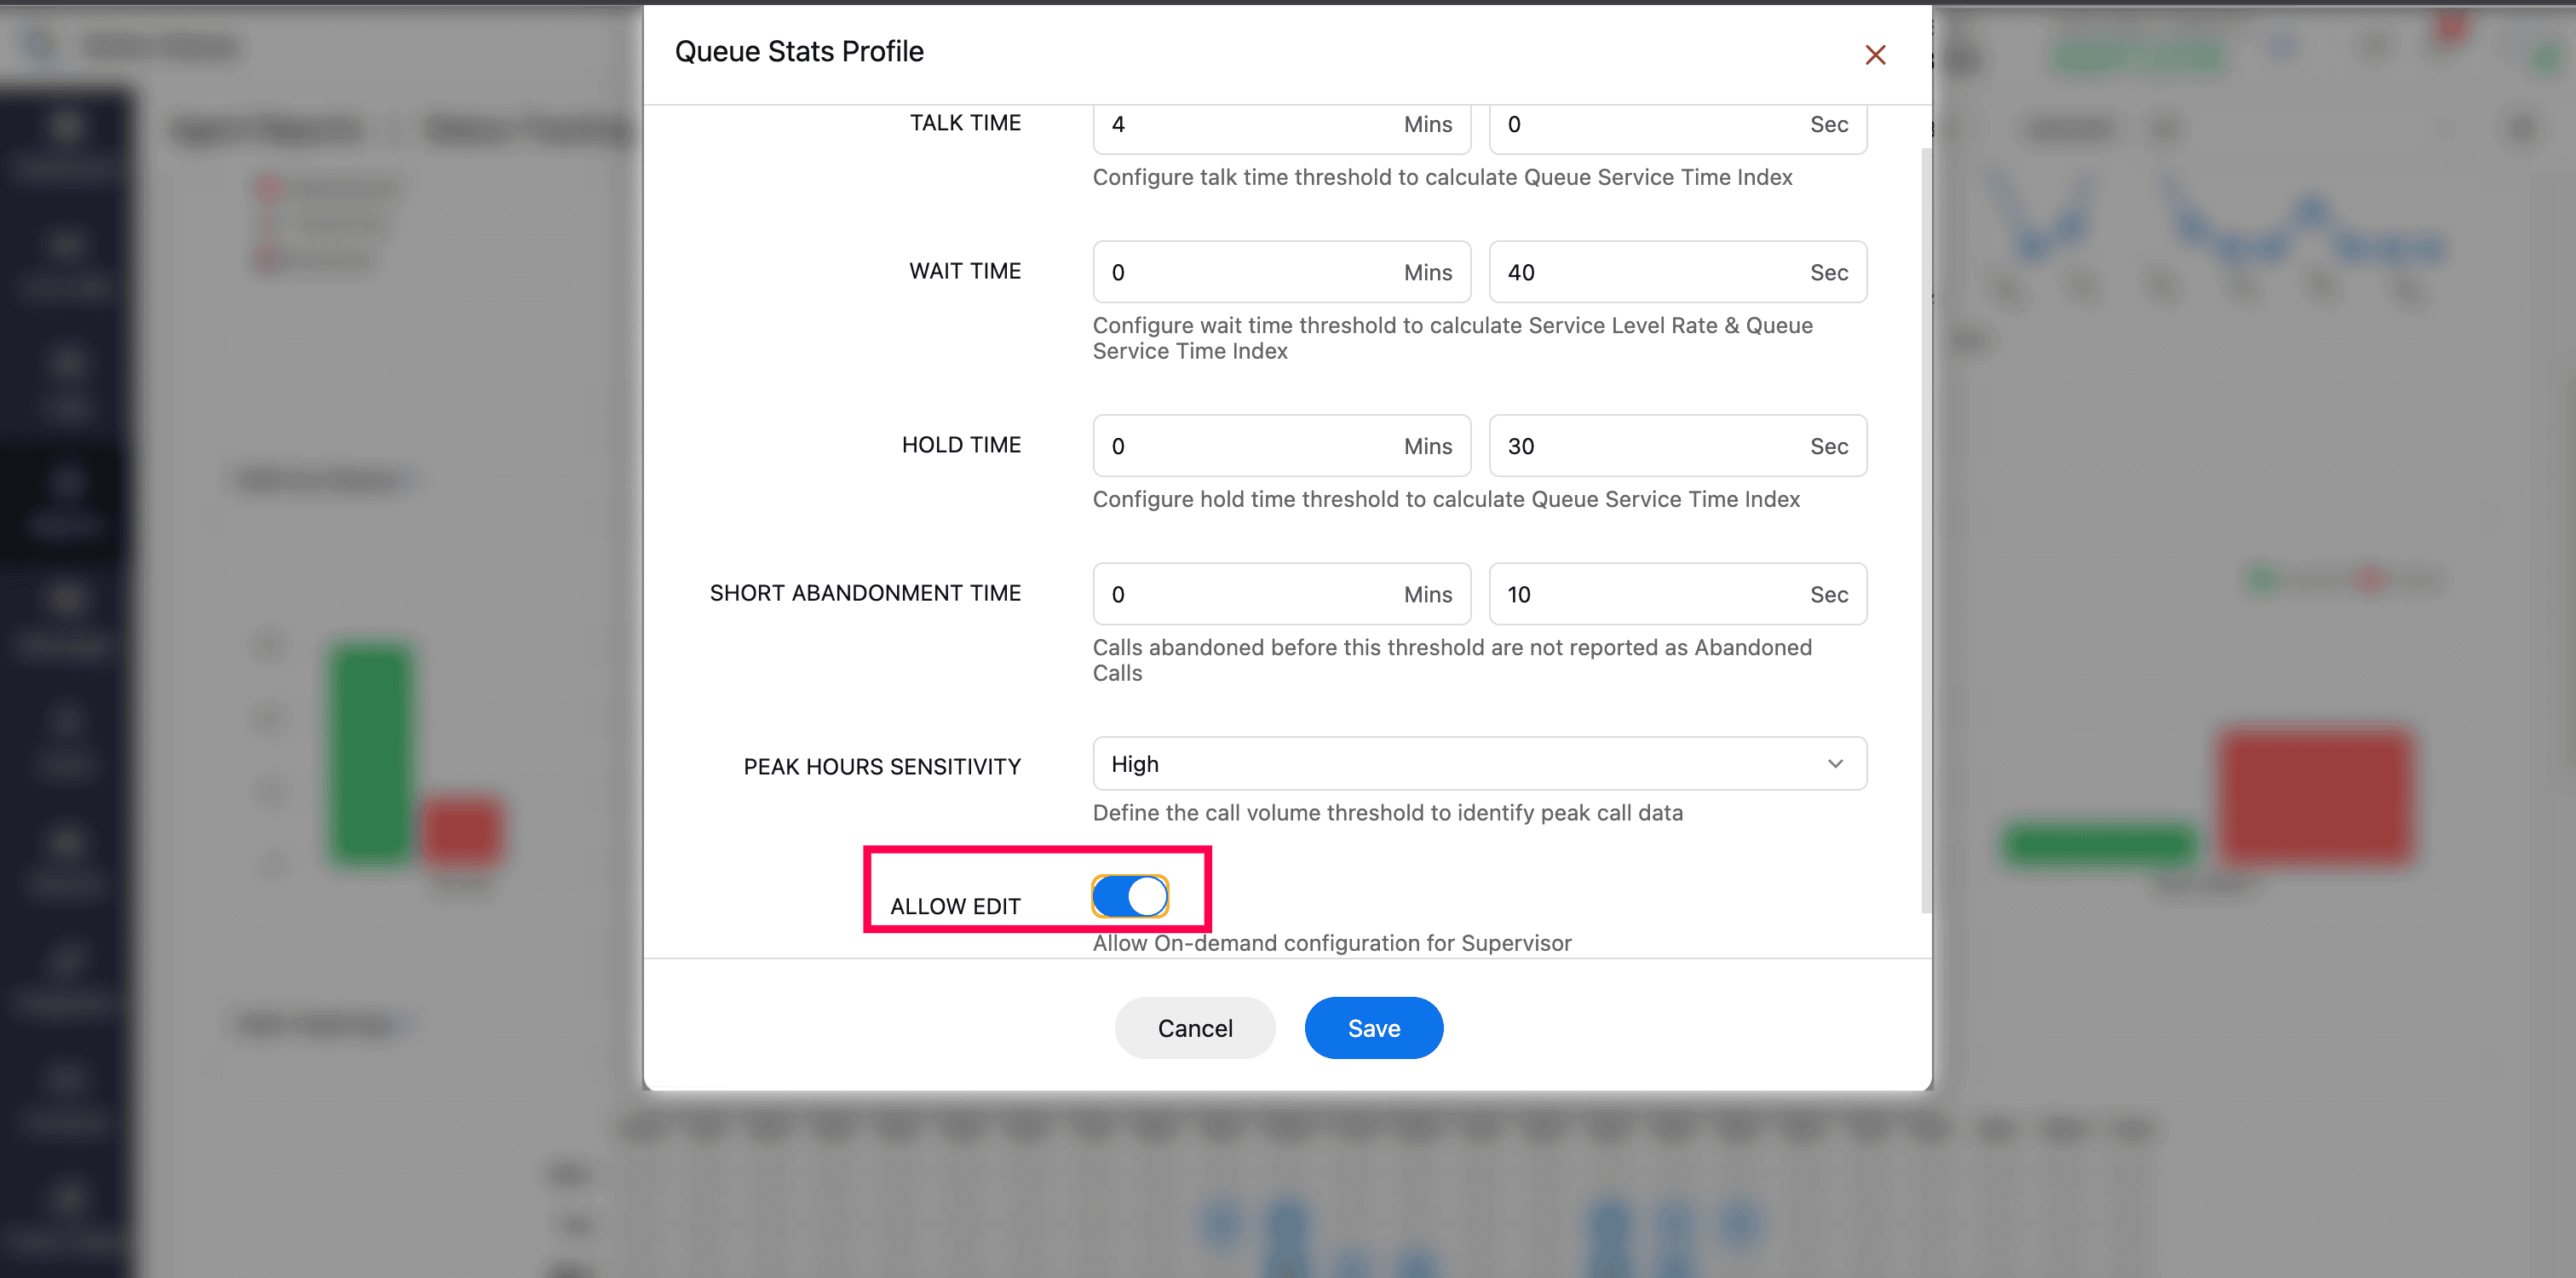
Enter values for Talk Time, Wait Time, Hold Time, Short Abandoned Time, and choose Peak Hours Sensitivity.
Enable Allow Edit to permit supervisor plus and supervisors to create their own On-Demand configurations.
Click Save to apply the configuration.
Note
For On-Demand settings (available to supervisor plus and supervisor users): If Allow Edit is enabled by the super admin/admin, these users can follow the same steps via On-Demand Config to set personalized configurations for their own view and analysis.


Dashboard overview
Once the relevant Org-Level or On-Demand configuration is applied, the Queue Stats dashboard is displayed with three primary sections for effective performance analysis:
All - Provides insights across all calls, regardless of outcome.
Answered - Focuses on metrics related to calls that are answered.
Unanswered - Highlights statistics for calls that were unanswered due to agent unavailability or calls placed outside the business hours.
All section
This section includes data for all incoming call types and presents the following key metrics for the selected date range and the queues:
Call Arrival Rate: Displays the total number of incoming calls received per hour.
Busiest Day of the Week: Highlights the day of the week that records the highest cumulative number of calls across all weeks in the selected date range.
Peak Calls: Displays the maximum number of calls waiting in the queues.
First Contact Resolution (FCR): Indicates the percentage of incoming calls that were successfully resolved during the first interaction, without the need for any follow-up calls from the same customer on the same day.
Formula:
FCR(%) = (Number of unique callers who made only one call on the same day / Total incoming calls) × 100Repeat Call Rate: Indicates the percentage of incoming calls made by the same caller more than once on the same day, which may suggest unresolved issues or the need for follow-up.
Formula:
Repeat Call Rate(%) = (Number of repeat calls from the same number on the same day / Total incoming calls) × 100

Call types
These metrics are visualized using a donut chart for easy interpretation:
Answered: Number of incoming calls successfully answered by agents in the queue.
Short Abandoned: Number of incoming calls where the caller hung up while waiting in the queue, typically within a short, predefined time threshold (e.g., under 5 or 10 seconds).
Abandoned Calls: Number of incoming calls where the caller hangs up before the call is answered by an agent, usually after exceeding the configured short-abandon time threshold.
Timeout Calls: Number of incoming calls that remained unanswered beyond the configured maximum wait time and were automatically disconnected by the system.

Major visuals
Peak Chart: Line chart showing daily call volume trends for the selected date range.
Calls by Queue: Bar chart ranking the top 10 queues by call volume. Effective when multiple queues are selected in the filter.
Calls by Agent: Bar chart highlighting the top 10 agents based on number of calls handled.
Calls Heatmap: Visual matrix that displays the distribution of incoming calls across selected days and hour intervals. Hover over each cell to see the exact day, hour, and corresponding call count. User can adjust the call count range if needed to refine the heatmap view.

Answered section
The Answered section provides detailed analytics for all answered calls. It highlights essential performance metrics to help assess agent responsiveness and queue efficiency for the selected date range and queue(s):
Wait Time: Displays the average and maximum duration callers spent waiting in the queue before being answered by an agent.
Hold Time: Displays the average and maximum duration callers were placed on hold after their call was answered, but before the conversation resumed or ended by the agent.
Talk Time: Displays the total, average, and maximum duration agents spent actively speaking with callers. This excludes both hold and wait times.
Handle Time: Displays the total, average, and maximum duration agents spent handling calls, including both talk time and hold time.
Call Duration (Avg): Displays the average length of a call, measured from the moment it enters the queue until it is disconnected.
Average Speed of Answer (ASA): Displays the average time it takes for agents to answer incoming queued calls, calculated from the moment the call starts ringing for an agent until it is answered.
Calls Missed by First Agent: Displays the number of calls that were not answered by the first agent but were eventually picked up by a subsequent agent. (Note: Not applicable for the Simultaneous Ringing type where the call rings for all agents in a queue at once.)
Call Transfer Rate: Indicates the percentage of answered calls that were transferred to another agent, queue, or other external number during the interaction.
Formula:
Call Transfer Rate(%) = (Number of transferred calls / Total answered calls) × 100

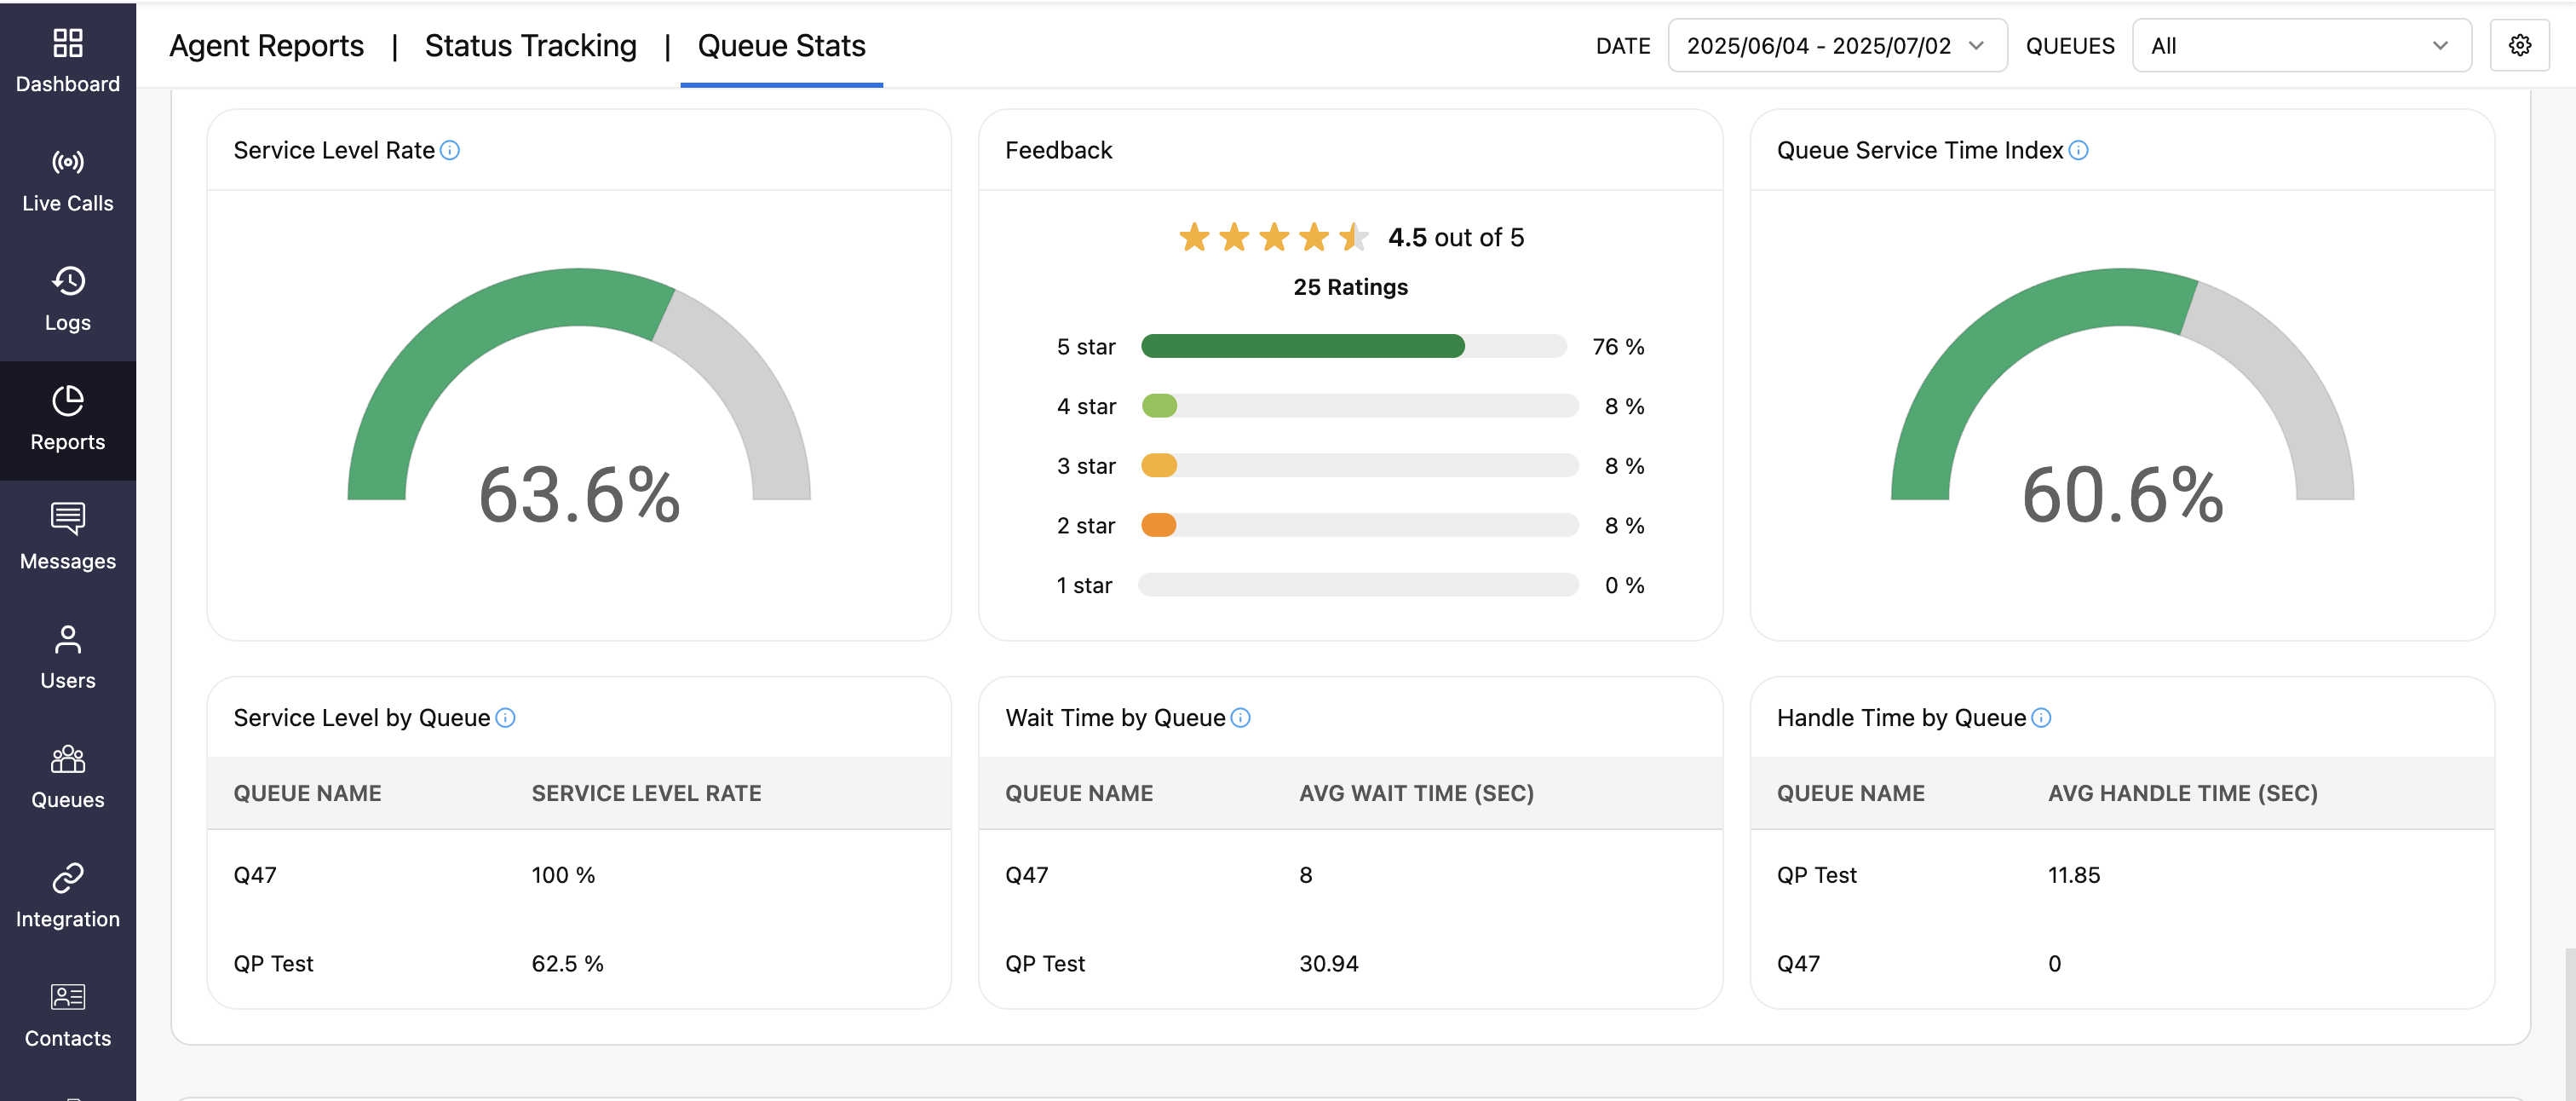
Service Level Rate: Displays the percentage of calls answered within the configured wait time threshold. This metric helps measure responsiveness.
Formula:
Service Level Rate(%) = (Number of calls answered within configured wait time threshold / Total answered calls) × 100
Feedback: Displays the consolidated feedback ratings submitted by callers.
Queue Service Time Index: Represents the percentage of answered calls that were handled within the configured thresholds for talk time, hold time, and wait time. This metric helps assess overall service efficiency and agent responsiveness.
Formula:
Service Time Index(%) = (Number of calls that met all three thresholds / Total answered calls) × 100
Service Level by Queue: Lists the top 10 queues with the highest service level rates.
Wait Time by Queue: Lists the top 10 queues with the lowest average wait time.
Handle Time by Queue: Lists the top 10 queues with the lowest average handle time.

Unanswered section
This section presents analytics for all unanswered calls, providing insights into call patterns and agent availability for the selected date range and queues:
Off-Duty Calls: Displays the number of calls received outside the configured business hours that went unanswered.
Voicemails Left: Displays the number of voicemails left by callers due to agent unavailability.
Abandoned time (Avg): Shows the average duration callers waited in the queue before disconnecting, excluding calls that ended within the short-abandon time threshold.
Queue Busy Rate-Agents on a Call: Displays the percentage of incoming calls that went unanswered because all agents were occupied with other calls at the time the calls entered the queue.
Formula:
Queue Busy Rate(%) = (Number of unanswered calls due to agents being busy / Total incoming calls) × 100
Call Abandon Rate: Shows the percentage of incoming calls where callers disconnected while waiting in the queue before being answered by an agent, excluding those disconnected within the configured short-abandon time threshold.
Formula:
Call Abandon Rate(%) = [Number of abandoned calls / (Total incoming calls - Short abandoned calls)] × 100
