Queue Performance Metrics
Zoho Voice offers Queue Performance Metrics to render an effective oversight of the live queue calls and agents' activities in the queue.
This is a special analytic feature that provides your supervisors with real-time visibility of various aspects of the queue, and lets them closely monitor the calling patterns, trends, performance of various agent teams by measuring and analyzing performance of each team in your organization. This feature presents the required analytical data in a consolidated list view for the supervisors to draw effective actionable insights out of the real-time queue data just from a single window.
Who can access this feature?
Super Admins & Admins: Full access to create, edit, monitor, and analyze all queues across the organization.
Supervisor Plus: Can edit, monitor, and view analytics for queues that contain agents assigned to them.
Supervisors: Can monitor and view analytics for queues containing agents under their supervision.
Technicians: Can view the names of fellow agents in their respective queues only (no analytics access).
How to view Queue Performance Metrics?
Go to the Queue module. You’ll see a list of available queues.
Use the Queues and Date filter options to refine your view if needed.
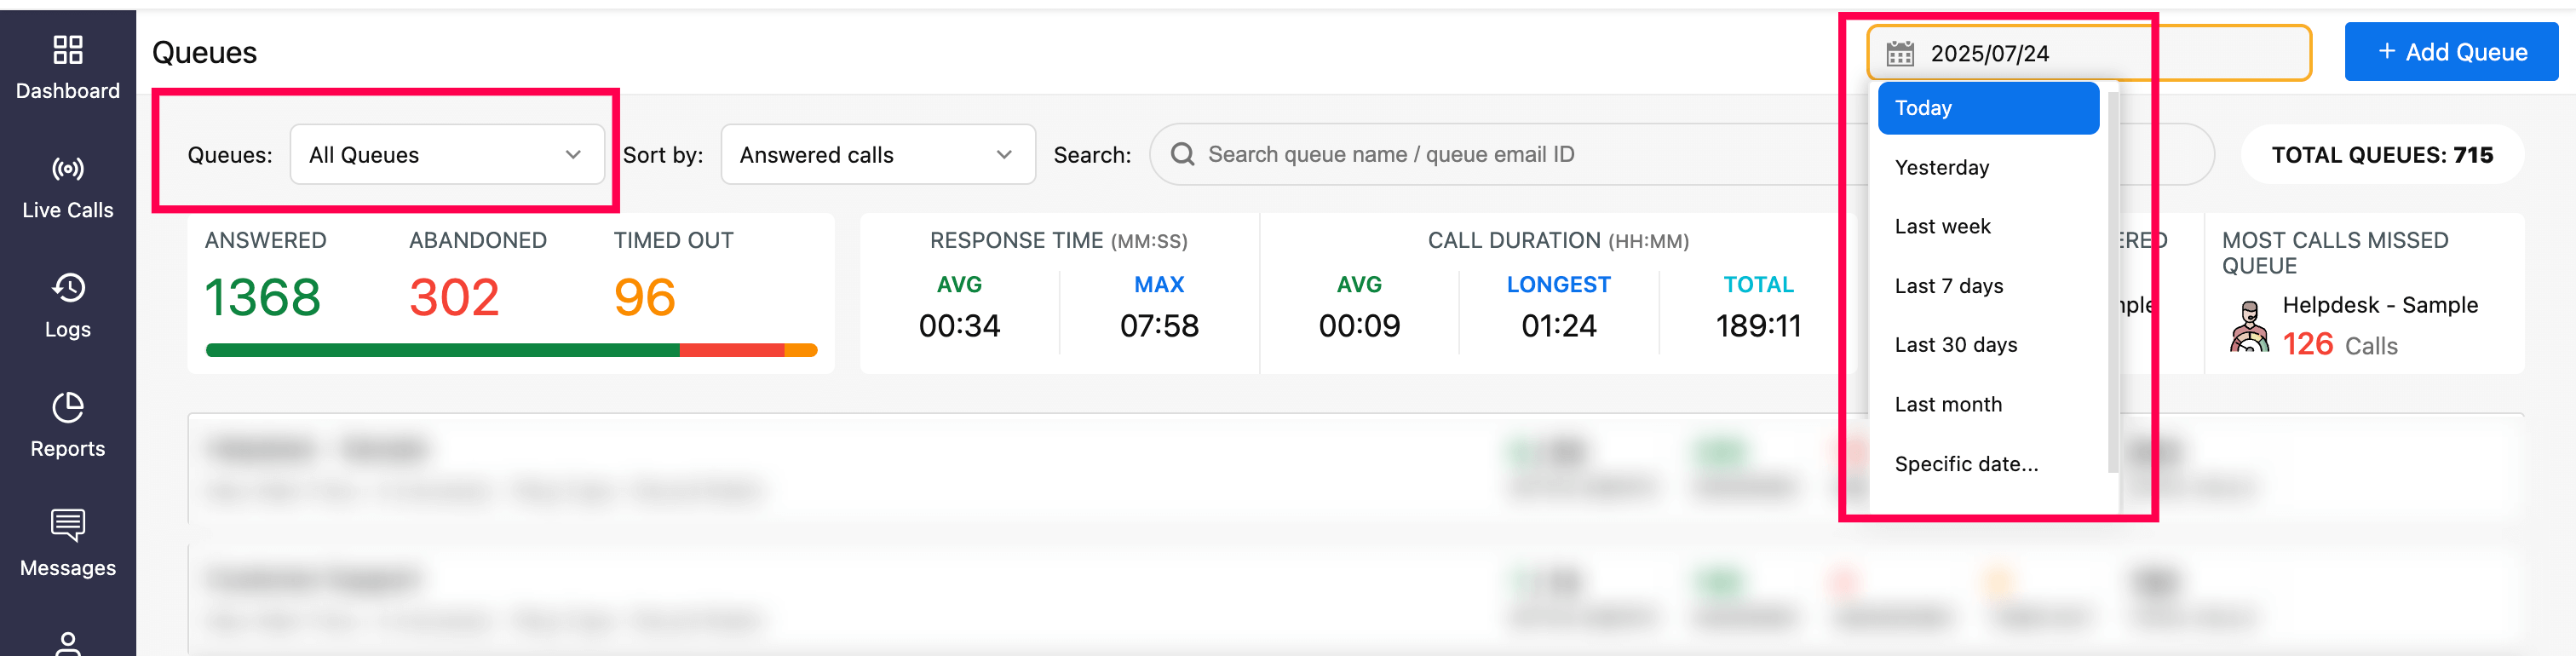
The summary dashboard displays grouped analytics based on the selected queues and date filter.
Click on a specific queue to drill down into its detailed performance metrics.


Grouped Analytics (across Queues)
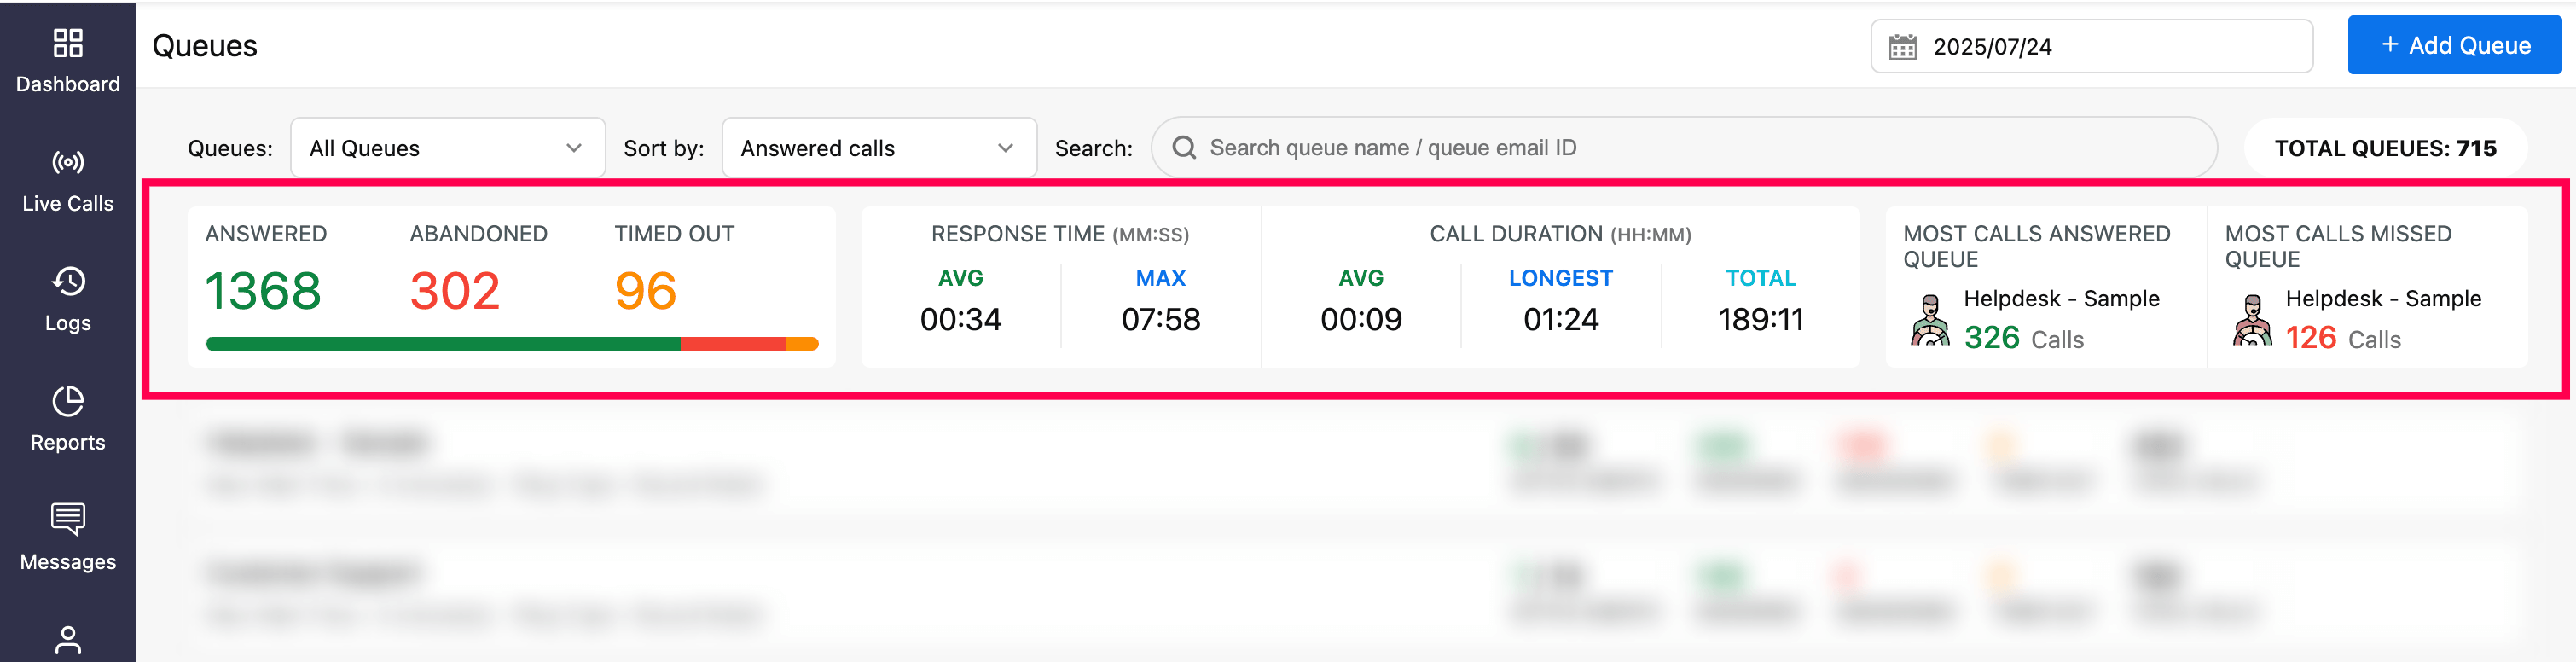
Super Admin, Admins, Supervisor Plus, and Supervisor users can access the grouped analytics summary dashboard, which displays cumulative performance data across all queues they manage or have access to, based on the selected filters.

Available metrics include:
Answered: Total number of incoming calls that were successfully answered.
Abandoned: Number of incoming calls where the caller disconnected before an agent could answer.
Response Time: Shows both the average and maximum time taken to answer calls.
Call Duration: Displays the average, longest call duration, and the total call duration.
Most Calls Missed Queues: Highlights the queue with the highest number of missed calls.
Most Calls Answered Queues: Highlights the queue with the most answered calls.
Note
The summary dashboard is based on the applied queue and date filters.
Performance metrics available per Queue
Queue performance data is divided into two categories:
Queue-Level Metrics: Aggregated data across all agents in a queue.
Agent-Level Metrics (Segment Analytics): Performance data for each agent within a queue.
Queue-level metrics
In a queue, the following performance indicators are measured:

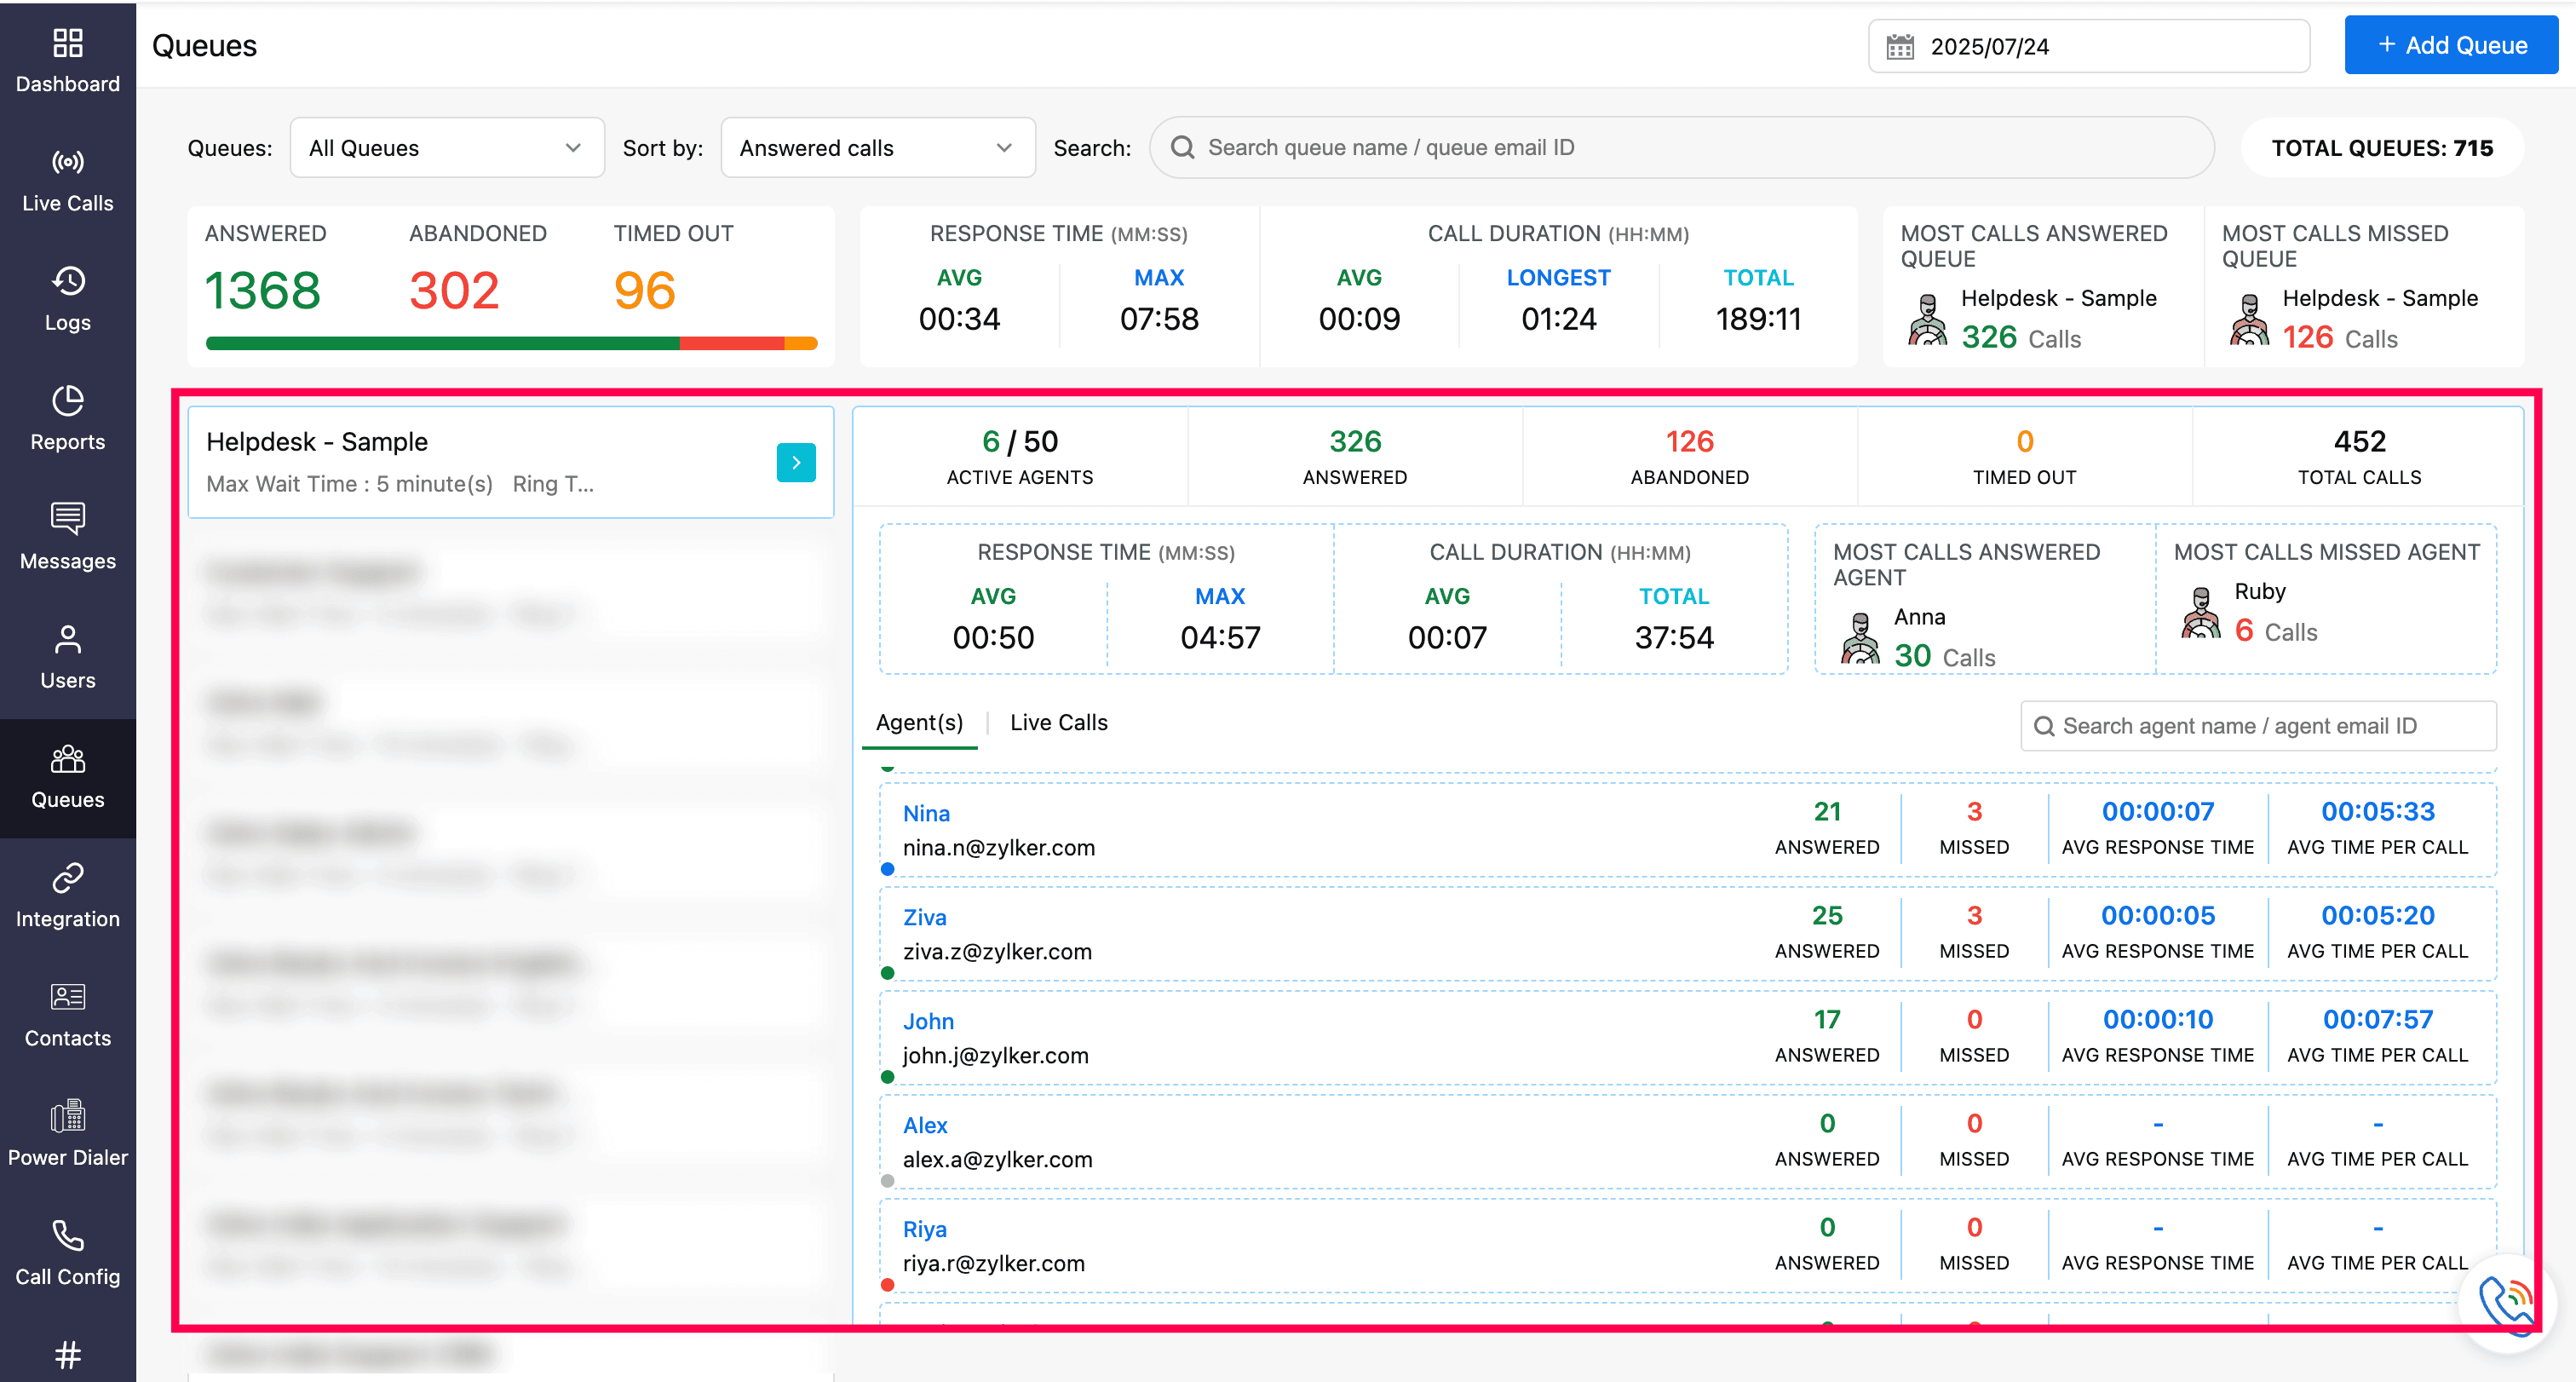
Active Agents: Shows how many agents are currently active and available in the queue.
Answered: Displays the total number of incoming calls successfully connected and answered by the agents in the queue
Abandoned: Displays the number of incoming calls where the caller disconnected before an agent could answer.
Timed out: Displays the number of calls that were disconnected after ringing throughout the allocated waiting time limit of the queue without successfully connecting to an agent.
Total Calls: Displays the total number of incoming calls that successfully entered the particular queue regardless of the end status of the calls.
Response Time(MM:SS): Time taken by agents to answer a call.
Average Response Time: Estimates and presents the average amount of time taken by the agents in a specific queue to respond to the calls that arrive into the queue, for a specific time window. This helps the supervisor gauge and rank the queues based on availability and efficiency.
Max Response Time: Presents the longest amount of time taken by the agents in a specific queue to respond to the calls that arrive into the queue, for a specific time window. This helps the supervisor inquire and resolve the cause behind the lags or idle time associated with the queue.
Call Duration(MM:SS): Total length of each call from answer to disconnect.
Average Call Duration: Shows the average amount of talk time taken by the agents in a specific queue to answer and close the calls that arrive into the queue, for a specific period of time.
Total Call Duration: Presents the total amount of talk-time taken by each of the agents in a specific queue to answer and close the calls that arrive into the queue, for a specific period of time.
Agent-level metrics
The Queue Performance feature provides segmented analytics for each agent's performance within a specific queue, helping supervisors monitor individual efficiency and response patterns over a selected time period.

Agent(s) tab
Under the Agent(s) tab, the following metrics are available:
Answered Calls: Displays the total number of calls successfully connected and answered by the agent for the selected queue.
Missed Calls: Shows the number of incoming calls that were missed by the agent in the selected queue.
Average Response Time: Calculates the average time taken by the agent to answer incoming calls in the selected queue.
Average Time Per Call: Displays the agent’s average talk time per call, calculated from all calls answered in the selected queue.
Live Calls tab
Click the Live Calls tab to view the number of active queue calls currently in progress.
Note
This view allows supervisors only to observe ongoing calls. To listen, barge in, or initiate a 3-way conversation, switch to the Live Calls module.