The Dashboard
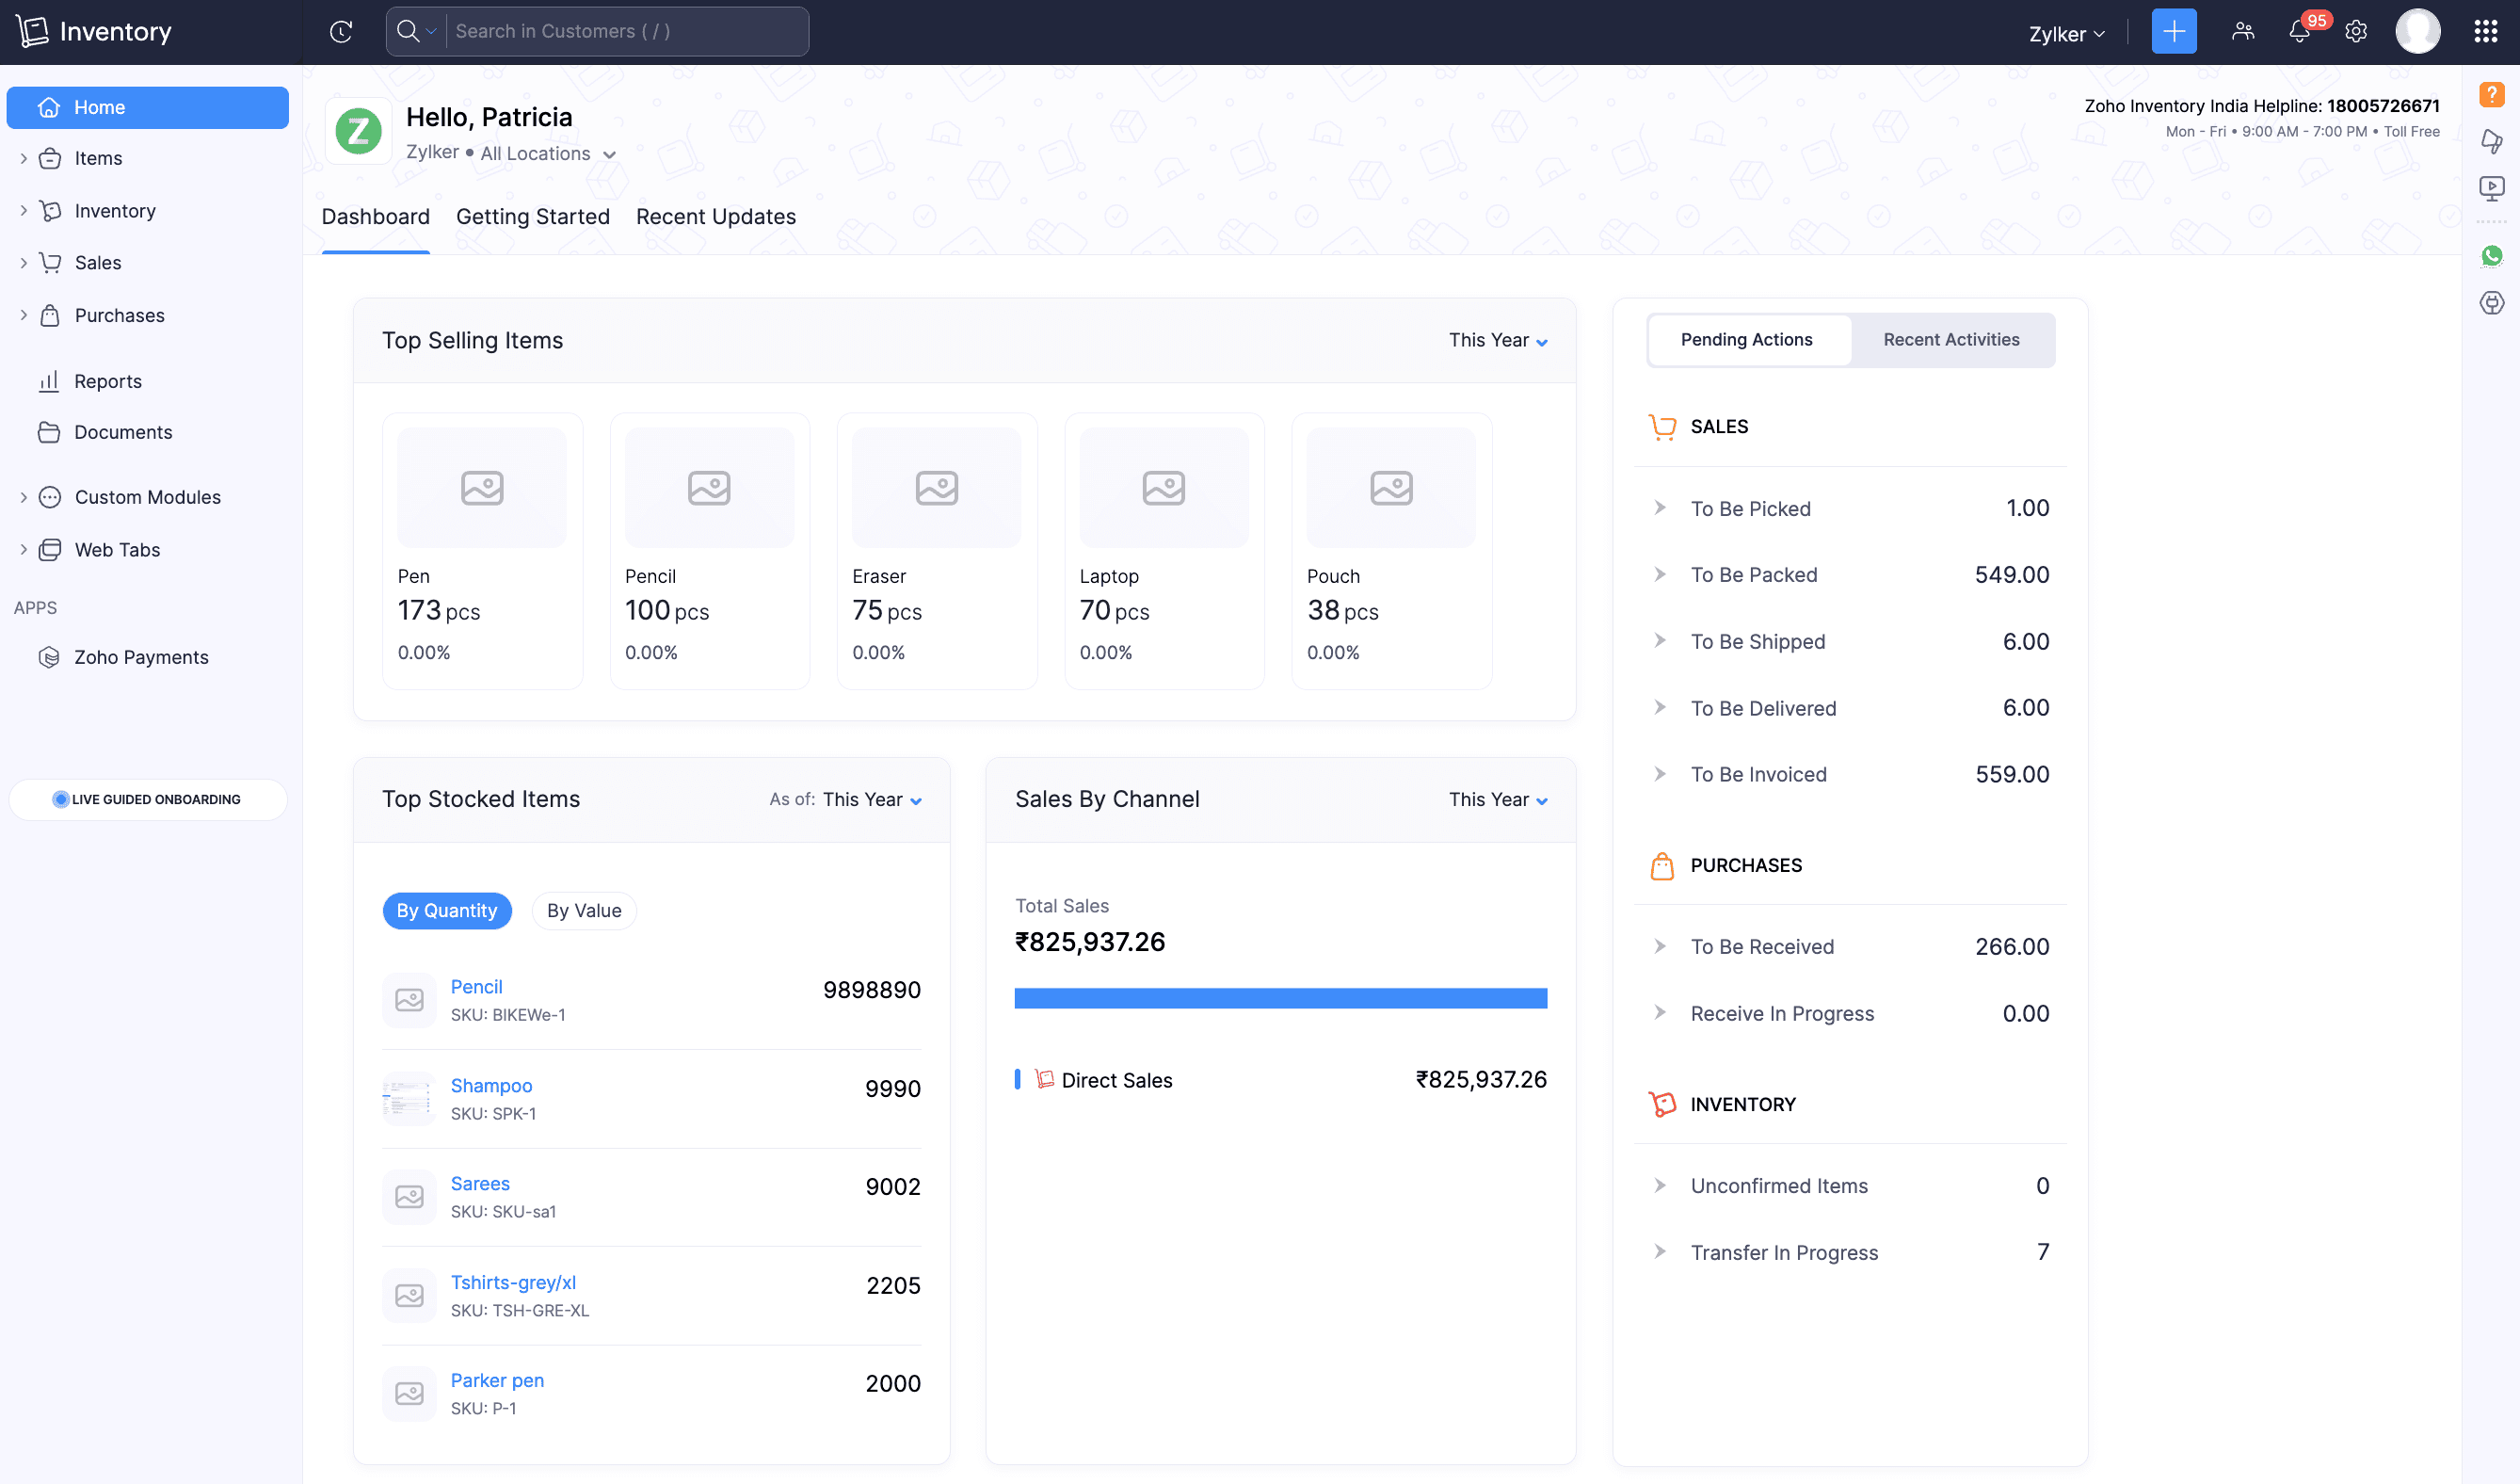
The Dashboard is the home page of your Zoho Inventory account and is the first screen you will see upon signing in. It provides a comprehensive overview of your organization’s key metrics and sales, such as sales order summary, top selling items, top stocked items, sales by direct and indirect channels, top vendors, purchase receives, pending actions, and recent activities.
Insight: If Zoho Inventory is integrated with other Zoho apps (Zoho Books, Zoho Commerce, Zoho CRM, etc.) the dashboard will also include the sales, purchase, and item details from the integrated apps, offering a unified view of your business operations.

Top Selling Items
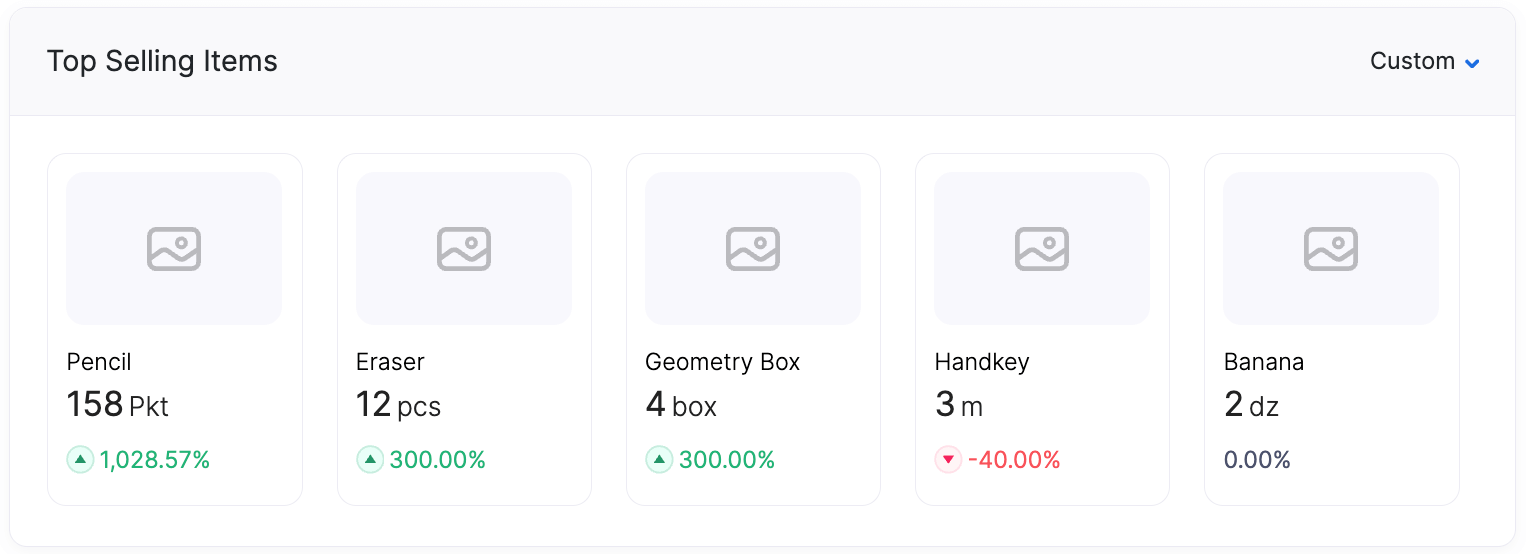
Here, you can view the top five best-selling inventory-tracked items based on the quantity you have invoiced for the selected time range. You can click an item to navigate to its detail page.

The percentage below indicates how the item’s sales compare to the previous selected period:
Green - Sales have increased by the shown percentage.
Red - Sales have decreased by the shown percentage.
0.00% - Indicates when the item has no invoices in the previous period or when both periods reflect the same quantity.
Top Stocked Items
This section displays the top five inventory-tracked items that were restocked in the selected period. You can click the item to view the Inventory Summary report.
Sales by Channel
In this section, you can view the total sales amount and performance of your direct sales and integrated sales channels (Etsy, Amazon, eBay etc.,) for the specified time range.
Sales Order Summary
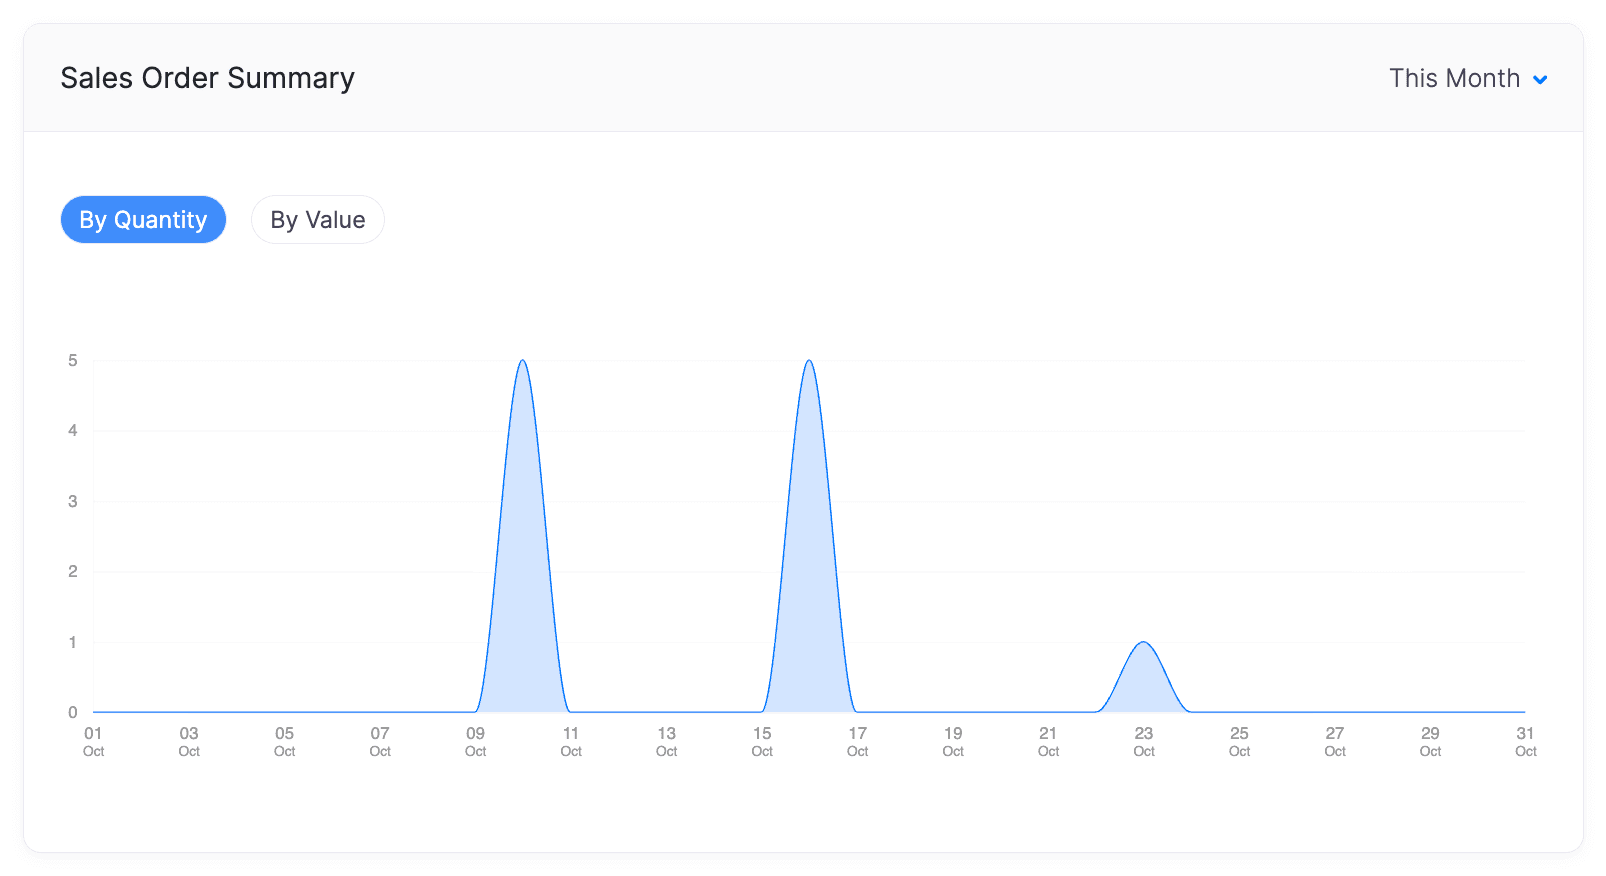
The sales orders you’ve created will be displayed as a graph for the selected time range. You can choose to view them by quantity or value.

Top Vendors
The top five vendors you have purchased from will be displayed in percentage, based on either quantity or value for the selected time range.
Receive History
Here, you can view the recent twenty five purchase receives transaction in the selected time range. You can click on the purchase receives numbers or vendor names to navigate to their respective detail pages.
Pending Actions
You can view the pending actions along with the quantity of pending sales orders, purchase orders and items under the respective sections.
Sales
| Label | Description |
|---|---|
| To Be Picked | Click this to navigate to the list view page of Picklist module, where you can view all picklists that haven’t been started yet. |
| To Be Packed | Click and view the sales orders that are yet to be packed, or partially packed in the list view page of Sales Order module under the Sales Order for Packaging filter. |
| To Be Shipped | By clicking this you will be navigated the Package module to view the sales orders that are packed but not yet shipped. |
| To Be Delivered | Click this to navigate to the Packages module to view the sales orders that are shipped and delivered under Delivered Packages section. |
| To Be Invoiced | Click this to navigate to the list view page of Invoice module to view the invoiced, or partially invoiced transaction under the Sales Orders for Invoicing filter. |
Purchases
| Label | Description |
|---|---|
| To Be Received | Click this to navigate to the Purchase Orders module, to view the purchase orders that are yet to be received and partially received. |
| Receive in Progress | Click this to navigate to the list view page of the Purchase Receives module to view the transactions that are In Transit status. |
Inventory
| Label | Description |
|---|---|
| Unconfirmed Items | By clicking this you will be navigated to the Items module to view the items fetched from the sales channel are not matched with your organization items. |
| Transfer in Progress | Click this to navigate to the Transfer Orders module to view the transfer orders that are in the In Transit status. |
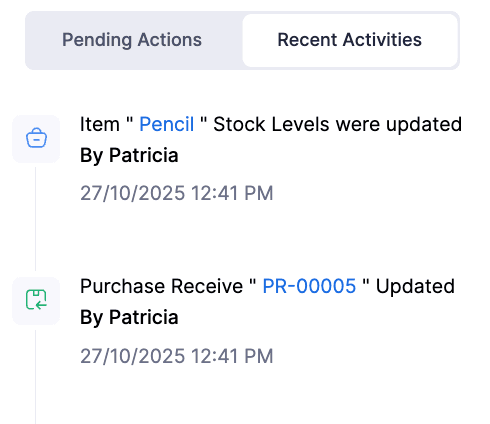
Recent Activities
View the recent 100 activities that were performed in your organisation. Click the transaction number or item name to navigate back to view its recent activity without searching for them manually.


