
There is a version of engagement that looks fine on the surface. Attendance is consistent. Grades are acceptable. Nobody is causing problems. But ask the students what they actually think of their experience and a different picture emerges. Students can be physically present in the class but mentally somewhere else. They may appear attentive without actually grasping the concepts. They can be completing assignments on time but unaware of what the outcomes of the exercise were.
That gap between simply following the rules and actually being engaged is something educational institutions often overlook. From the outside, there’s no real way to know what students are thinking or feeling unless you ask them directly. A student engagement survey helps you solve that challenge.
What is student engagement?
Student engagement refers to the degree to which students are actively involved in, committed to, and motivated by their learning experience. It is not the same as attendance or academic performance, though both can be affected by it.
The National Survey of Student Engagement (NSSE), run by Indiana University’s Center for Postsecondary Research, looks at student engagement in two parts:
- How much time and effort students put into their studies and other meaningful activities
- How well the institution creates opportunities that encourage them to take part.
So engagement isn’t just about what students do. The institution has a role in creating the conditions for it too.
Researchers usually look at student engagement across three areas:
- Behavioral engagement: Is the student taking part? Do they attend classes, complete their work, join activities, and interact with classmates and instructors?
- Cognitive engagement: Are they actually thinking about what they’re learning? Do they show curiosity, stick with difficult material, and put real effort into understanding it?
- Emotional engagement: Do they feel connected? Do they feel like they belong, see value in what they’re learning, and feel connected to the institution?
These don’t always move together. A student can attend every class and hand in every assignment while still feeling completely disconnected from the course. If you only measure attendance, you miss that part of the picture. A useful measure of engagement needs to look at all three.
Why is student engagement important?
The short answer is that it predicts almost everything that matters when it comes to student experience.
Gallup’s multi-decade analysis of student engagement in K-12 schools found that schools in the top quartile of engagement had significantly more students meeting or exceeding academic proficiency requirements than those in the bottom quartile. Engagement is not just a wellbeing metric. It is a performance driver.
The 2024 Gallup Voices of Gen Z study, which surveyed 4,157 students aged 12 to 27 using a probability-based panel across all 50 US states, found that between 25% and 54% of K-12 students said they were not having each of eight key engaging experiences at school, including finding their learning important or interesting, and feeling that their schoolwork aligned with their strengths. Fewer than one in three students strongly agreed they were having any of those experiences.
That is a significant portion of any student population quietly disengaging without it necessarily showing up in the metrics schools most commonly track. The students are still there. The engagement is not.
That can become a bigger problem over time, especially if they start questioning whether they want to stay. Looking at engagement can help institutions catch that disconnect before it becomes harder to fix.
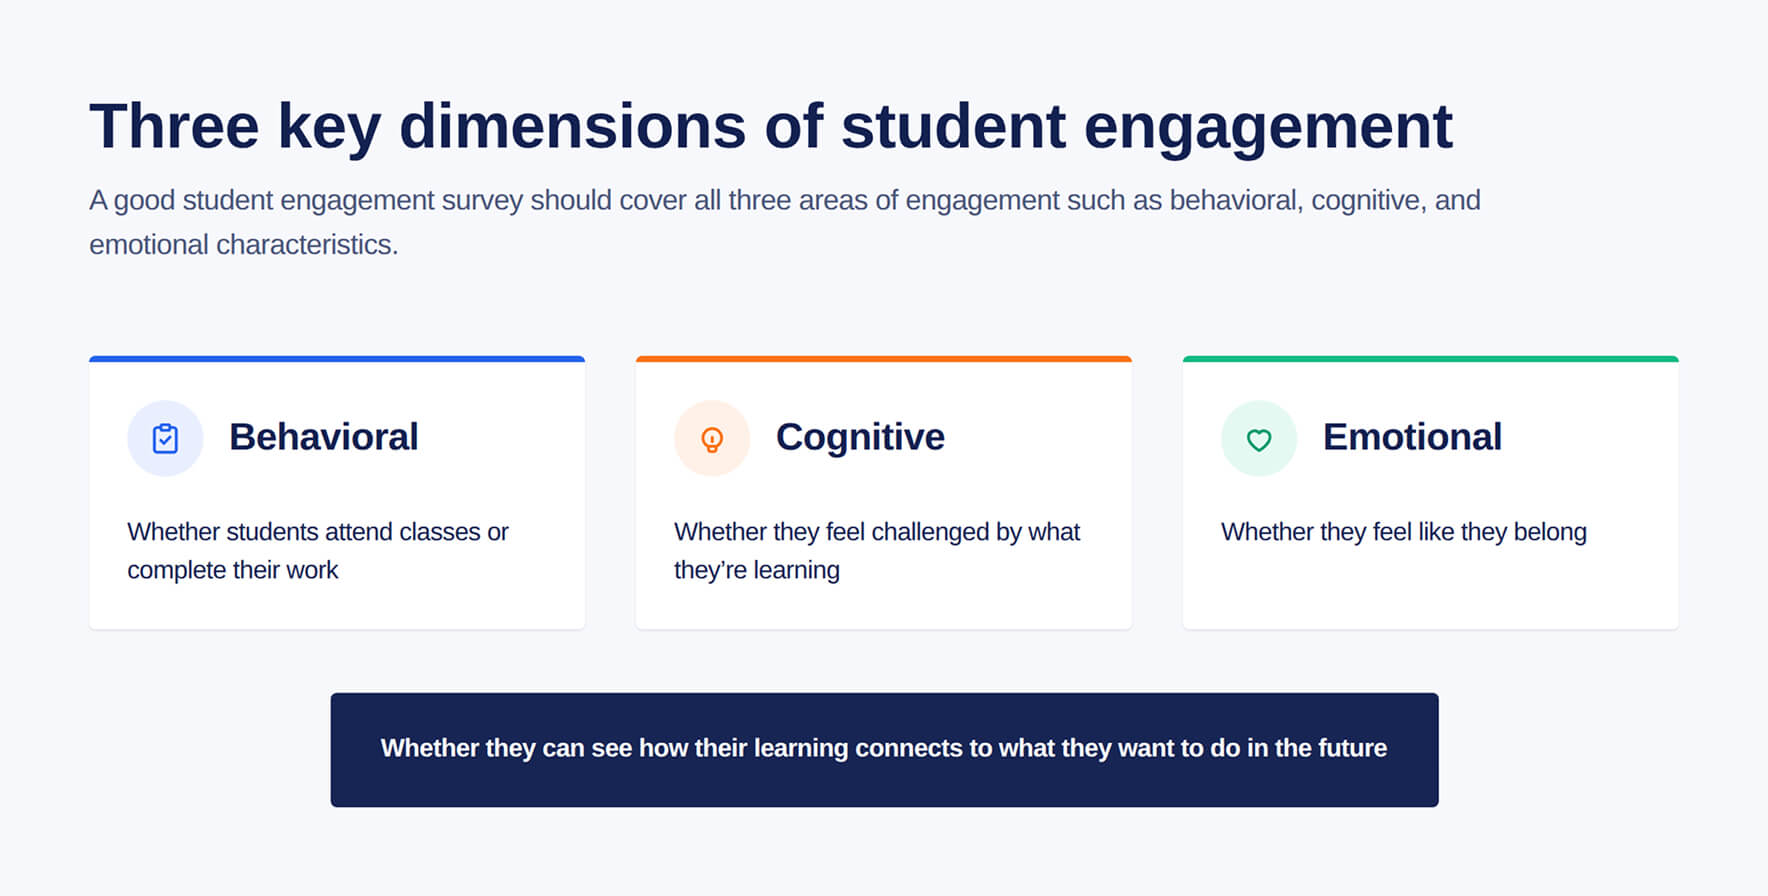
Three key dimensions of student engagement
Understanding student engagement is harder than analyzing grades or attendance because it involves learning about internal states and real student experiences. That is exactly why surveys are the most effective tool available for this purpose. Here, let us look at the three key dimensions of gauging student engagement using surveys.
Factors to measure in student engagement
A good student engagement survey should cover all three areas of engagement such as behavioral, cognitive, and emotional characteristics. That means looking beyond whether students attend classes or complete their work. It should also find out:
- Whether they feel challenged by what they’re learning
- Whether they feel like they belong
- Whether they can see how their learning connects to what they want to do in the future
It should also measure institutional factors. The NSSE instrument, for example, does not just ask how students feel. It asks what they are actually doing, how the institution is structuring their learning experience, and which specific practices and opportunities they are or are not accessing. This gives educators actionable data tied to specific program or policy choices.
Choosing the right measuring frequency
A single annual survey only tells you how students feel at that particular point in time. It won’t show when engagement started to drop, what experience may have caused it, or whether something the institution changed actually helped. Shorter pulse surveys at different points in the semester, combined with a more detailed annual survey, give institutions a better view of what’s changing and enough time to do something about it.
The importance of segmentation
An average engagement score across the whole student body can hide a lot. Overall engagement might look healthy while a particular year group, department, or student population is struggling across several areas. Breaking the results down by year level, major, course load, first-generation status, or housing situation makes it easier to see where the problems actually are and where a targeted response may be needed.

Examples of student engagement survey questions
Student engagement survey questions should map to what you actually want to understand and, more importantly, what you are prepared to act on.
Behavioral engagement:
- How often do you actively participate in class discussions?
- How many hours per week do you spend on coursework outside of class?
- Have you spoken with a faculty member outside of class in the past month?
Cognitive engagement:
- Does your coursework make you think about things in new ways?
- How often do you work on assignments because you’re genuinely interested, rather than simply trying to get them done?
- Do you see a connection between your courses and what you want to do after graduation?
Emotional engagement:
- Do you feel like you belong at this institution?
- Is there a faculty or staff member who takes a genuine interest in how you’re doing and where you want to go?
- How connected do you feel to the other students in your program?
Institutional factors:
- Do you feel like you can get the academic support you need when you need it?
- How clearly does the institution communicate what’s expected of you and what opportunities are available?
- What’s one change that would make your experience here better?
That last open-ended question consistently produces the most specific and actionable responses in any student engagement survey. Scaled questions tell you where the problem is. Open-ended responses tell you what is actually behind it.
Improving student engagement: what the data points toward
The insight is only useful if it leads somewhere. When student engagement survey results come in, the analysis should answer three questions: where is engagement weakest, what is driving it, and who is responsible for addressing it.
A few patterns show up again and again in engagement research:
Transition points are a higher-risk period. The move from first year to second year can be a difficult point for engagement, and the final year can bring another dip as students start thinking about life after college. Checking in with students around these stages gives institutions a chance to spot problems while they’re still manageable.
Faculty relationship matters a lot.Gallup’s research has repeatedly found that having a teacher or professor who makes learning interesting is strongly linked to student engagement. That gives institutions something they can actually work on. Faculty development, smaller classes at key stages, and more opportunities for students to interact with instructors can all play a meaningful role in keeping students engaged.
Belonging matters more than most institutions account for. Students who feel they do not belong (whether because of their background, their identity, or simply because they have not found people with similar interests or an encouraging nature) disengage at higher rates. Survey data that reveal low belonging scores in a particular demographic group point to something structural that needs to be addressed.
Improvement requires closing the loop. Students who complete engagement surveys and never see any visible change in their experience stop completing them and stop believing the institution takes their input seriously. Sharing what the survey found, at an aggregate level, and communicating what the institution is doing in response is as important as running the survey in the first place.
Running student engagement surveys with Zoho Survey
For institutions running engagement research across different departments, year levels, and student groups, managing the surveys can become a problem in itself. Creating separate surveys for different audiences, sending them at the right point in the academic calendar, and comparing results across different groups is difficult to keep up with manually. A one-off form usually isn’t enough for that kind of work.
Zoho Survey’s branching and logic features let student engagement surveys adapt based on factors such as year level, program, or previous answers. So, a first-year student can follow a different set of questions from a senior. Surveys can also be scheduled around specific points in the academic calendar, while cross-tabulation reports allow institutions to compare results across departments, demographic groups, or survey periods.
If an institution is running the same survey over several semesters, keeping the core questions the same makes the results easier to compare. You can look back at each round and see where student responses have changed rather than treating every survey as a separate exercise.