
In the early 1980s, Marriott Corporation was looking for a new path to growth. The company wanted to launch a hotel brand that would appeal to both business and leisure travelers, but success depended on answering a difficult question: Which features would customers value enough to influence their booking decisions?
Instead of relying on assumptions or asking people what they liked, Marriott evaluated how customers made trade-offs between attributes such as room quality, food services, amenities, security, and price.
The insights shaped the development of Courtyard by Marriott, a brand designed around the combination of features customers preferred most. Its successful launch demonstrated a lesson that still holds true today: customers rarely make decisions based on a single feature. Every purchase involves balancing benefits against compromises.
Conjoint analysis is the market research technique built to uncover those trade-offs, helping businesses understand what customers truly value and make better decisions about product design, pricing, and positioning before bringing an offering to market.
What is conjoint analysis?
Conjoint analysis is a quantitative market research technique that measures consumer preferences by presenting respondents with a series of product or service configurations (each varying across multiple attributes) and asking them to evaluate, rank, or choose between them. The analysis then decomposes those choices to estimate the weight, or utility, that respondents place on each attribute and each level within it.
Conjoint analysis makes implicit trade-off reasoning explicit and measurable. When a customer chooses Option A over Option B in a conjoint exercise, they are revealing that the combination of attributes in A is more valuable to them than the combination in B. The statistical modeling applied to those choices across many respondents and many option sets produces precise estimates of how much each attribute drives that value.
Conjoint analysis has become one of the most commonly used quantitative market research methods, successfully employed across a wide variety of industries to quantify consumer preferences for products and services, according to Harvard Business Review's technical guide to conjoint methodology. Its applications span product design, pricing strategy, feature prioritization, packaging decisions, and competitive positioning or anywhere that customers make trade-offs among options with multiple varying characteristics.
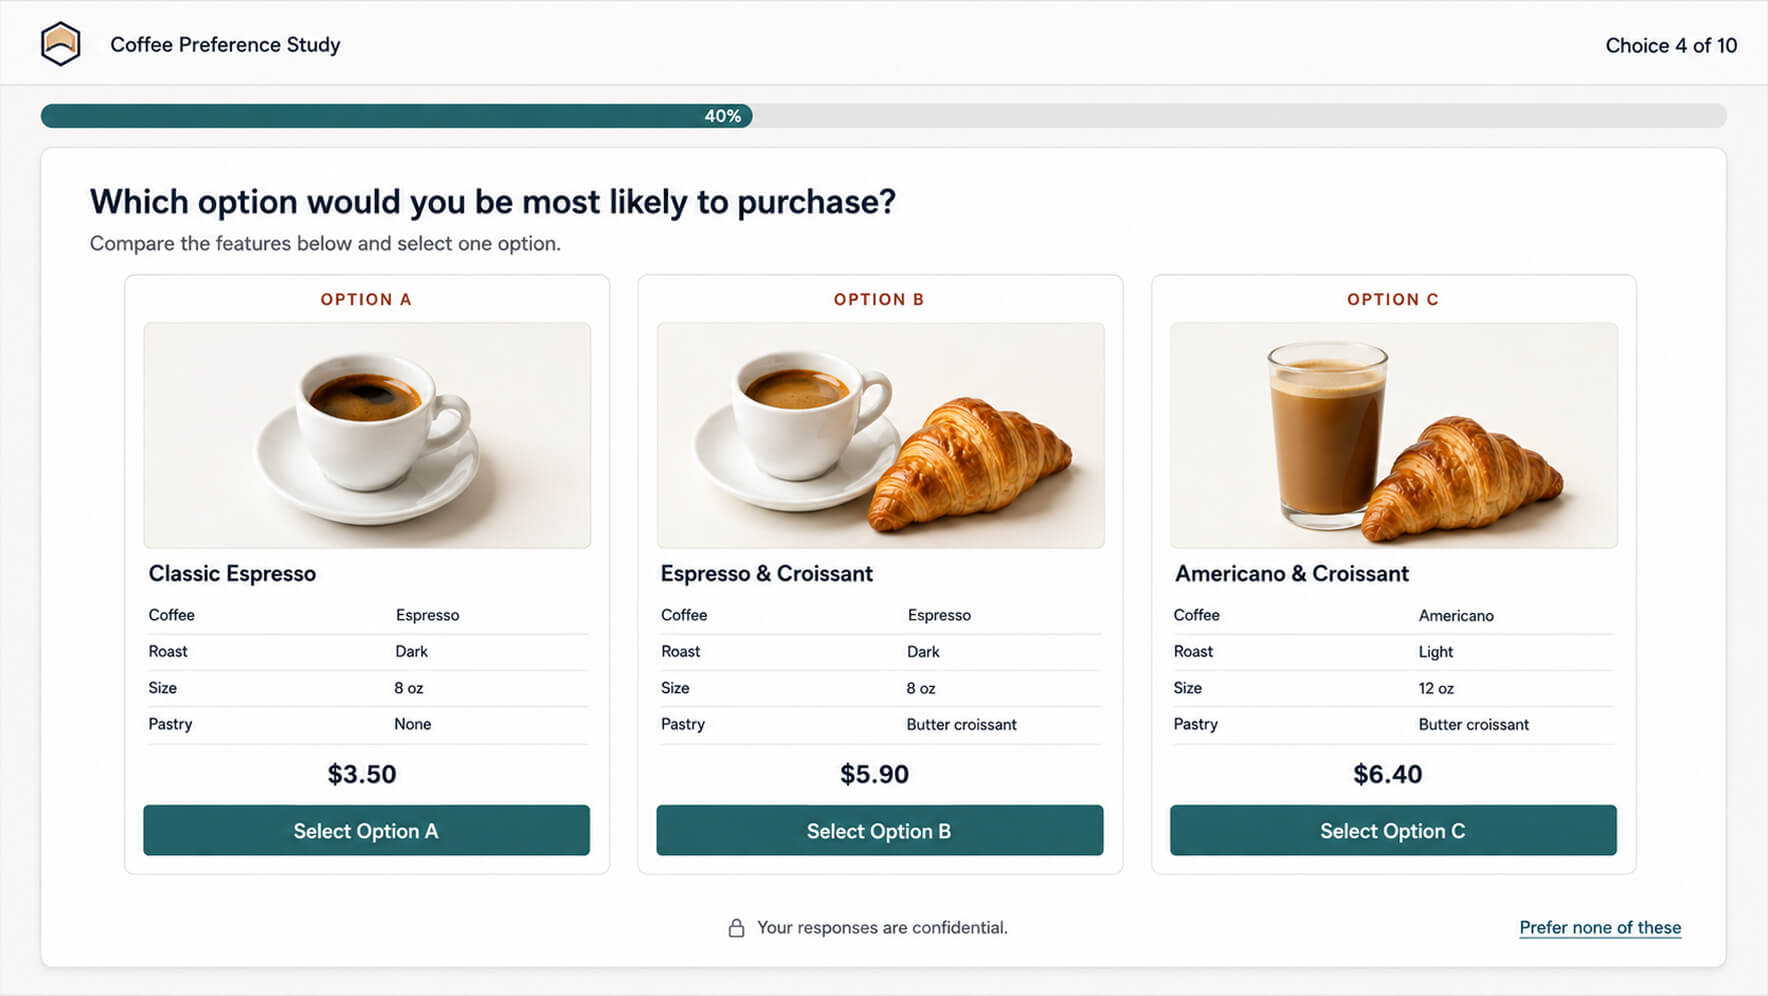
How conjoint analysis connects to price sensitivity research
If you've read our companion article on price sensitivity analysis, you'll recall that conjoint analysis was introduced there as the third survey method for understanding willingness to pay alongside the Van Westendorp Price Sensitivity Meter and Gabor-Granger. This article goes deeper into how conjoint analysis actually works, how to design a conjoint analysis survey, and when it is the right tool for your specific research question.
The core distinction from the other pricing methods is this: Van Westendorp and Gabor-Granger measure price sensitivity in isolation. They ask about price directly, which is useful but limited. Because in real markets, customers don't evaluate price in isolation. They evaluate price as one attribute among several, in the context of a specific product configuration.
Conjoint analysis for pricing works by including price as one of several attributes in the choice exercise. The result is not just a willingness-to-pay estimate but a nuanced understanding of how price sensitivity changes depending on which other attributes are present.
A customer may be relatively insensitive to price for a product that includes a specific feature they care about deeply, and highly sensitive to the same price difference for a version of the product without it. That interaction is invisible to direct pricing methods and visible only through conjoint design.
Types of conjoint analysis
Several distinct conjoint analysis approaches are used in market research. The choice between them depends on the research objective, the number of attributes being studied, and the level of statistical precision required.
Choice-based conjoint analysis (CBC)
Also called discrete choice conjoint, CBC is the most widely used format in commercial market research. Respondents are shown sets of product options and asked to choose which they would buy, or to choose "none of the above." Because the task mirrors an actual purchase decision like selecting among alternatives, it tends to produce high face validity and realistic preference data. Choice-based conjoint analysis is the standard for most product design and pricing research.
Rating-based conjoint
This method presents respondents with product profiles one at a time and asks them to rate each on a scale. It is simpler to design and easier to complete but is less predictive of real purchase behavior than choice-based formats, since rating is a less demanding cognitive task than choosing.
Adaptive conjoint analysis (ACA)
The ACA method adjusts the product profiles shown to each respondent based on their previous answers, making the exercise more efficient for studies with many attributes. It is useful when the attribute space is too large for a fixed choice-based design but requires more sophisticated survey software to implement.
Max-diff conjoint (best-worst scaling)
Finally, the Max-diff conjoint method asks respondents to identify the most and least important items from a set, across multiple sets. It is most useful for attribute importance ranking when the research goal is prioritization rather than pricing.
For most product and pricing applications, choice-based conjoint analysis is the right starting point.
How to do conjoint analysis: a step-by-step approach
Step 1: Define the attributes and levels
The first design decision in any conjoint analysis survey is which product attributes to include and what levels each attribute will take. Attributes are the dimensions of the product that vary. For example, price, brand, battery life, delivery speed, warranty. Levels are the specific values each attribute can take. For price, that might be $49, $79, $109; for warranty, it might be one year, two years, or three years.
The number of attributes matters. More attributes require more choice tasks to produce stable utility estimates, which increases respondent burden and dropout risk. Most practitioners recommend limiting conjoint studies to four to six attributes for choice-based designs. These are enough to capture meaningful trade-off complexity without overwhelming respondents.
Step 2: Design the choice tasks
Each choice task presents respondents with a set of product profiles (typically two to four options) and asks them to choose. The combination of attribute levels shown in each profile is determined by an experimental design algorithm that ensures all attributes and levels are represented an appropriate number of times across the full set of tasks, and that the effects of individual attributes can be statistically separated from each other.
Step 3: Determine the number of tasks per respondent
Most choice-based conjoint studies use 8 to 15 choice tasks per respondent. Fewer tasks reduce statistical efficiency; more tasks increase fatigue and dropout. The right number depends on the number of attributes and levels and the desired precision of the utility estimates.
Step 4: Recruit the right sample
As with all quantitative research, the quality of a conjoint analysis depends critically on whether the respondents reflect the actual target market. A conjoint study on enterprise software pricing conducted with a general consumer sample produces decorative numbers rather than actionable insight. Sample composition should mirror the buying audience as closely as the available panel allows.
Step 5: Run the analysis
Conjoint data is analyzed using regression or hierarchical Bayes modeling to estimate utility values for each attribute level. These utilities called part-worths quantify the relative value respondents place on each option within each attribute. The part-worths are then used to simulate market share predictions for different product configurations, identify the revenue-maximizing price point, and estimate the feature set that maximizes preference across the target market.
Using Zoho Survey for conjoint analysis research
Zoho Survey supports the design elements that conjoint analysis research requires including:
- Structured question formats that can present side-by-side product profiles
- Radio button or selection responses for choice tasks
- Question sequencing and logic needed to deliver multiple choice tasks across a single survey session.
For teams conducting conjoint studies at scale, Zoho Survey's Buy Responses feature connects researchers with verified panels segmented by demographic, industry, and behavioral attributes. This makes it possible to recruit the specific target audience the study requires without relying on an existing contact list. Real-time reporting tracks completion rates and response patterns as data arrives, allowing researchers to monitor whether the sample is filling as intended and identify any choice tasks with unexpectedly high dropout rates.
Zoho Survey is now available with a 7-day, credit card-free Enterprise trial. Research and product teams have full access to the features needed to design, distribute, and collect conjoint analysis survey data from day one. Get started now!
Wrapping up
Asking customers what they want produces wish lists. Conjoint analysis produces priorities. By forcing respondents to make choices among realistic product configurations, conjoint analysis reveals the attribute weights and price sensitivities that direct questioning cannot access. It is one of the most versatile and rigorous tools in market research, and one of the few that simultaneously informs product design, pricing strategy, and competitive positioning from a single well-designed study. When the research question involves trade-offs, conjoint analysis is almost always the right place to start.