Shape your data
Use Zoho Show's collection of customizable shapes to create well-designed slide decks to captivate your stakeholders. Build innovative flowcharts, infographics, roadmaps, and themes using shapes.

Enhance data with smart elements.
An overabundance of facts and figures can be overwhelming to an audience. Make your company's fact sheets, KPI numbers, or sales figures more compelling with smart elements.
Shape to fit your needs.
Transform any fundamental shape like a square, triangle, or circle using edit points. Design custom vector graphics that will represent your ideas in presentations without enlisting the help of a graphic designer.
Learn more
Draw with pen.
If preset shapes don't fit your content, you can use draw with pen to create your own. Use scribble to draw curves that resemble hand-drawn shapes, or use freeform to draw both straight and curved sections. It's as easy as drawing on paper.
Learn MoreJazz up your shapes.
Format shapes to make your data more prominent and appealing to your target audience by adding color, images, shadows, reflections, and animation. Group objects together to edit them as one, or edit individual elements of a group separately.
Learn More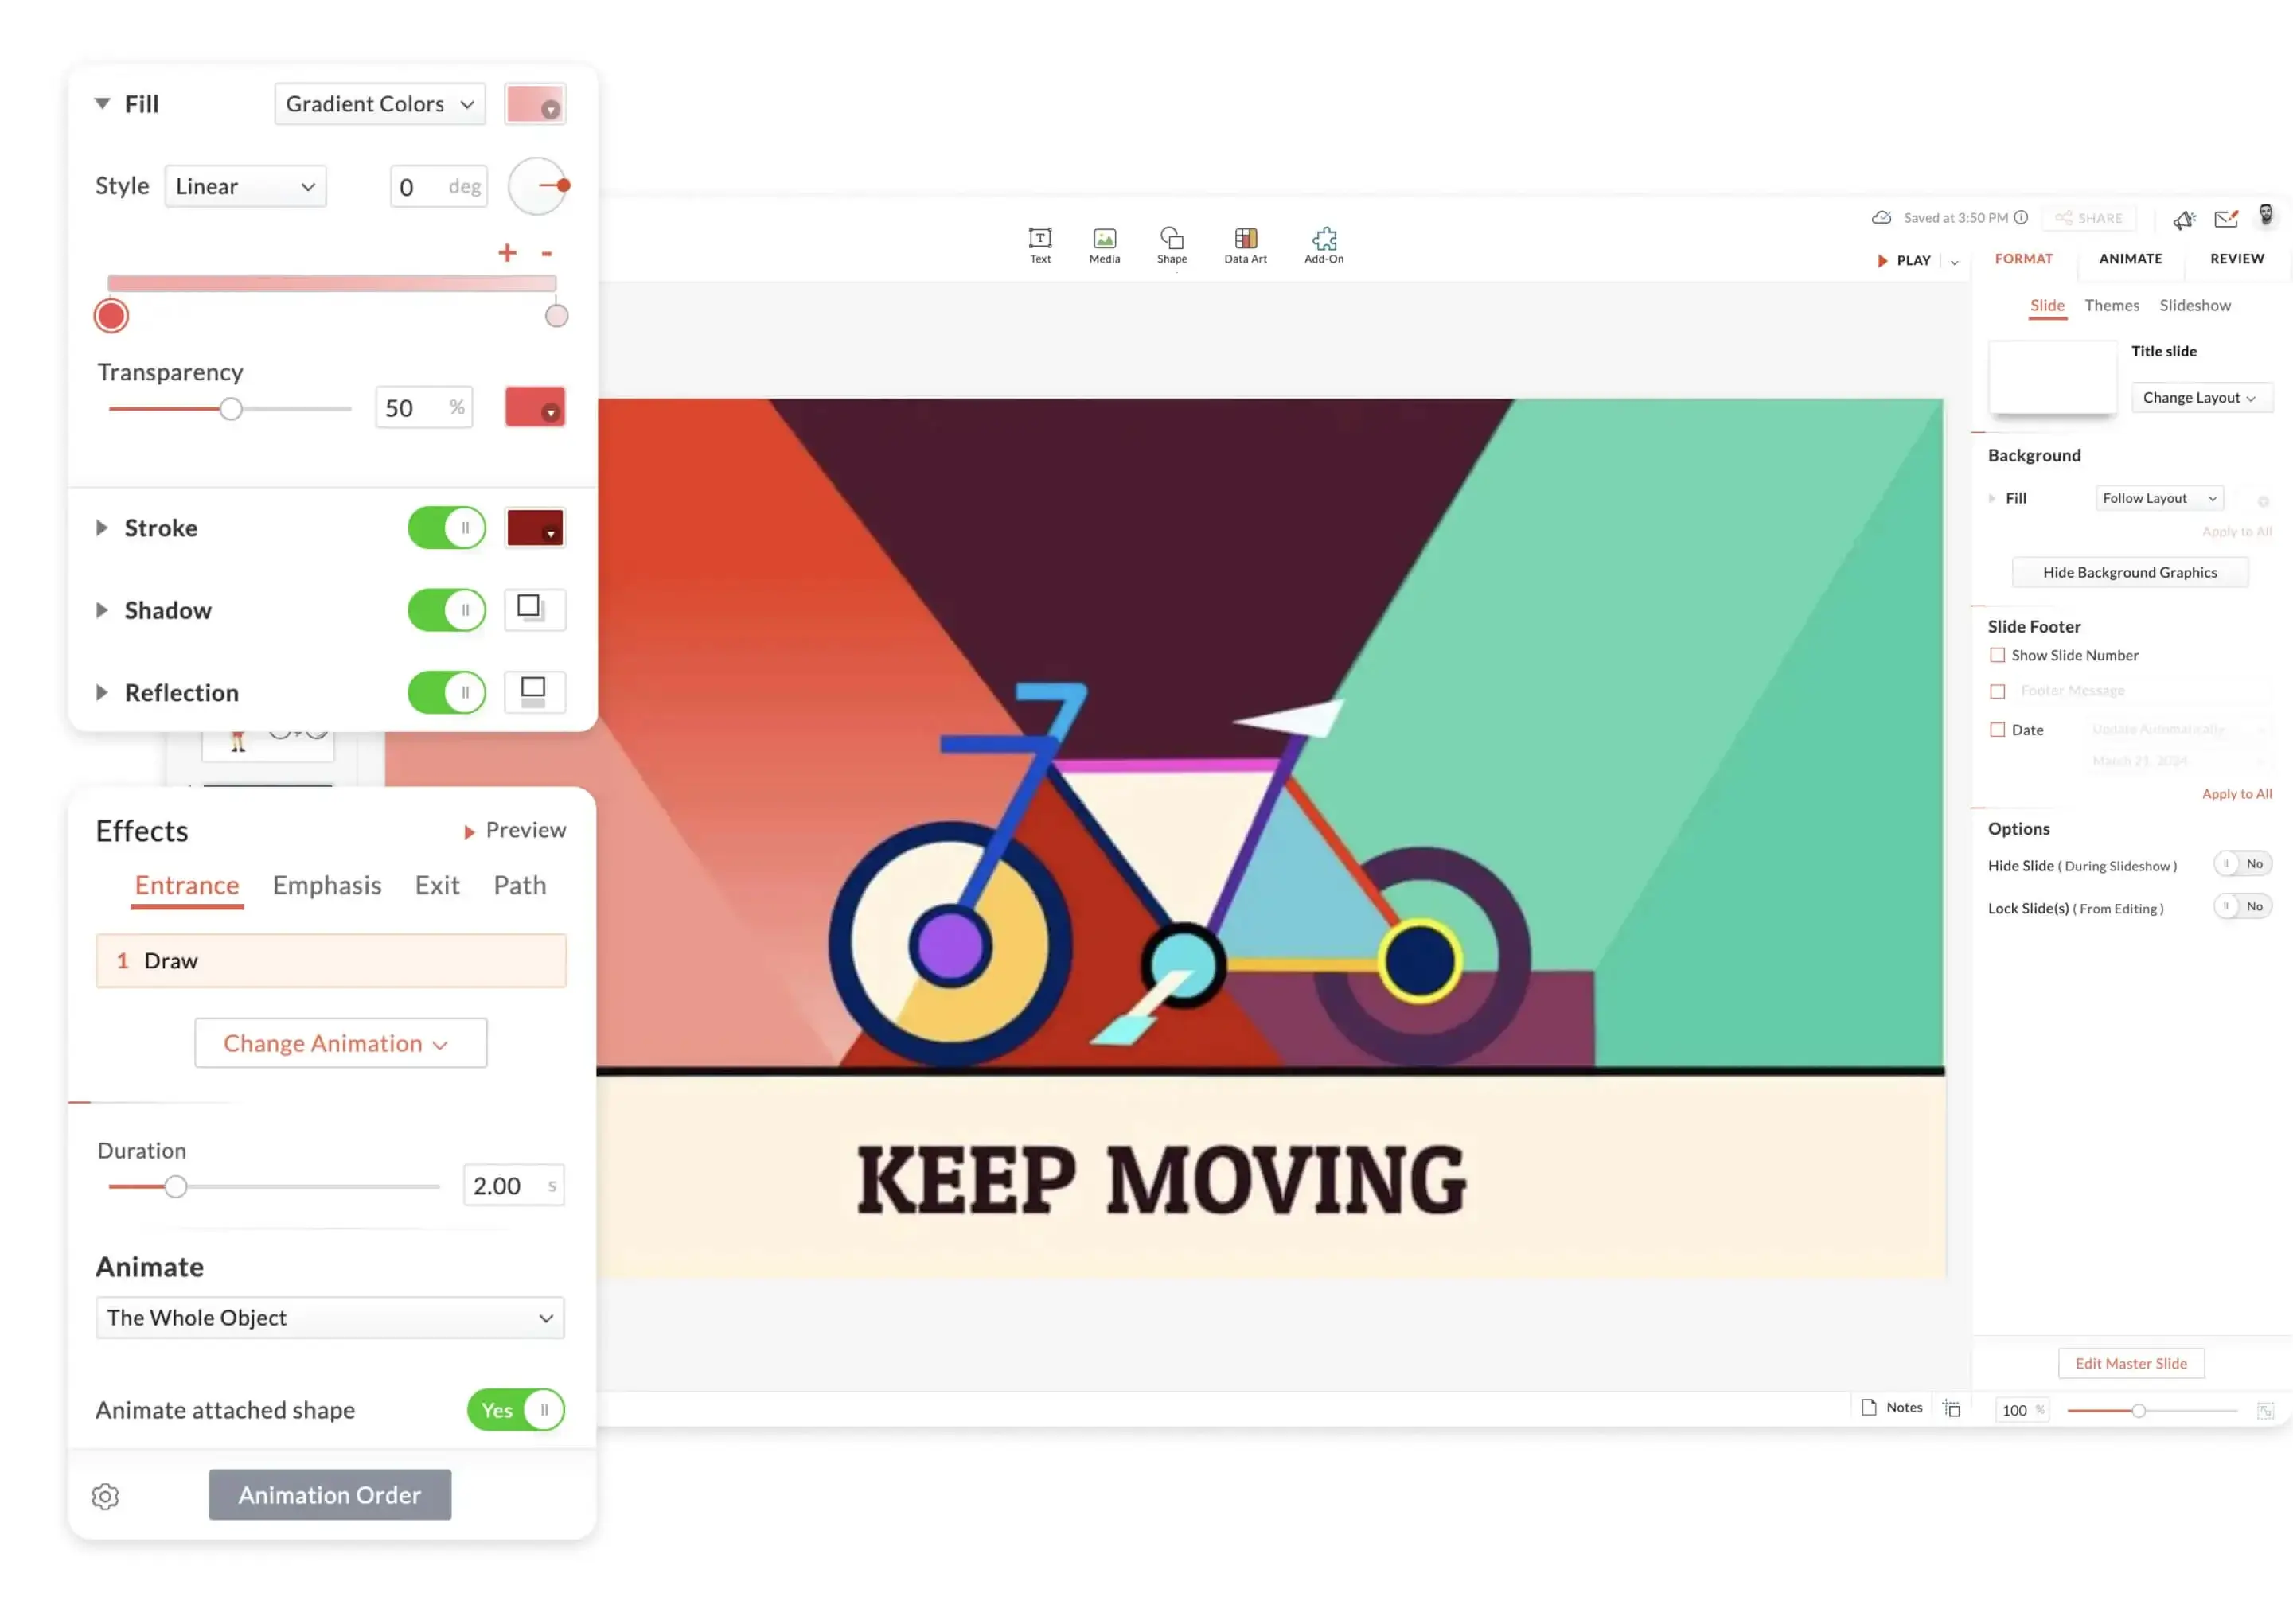
Draw non-stop.
Use Draw Mode to freely sketch, adjust shapes, and style elements in real time. A seamless way to create visually rich presentations without interruptions.
Learn MoreCreate stories with silhouettes.
Zoho Show's silhouettes let you build a story around your content. Create interesting slides using business silhouettes to showcase the steps in the sales cycle, or emotion silhouettes to show how your organization can achieve customer delight.
Learn More