
Visualize data as tables or charts
Transform raw data into dynamic charts and graphs using Data Art.
Showcase data as charts or tables
Present data in a detailed, organized, and structured way using tables in your presentation. Showcase comparisons, display trends, analyze growth patterns, and highlight areas of improvement by displaying values as charts.

Insert data from Zoho Sheets
With the Zoho Sheet integration for Show, you can now seamlessly add data to your slide without exiting or switching between applications. You can choose to display values either as a table or a chart depending on your requirement.

Modify values with Data Fields
Save time and eliminate the tedious task of manually modifying data on every slide. With the Data Fields feature, you can now modify variable data across slides in a presentation without toggling between them.

Choose your chart type
Leverage the power of data visualization to analyze market trends, unlock customer insights, and forecast financial performance and overall data analysis by choosing the appropriate chart type.
Design charts your way
Customize charts to meet your visualization needs.

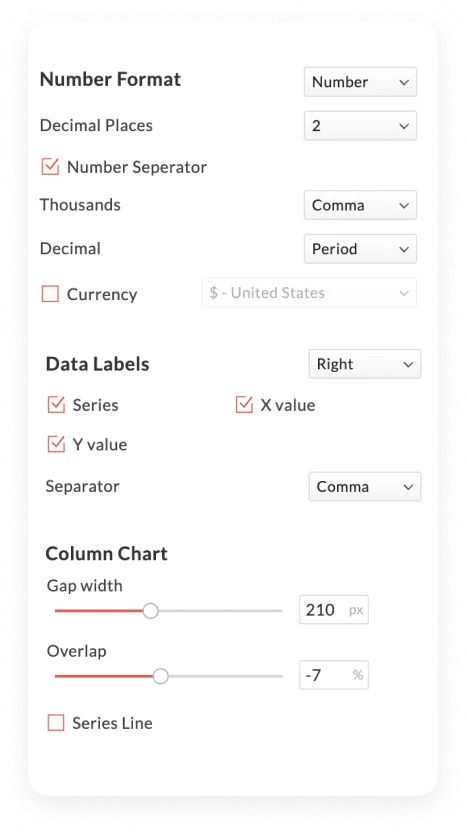

Display data with customizable charts
Customize charts your way with a wide range of formatting options available. Choose a preset of your chart type, pick a suitable number format, set data labels, or even adjust the gap between the data sets as per your requirement.
Format charts in your slide
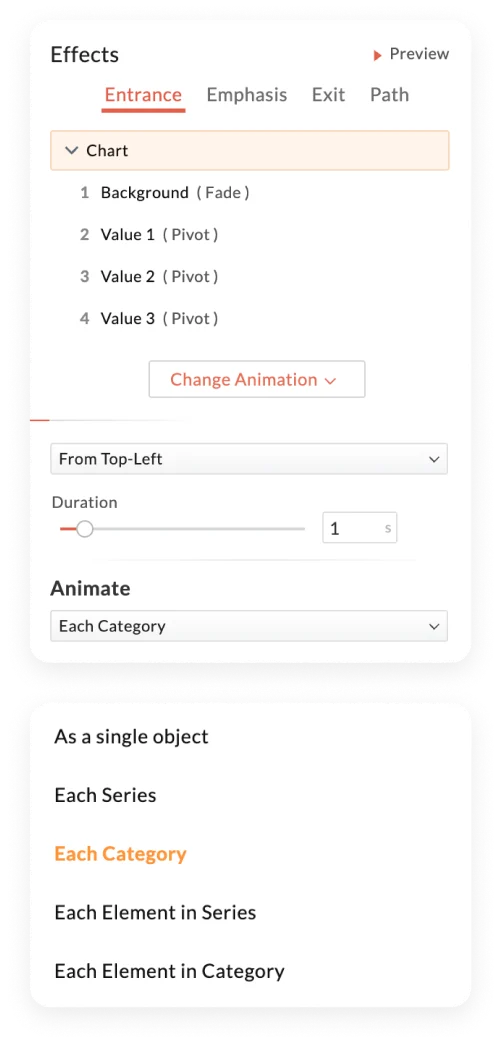
Captivate with a seamless flow of information
Transform your ordinary charts into effective data storytelling with animations. Add a sequence to your data, control the flow of information, and keep your audience captivated and focused on the presentation.
Apply animations to the chart

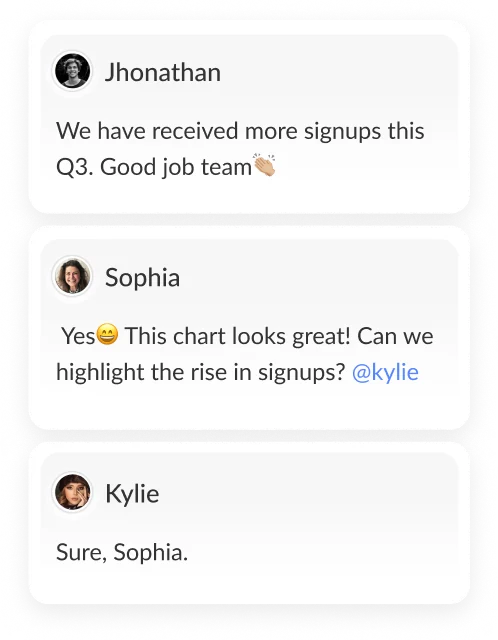

Analyze and discuss trends easily
Whether there is an increase in numbers or a decrease in trends, streamline and share your insights as consolidated feedback. Begin a discussion by adding a comment, reviewing charts together, providing visual inputs, and resolving comments.
Review charts togetherImport existing charts
Already have a chart in another file format?
Import your file without losing its original format and customize them as required.


