Joining Tables
In a reporting system often you might require combining data from two or more tables to get the required information for analysis and reporting. To retrieve data from two or more tables, you have to combine the tables through the operation known as "Joining of tables". Joining is a method of establishing a relationship between tables using a common column.
In Zoho Analytics you can join tables to create reports using one of the following two methods.
Auto-Joining Tables
When you want to create reports using data spanning across multiple tables, Zoho Analytics provides you with a special feature called Auto-Join. This feature automatically joins tables when creating reports, if the tables are connected using a Lookup column. For this feature to work, you need to specify that two tables are related using the Lookup column. To define a lookup relationship between two tables, it is essential that the tables have at least one column which is common between them. Let's look at this further with an example.
Here's an example to illustrate how to define lookup columns and how Auto-Join combines tables while creating reports, based on lookup relationship
"Store Sales Workspace" Model:
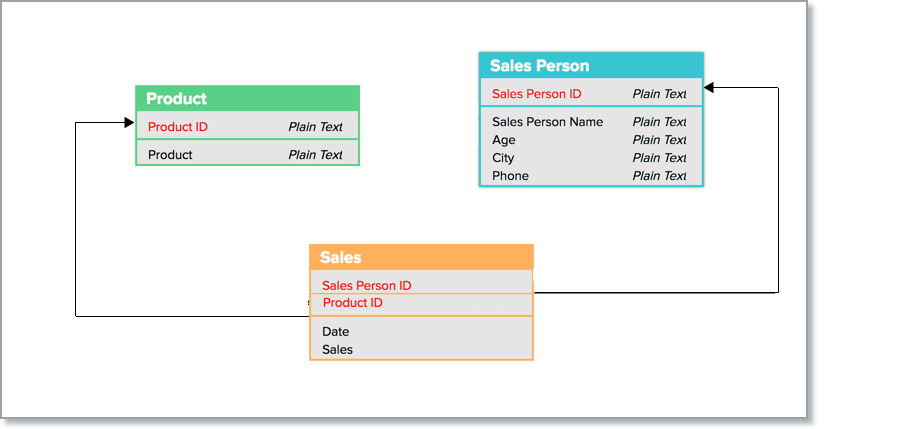
In the Store Sales Workspace model given above, the Sales and Sales Person tables have a common column called Sales Person ID. In the 'Sales' table, every sale is associated to the Sales Person Id, who did the sale. In the 'Sales Person' table, each salesperson is identified by a unique id specified in the column Sales Person ID. Similarly, Sales and Product Details tables have a common column called Product_ID. In the 'Sales' table, each sale is associated with a product identified by the column Product_ID. In the Product table each product is identified by a unique id specified in the column Product_ID.
Given these related columns, we can define lookup relationship between Sales and Sales Person table through the column Sales Person ID. Similarly, between Sales and Product Details tables a lookup relationship can be established based on the common column Product_ID. Once the lookup column relationship is defined Zoho Analytics will automatically join data from these tables using the Auto-join feature when you start creating reports based on these tables. Click here to know more about how Relational Data Modelling works in Zoho Analytics
Defining Lookup
Lookups allow you to link tables based on conditions so that you can pull data from different tables for analysis. Zoho Analytics provides suggestions for lookups based on the metadata, such as column names and data types, to help identify the potential relationships within the table.
From Import Wizard
While importing data into an existing table, Zoho Analytics identifies and matches the new data being imported with the existing table based on the meta information like column name and data type.
- Choose the table to be imported into the workspace.
- Click Join tables on the Data Preview section to define lookups.
- All the possible lookups that can be defined will automatically be listed for the users to review and confirm. Select the lookups to be defined.
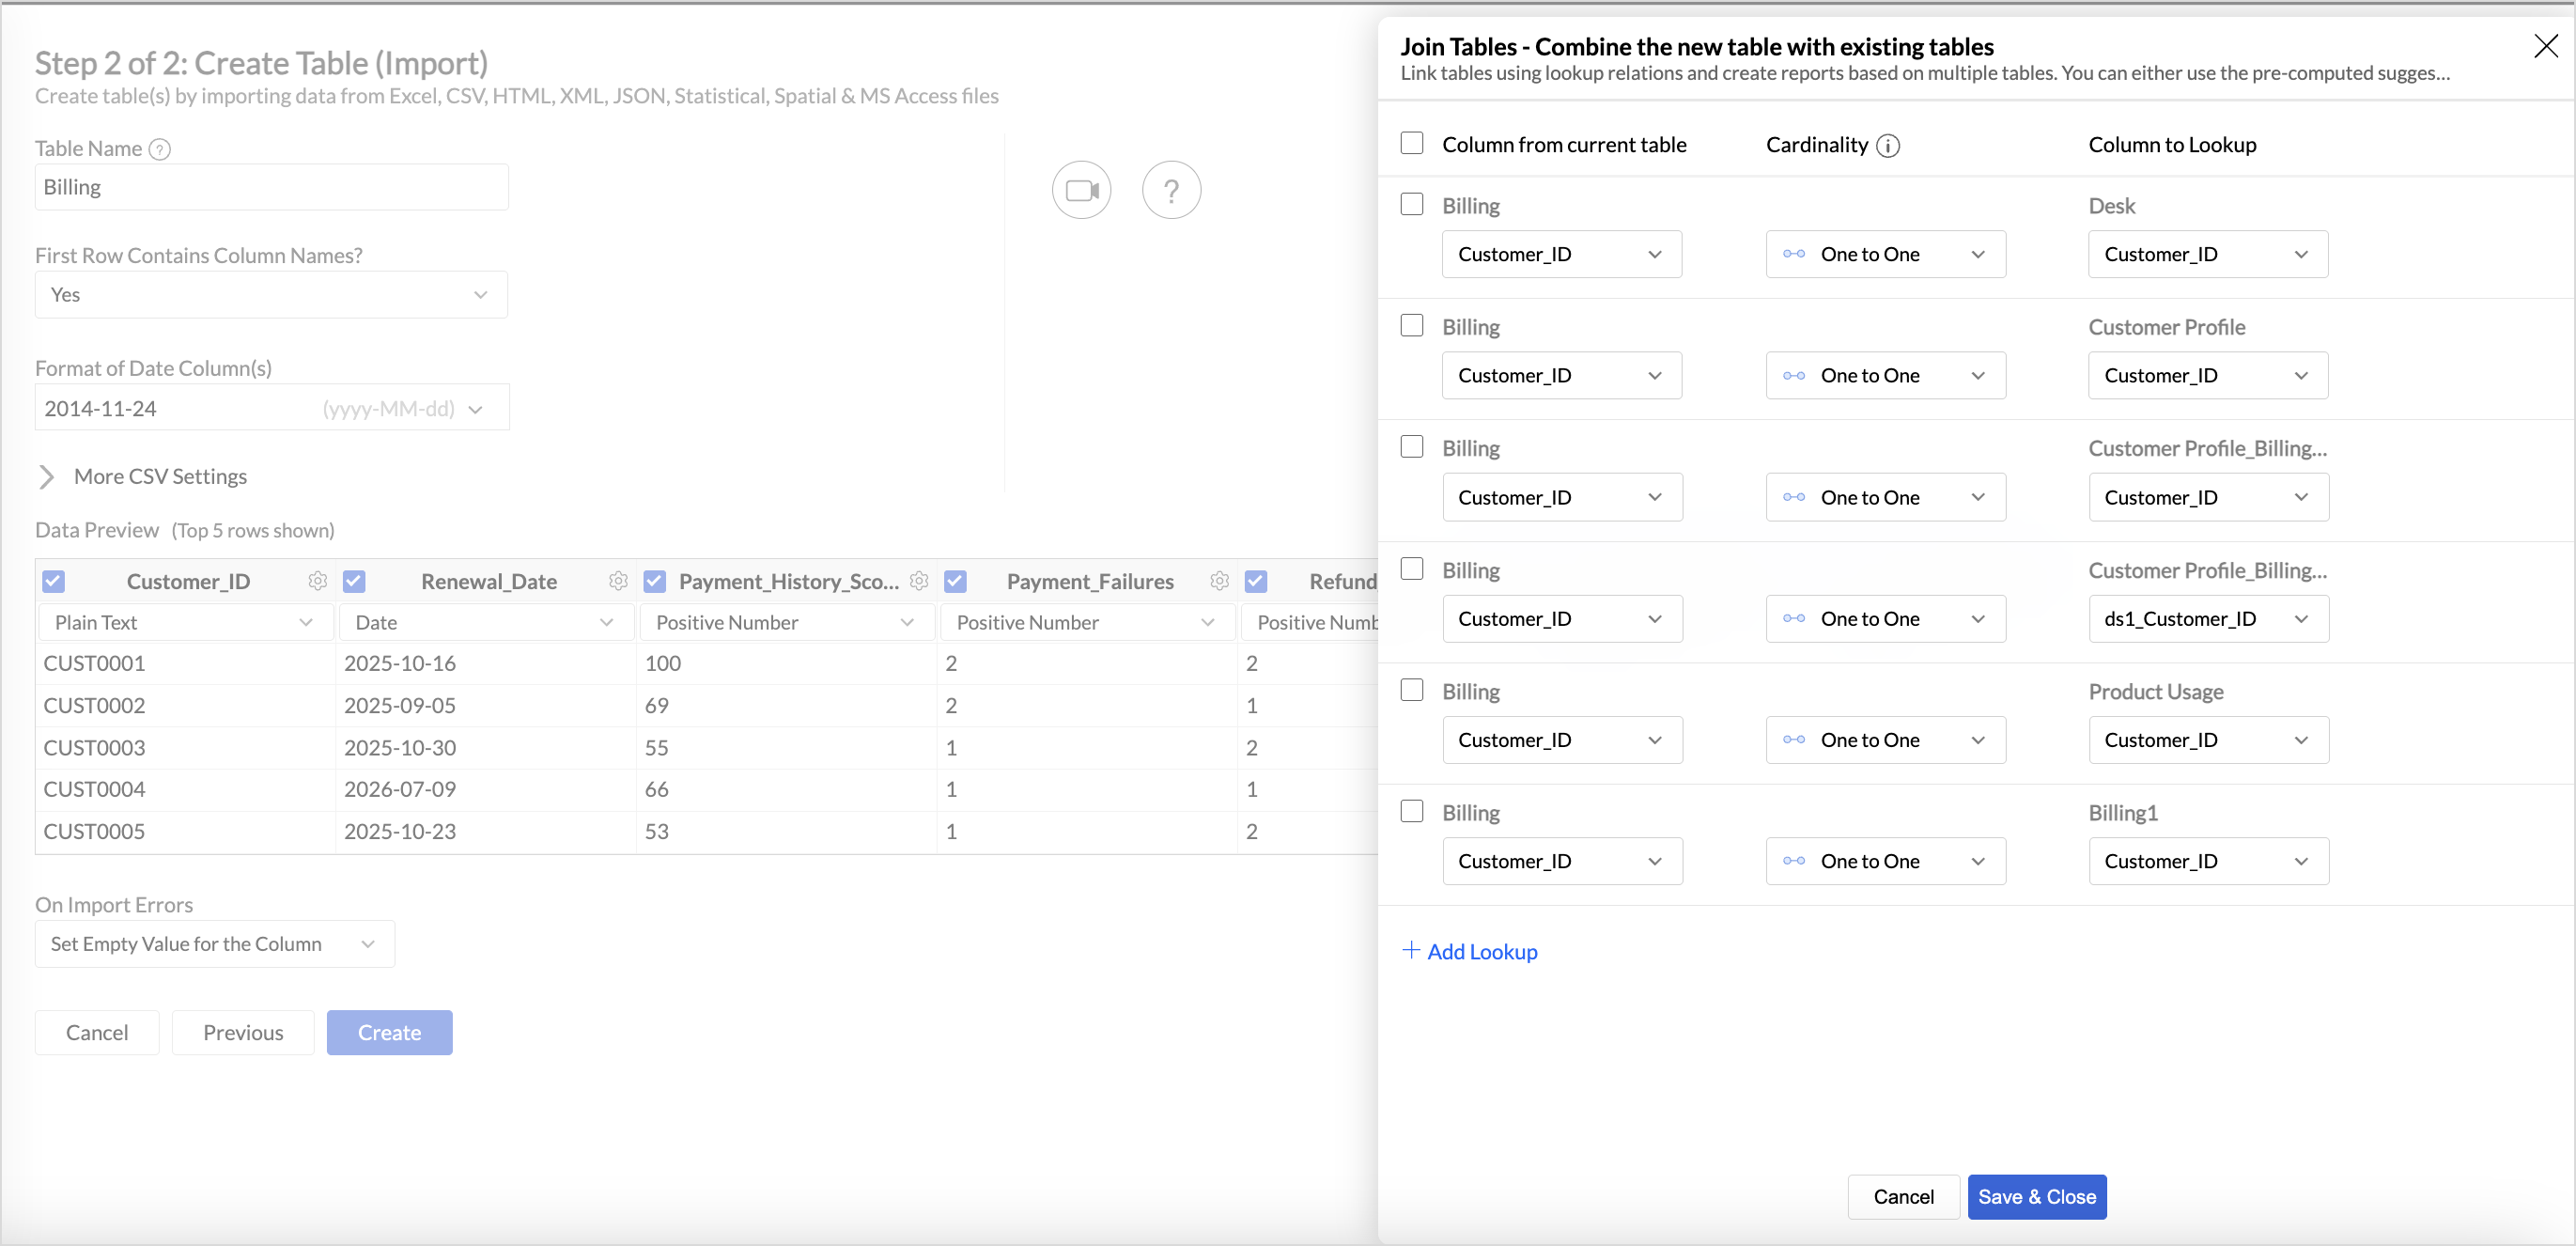
- Click Save and Close.

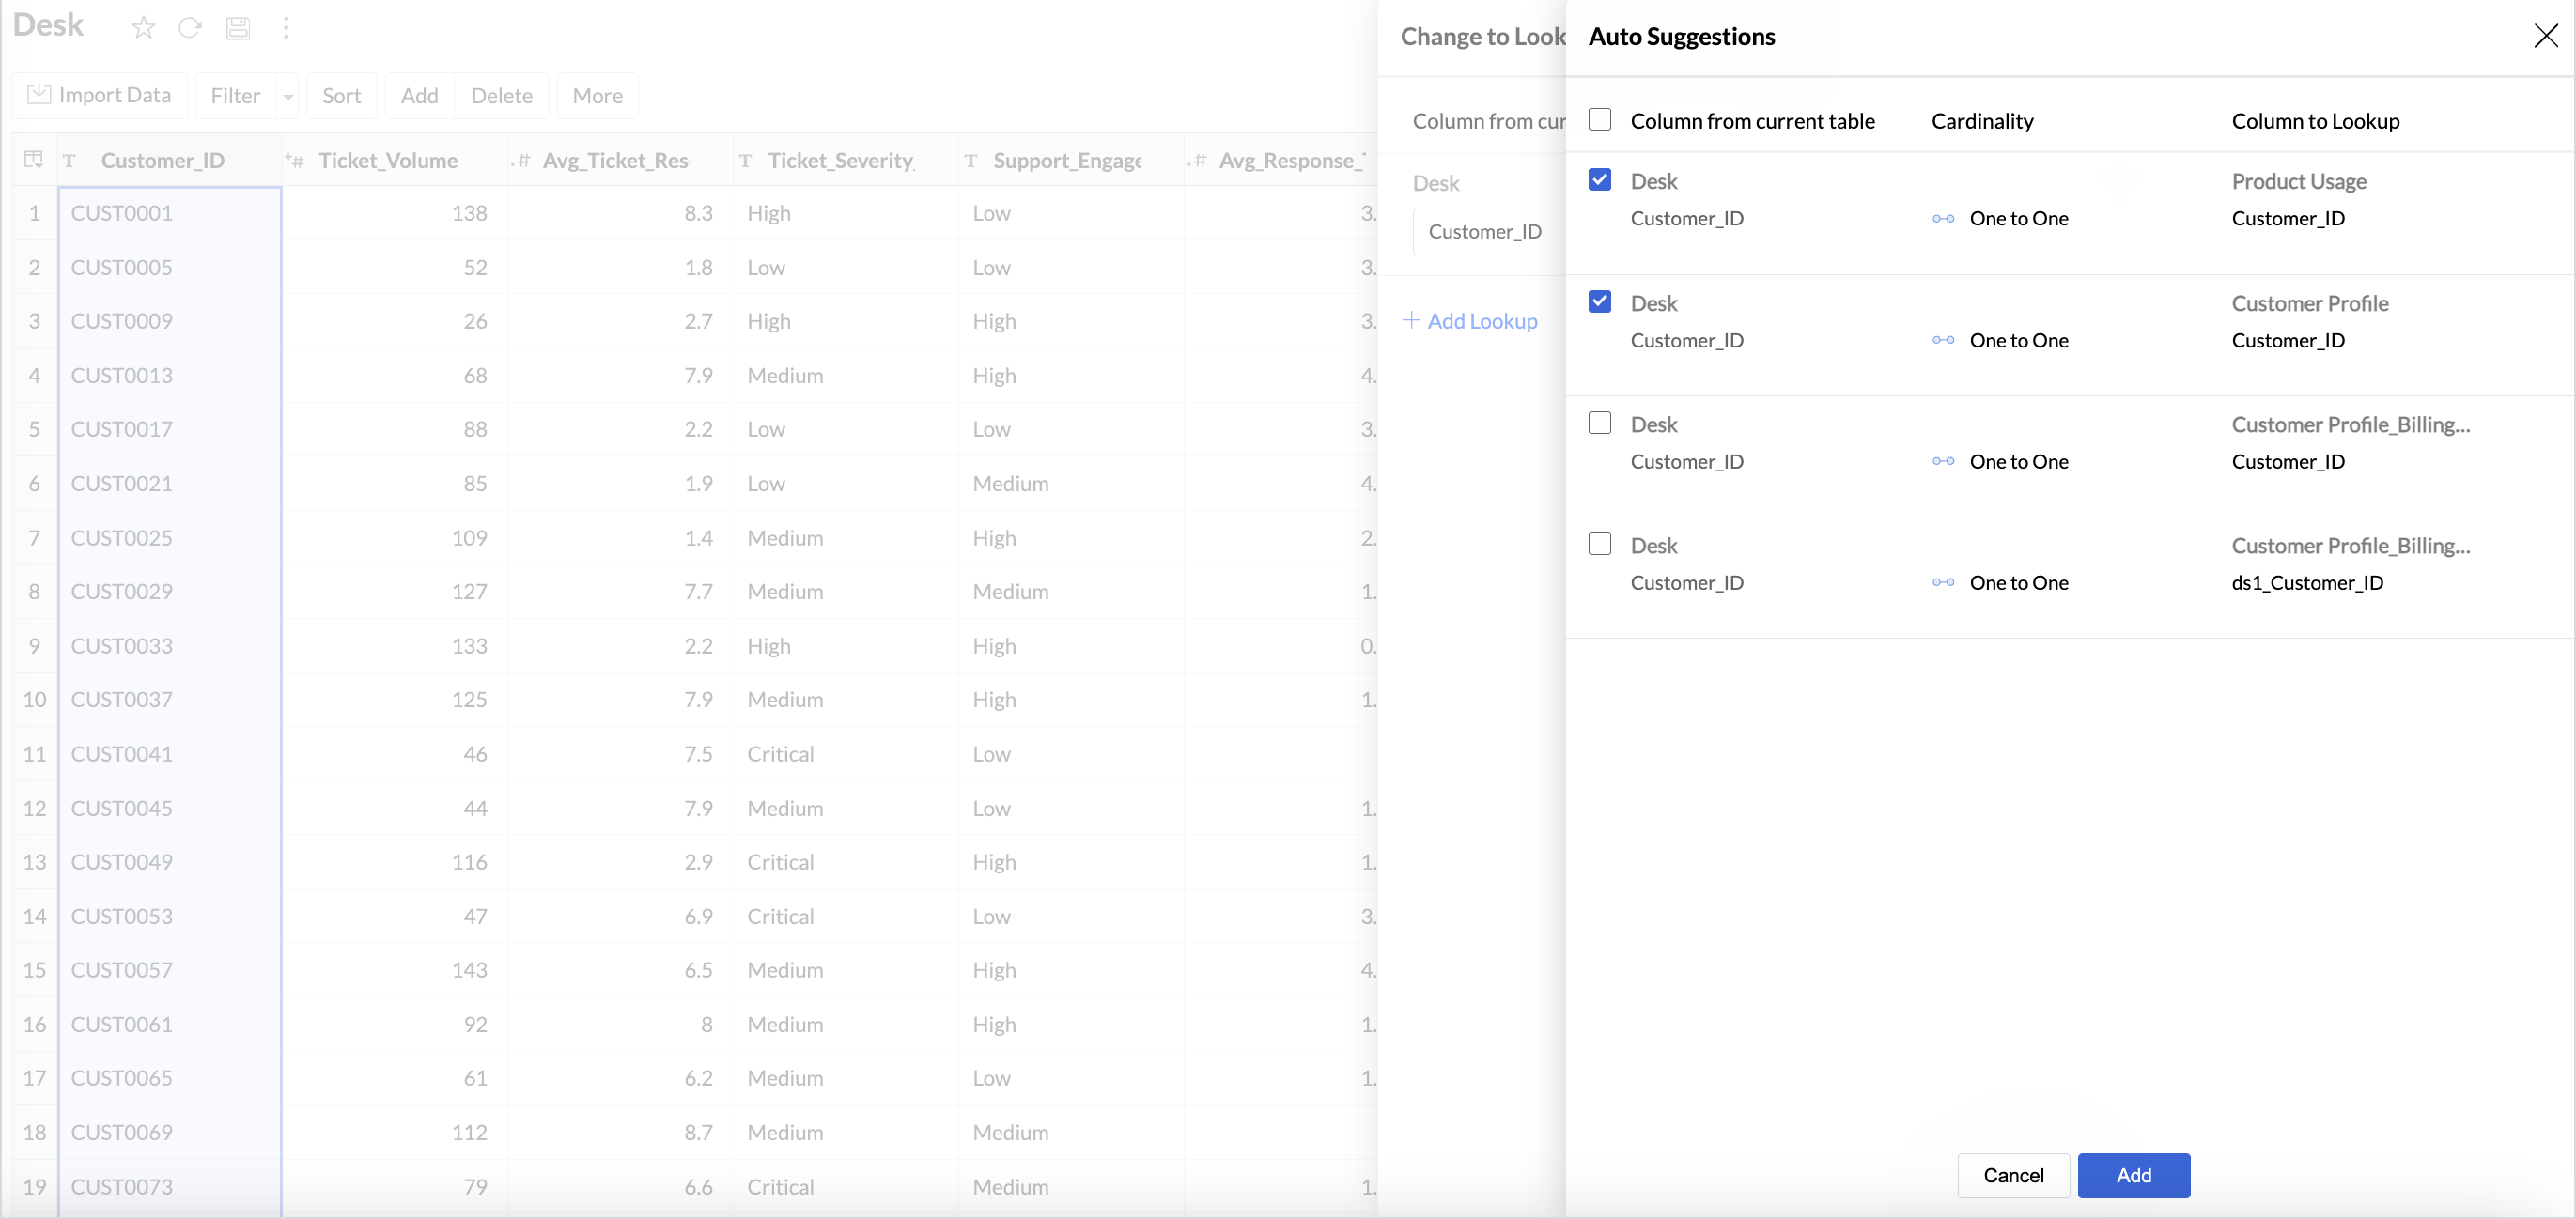
From the Table designer - Using Change to Lookup
- Right click the column name and choose Change to Lookup column from the drop-down menu.
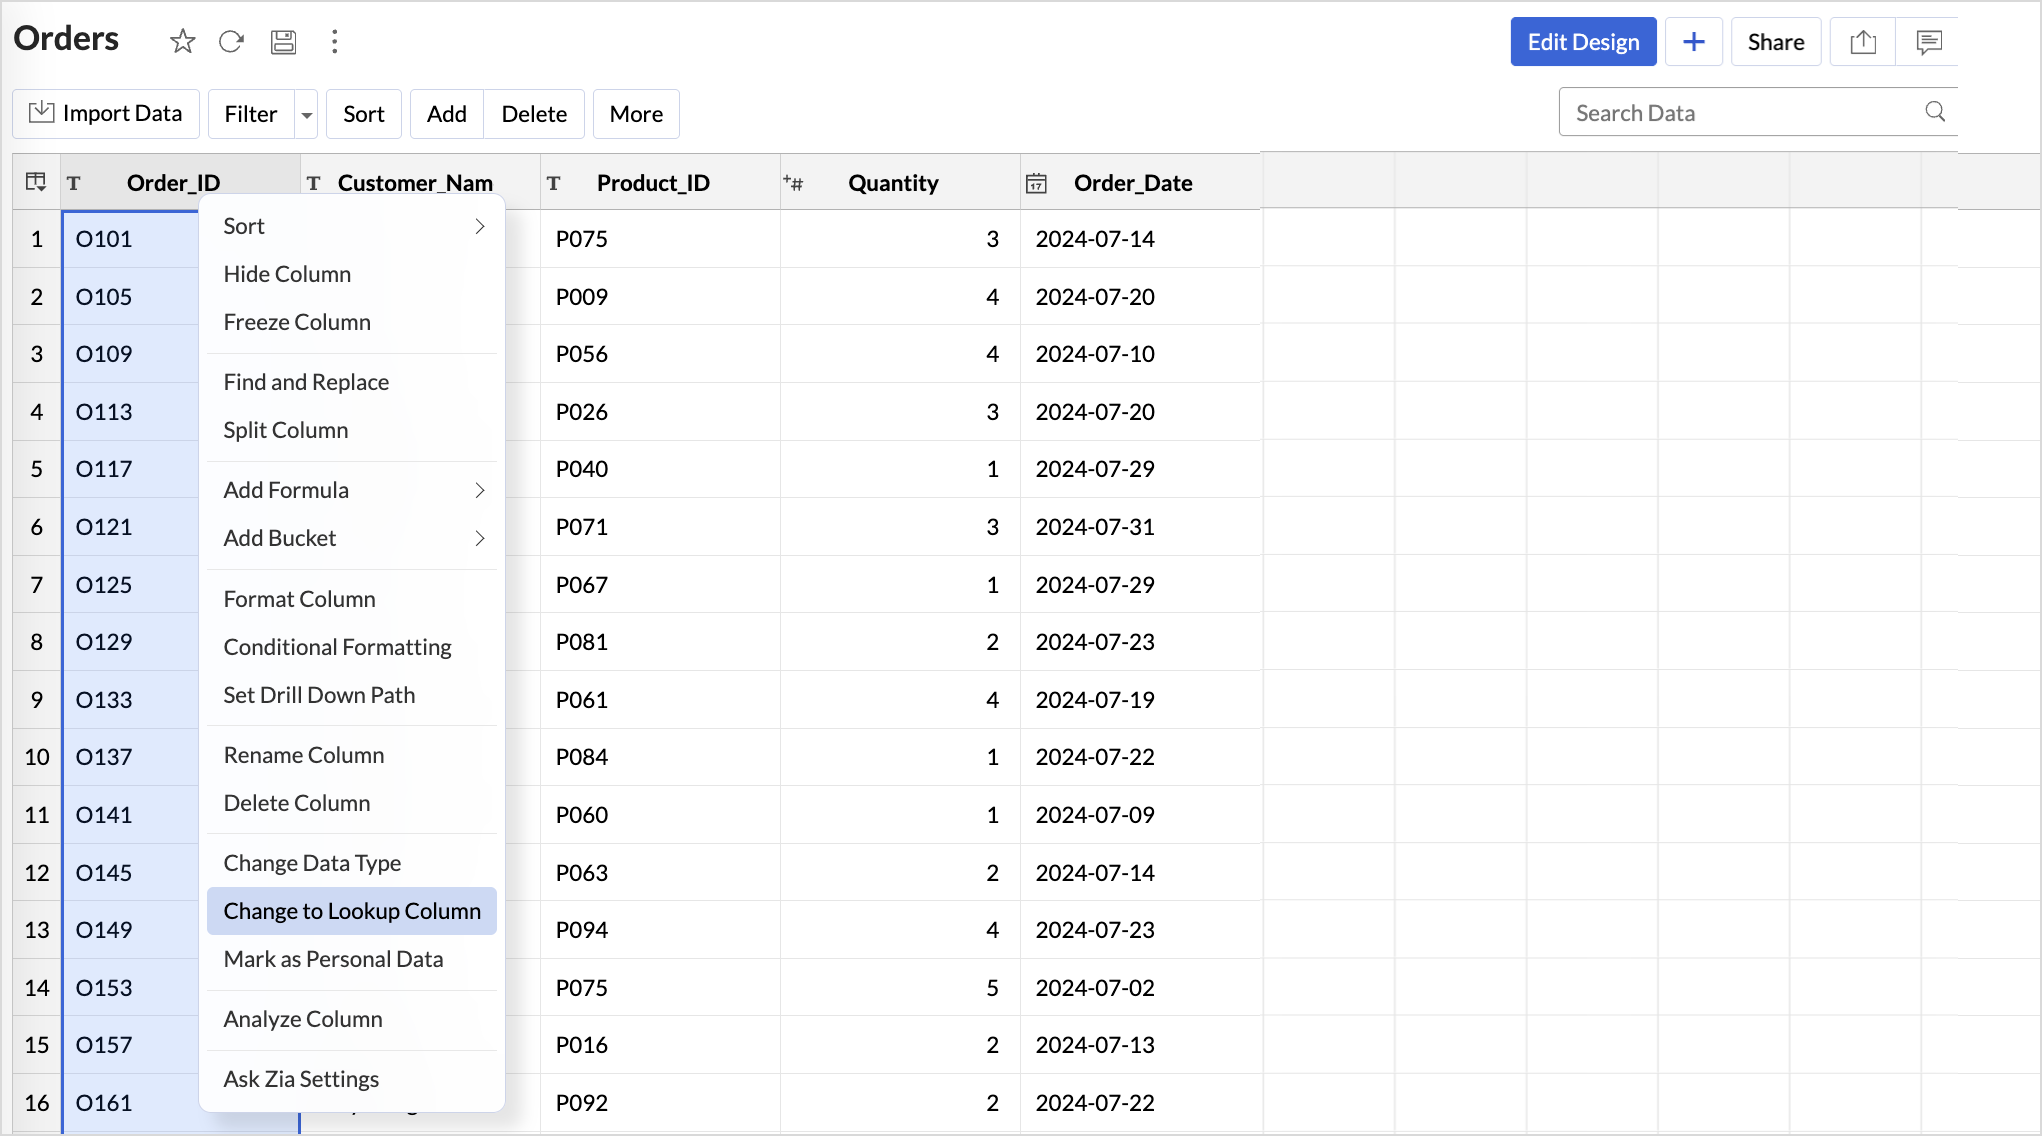
- The selected column is displayed by default for defining the lookup.
- Define the Cardinality function based on the relationship between the columns.
- Select the corresponding column to lookup from the other table to establish the lookup relationship.
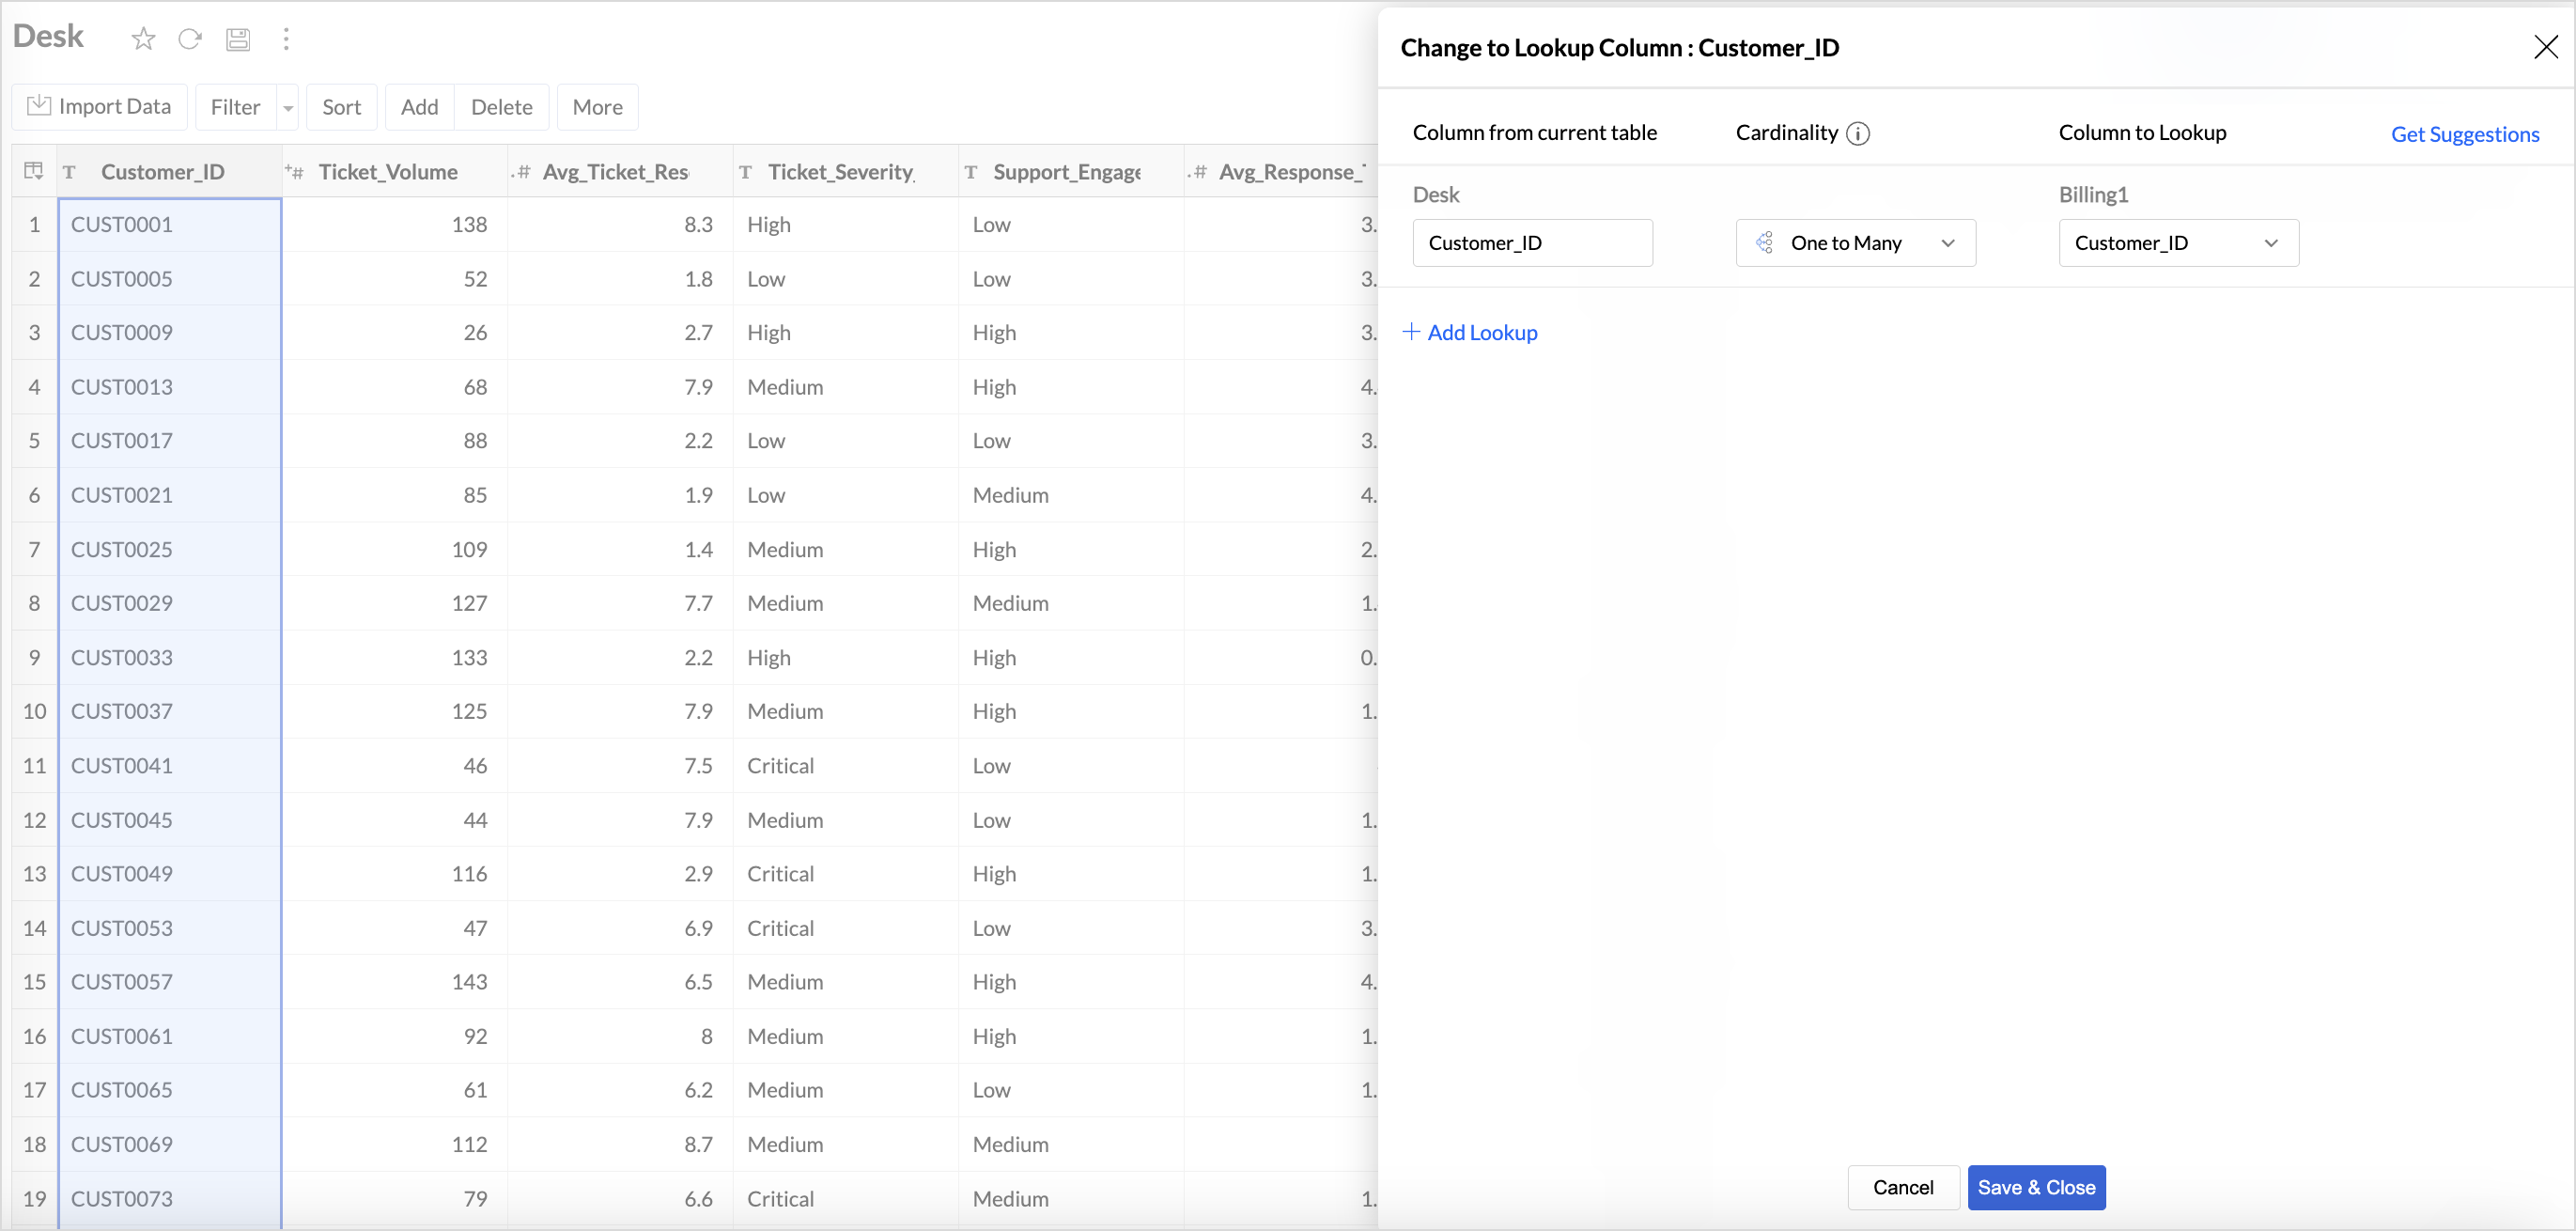
- The Get Suggestion option lists all the possible lookups that can be defined.
- Select the preferred lookup column and click Add.
- Click Save and Close.


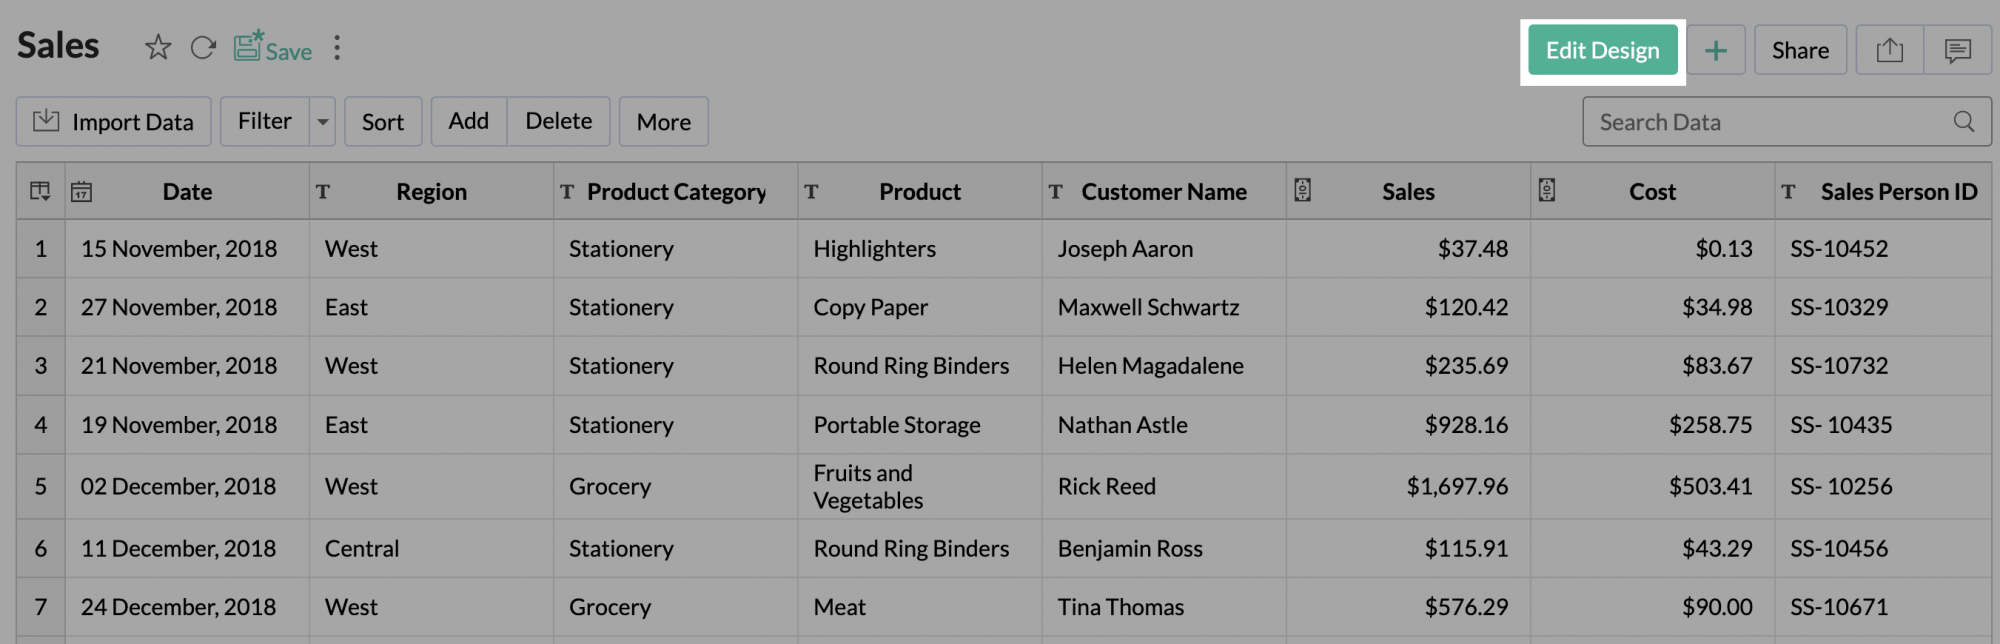
From the Table Designer - Using Edit Design
- Click Edit Design in the top right corner.
- Navigate to the Lookup section.
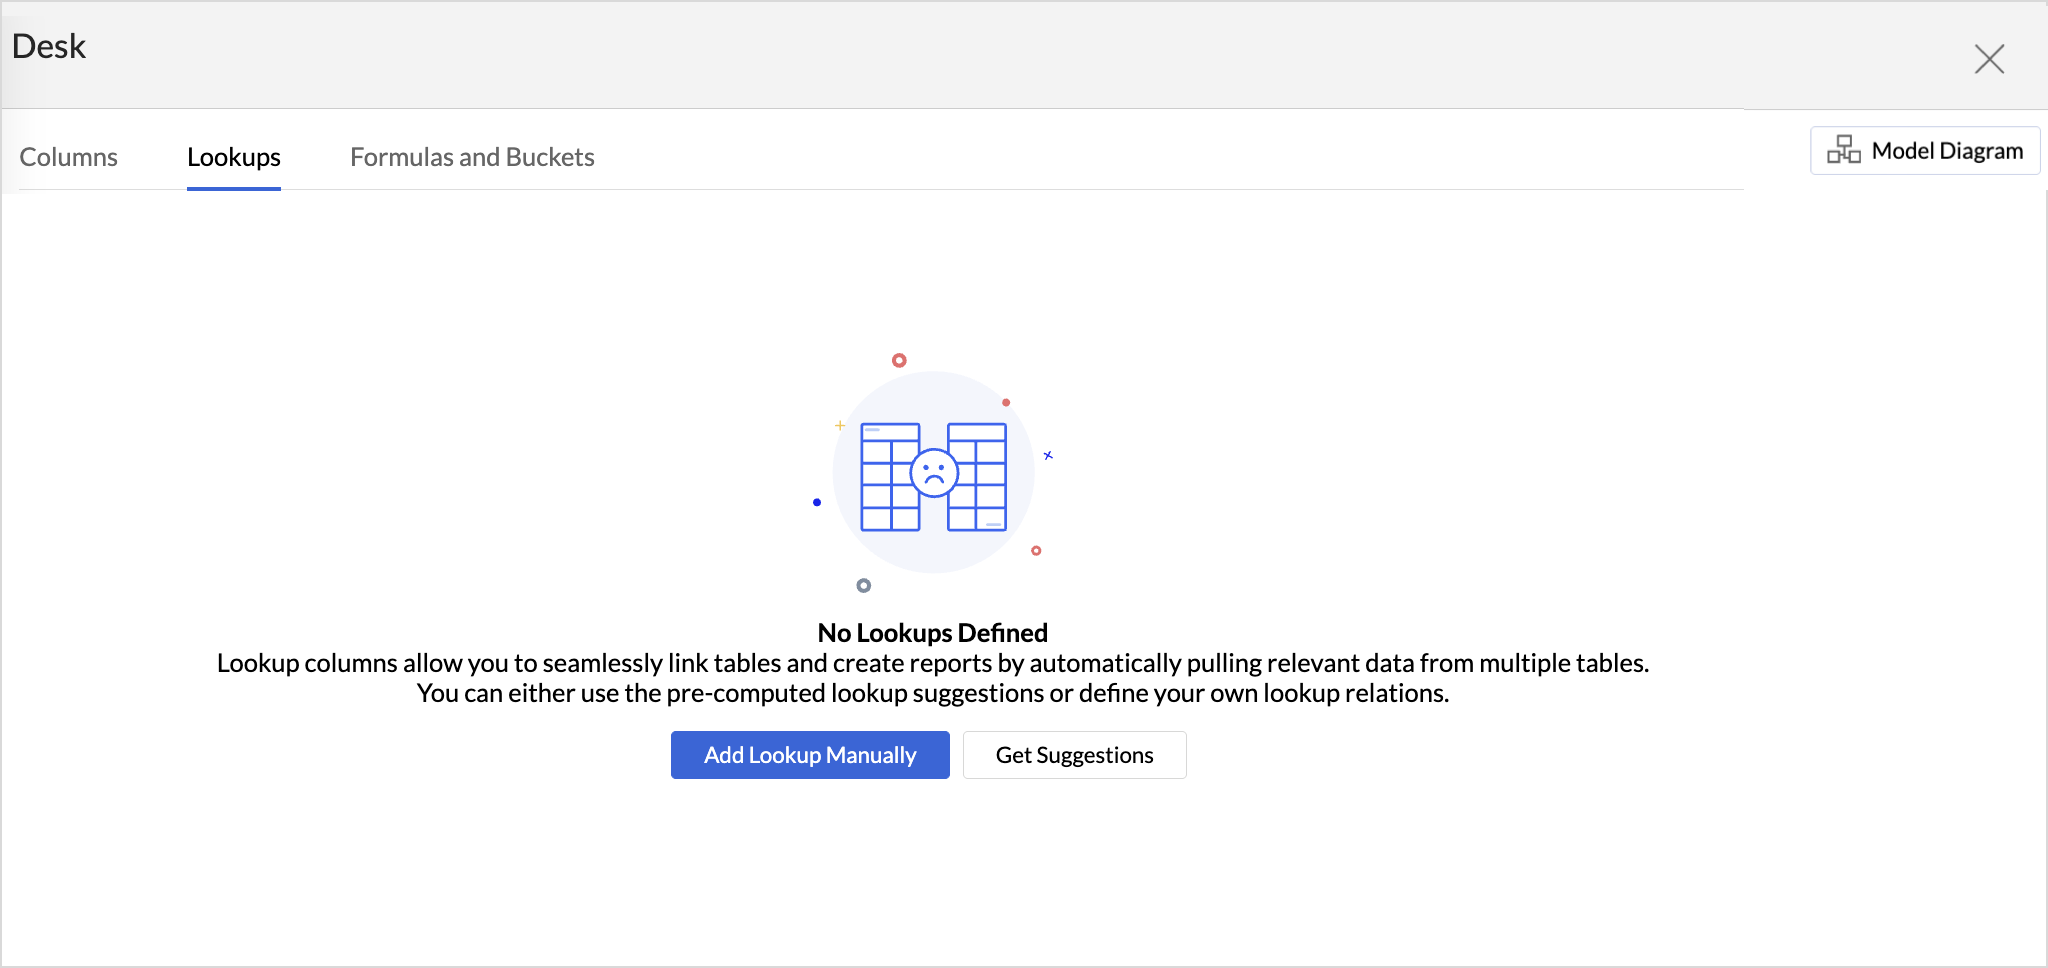
- Choose one of the following options
- Add Lookups Manually
- Select the column from the current table for which you intend to define the lookup relationship.
- Choose the Cardinality relationship
- Select the corresponding column to be looked up.
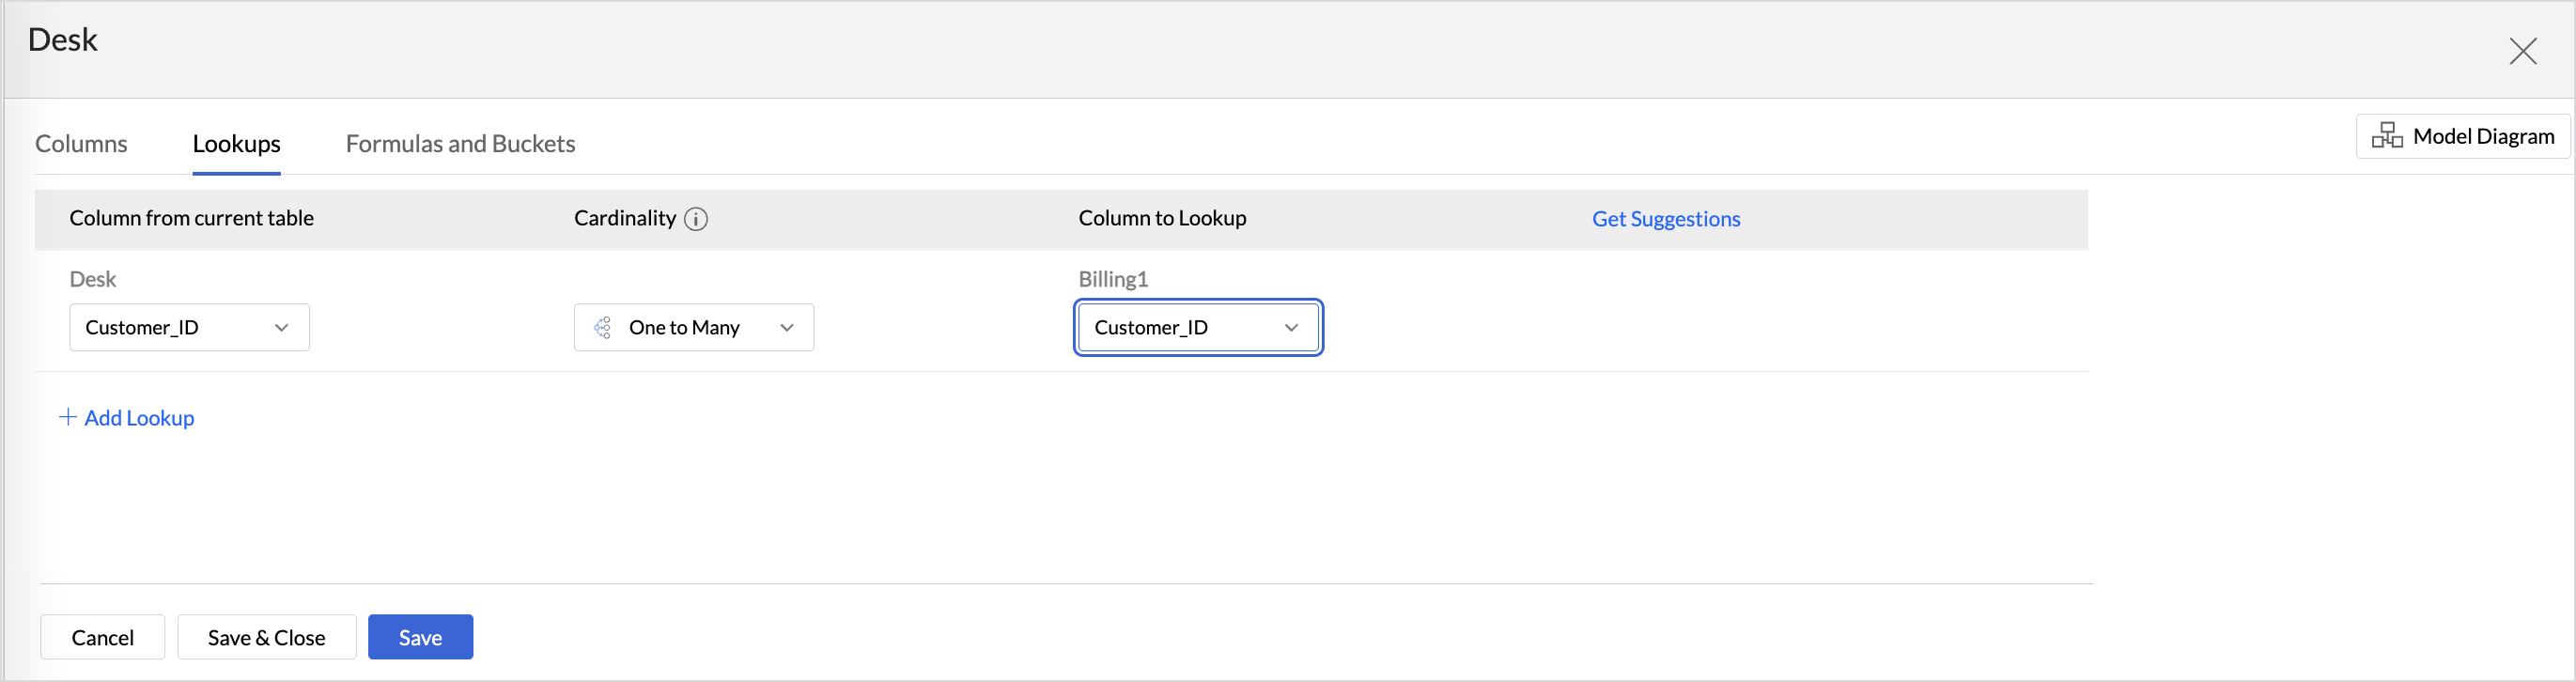
- You can add any number of lookups using the Add Lookup link. Once done, click Save & Close.
- Get Suggestions:
- Click Get Suggestions to get the possible relationships that can be defined for the selected column.
- To add all the suggested lookups, select the checkbox adjacent to the Columns from the current table option.
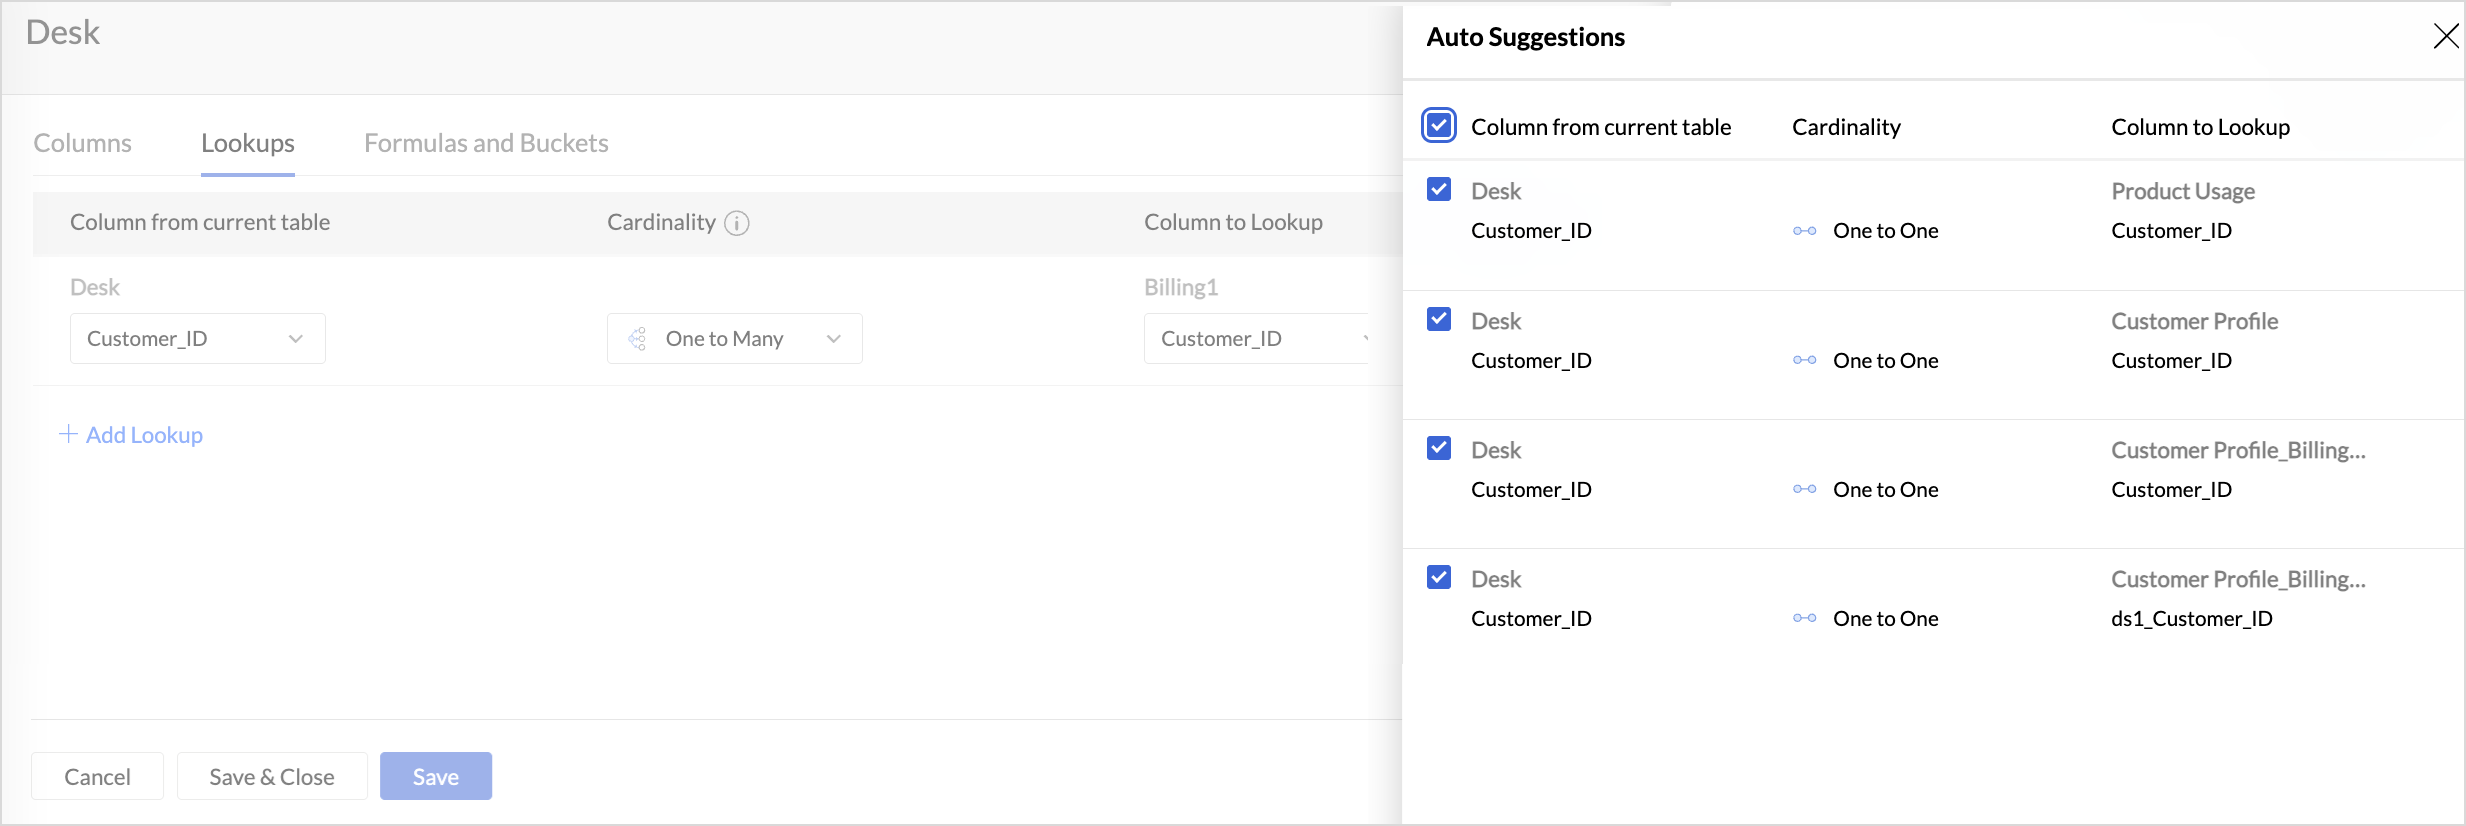
- To add only selected lookups, select the checkbox specific to the suggestion.
- Click Add.
- Add Lookups Manually


From Reports Editor
Zoho Analytics allows you to join tables from the report editor when you need to include data from another table. This following presentation explains how to include another table's data for reporting.
Creating Report using Auto-Join
Once tables are related with each other using lookup columns, you can create the reports by selecting any of table with lookup relationship. Zoho Analytics will automatically join the data from these tables and generate the report, when you drag and drop columns from across tables.
Here's how the Sales by each Sales Person chart is created using Auto-Join feature:
- Open 'Sales' table and select 'New Chart View' option on the toolbar.
- Now, Auto-Join feature detects its lookup relationship with other tables and lists all the columns of Product and Sales tables in Column List panel in the Report Designer.
- Drag and drop Sale Person Name column from Sales table into X-axis shelf and Sales column from Sales table into Y-axis shelf.
- Select 'Click here to generate graph'.

The Auto-join feature will automatically join the data from both the Sales and Sales Person table using the Lookup column Product ID and provide the report.
Also, columns from the related tables can be used to filter the report. Continuing the above example, Product Name column from Product Details table can be used to filter the chart data and display Sales made by the Sales Person for the selected Products as shown below.

Customizing the Join type
By default Zoho Analytics will join tables using Left Join. Possible join types are:
- Left Join - Report will be computed with all the rows from the child table (left) and only the matching rows from the parent table (right). Matching is done based on lookup columns defined between child & parent tables. This will be the default join type. In this case the Sales table is the child and Sales Person table is the parent.
- Right Join - Report will be computed with all the rows from the parent table (right) and only the matching rows from the child table (left). Matching is done based on lookup columns defined between parent & child tables. Here the child will be Sales Person table and parent will be Sales table.

You can choose to change the join type. To do so,
- Click View Relationships icon in the chart designer and select In a List View.
- In the Table relationship used in this report dialog that opens select the type of join and click Apply.
Customizing Lookup Columns and Path used in Auto-Joins
You can link multiple tables using various Lookup columns in your Workspace. When creating a report, Zoho Analytics will use the appropriate Lookup columns (Lookup path) created between them and generate the report using the auto join capability.
However, in some cases this might not suit your specific need. To address this, Zoho Analytics allows you to choose the Lookup path between tables to be used for report creation using the Configure Lookup Path option.
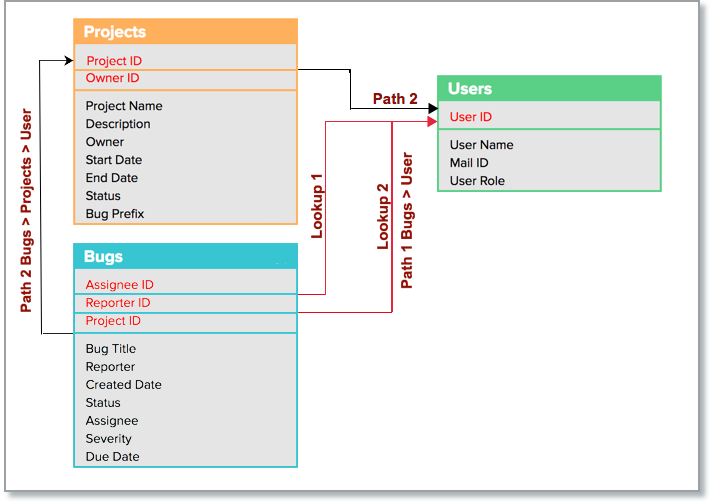
Let's take an example of a Bug tracking Workspace model. Here the Bugs and the Users table are directly joined using two lookup columns i.e., Assignee ID and Reporter ID. The Bugs table also has a lookup to the Projects table using the Projects ID. The Projects and the Users table are joined using the lookup between Owner ID and User ID. This creates an indirect connection between the Bugs and the Users table through the Projects table.
Customizing Lookup Column for Join
In the above-given model, let's see an example of creating the report Bugs Identified by User. By default, when you plot a report for Bugs identified by each user, Zoho Analytics could use the Assignee ID lookup to Users table which is not correct as it will provide Bugs assigned to each user.
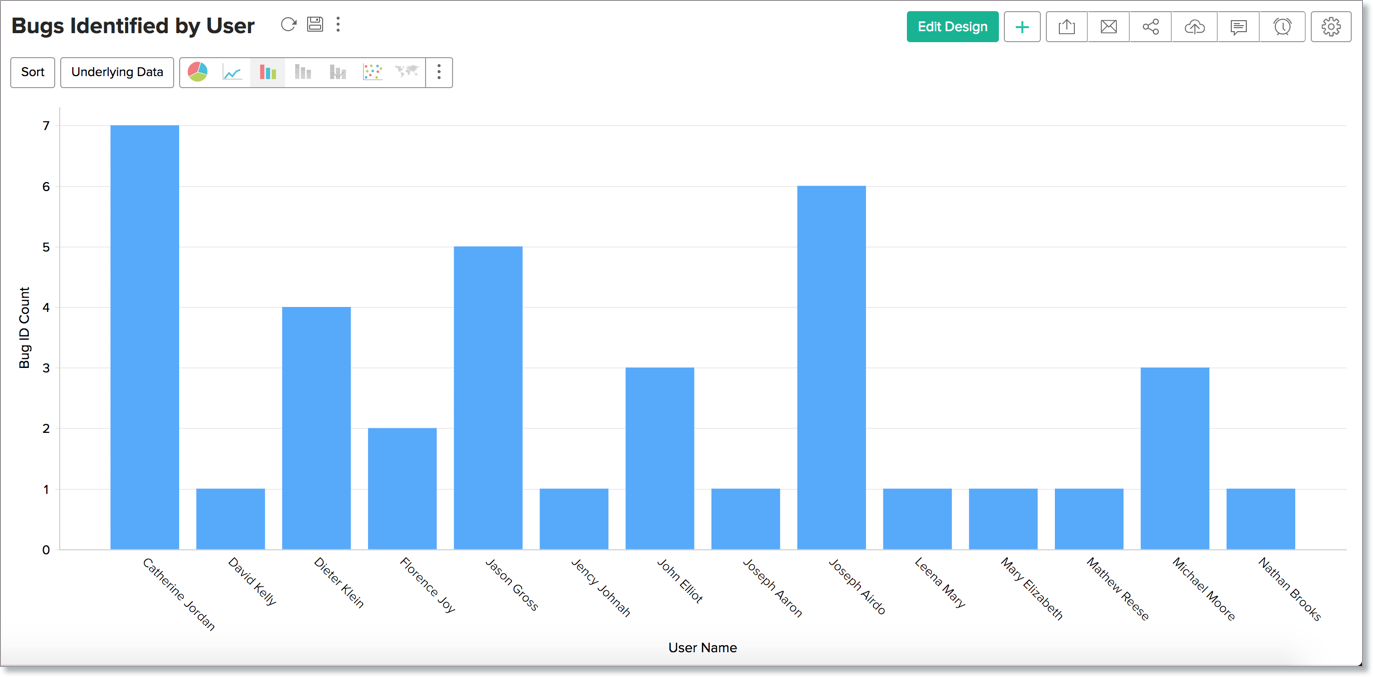
In this case, you can change this by selecting the Reporter ID as the Lookup Column to be used. The following illustration shows how to change the Lookup Column to join.
Now the Bugs identified by Users report, shown below, is generated.
Selecting Multiple Lookup Columns for Join
You can also select multiple lookup columns between each pair of tables in a path. This allows you to create report over data that meet multiple conditions. Let's say you want to create reports on bugs where both the assignee and the reporter are same users. You can do this by selecting both the Assignee ID and the Reporter ID as lookup columns. The following illustration shows how to select both lookup column for joining.
Customizing Lookup Path for Join
Zoho Analytics also allows you to change the lookup path that joins the tables.
Let's say, you need a report on Bugs raised on Projects categorized by owners. Since the Bugs and the Users are directly joined tables, Zoho Analytics will generate the report as Bugs assigned for Users categorized by Projects. It will ignore the Projects table in-between to generate the reports.
To achieve your requirement, you can join the Bugs and the Users tables through the Projects table. The following illustration shows how to change the Lookup Path to join tables.

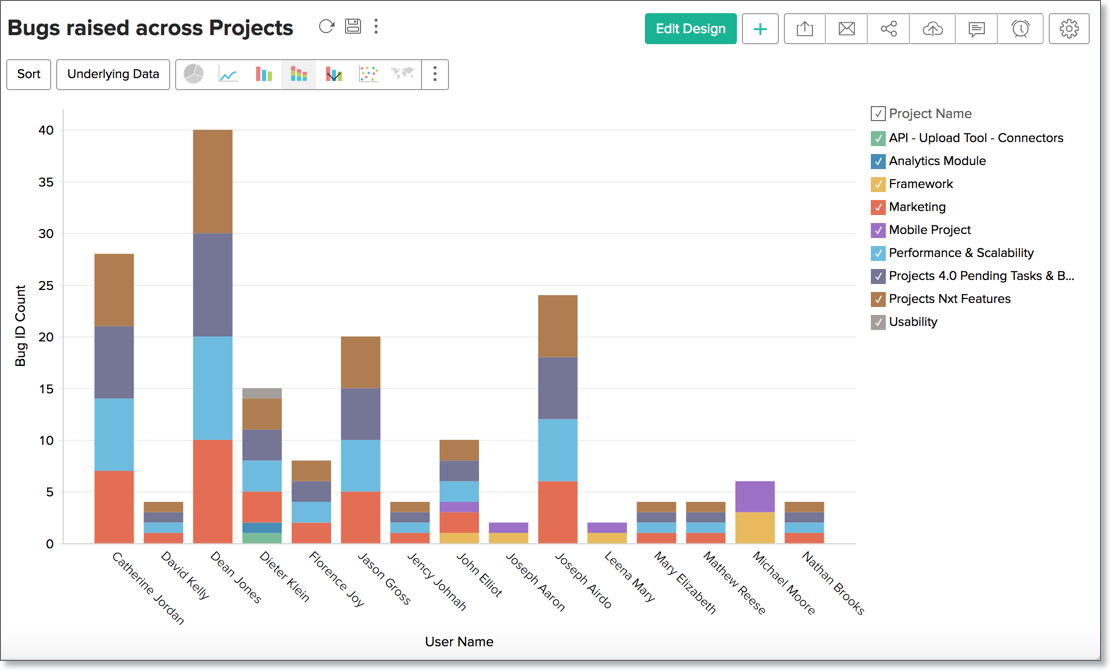
Now, the Bugs table is linked to the Users table through the Projects table and retrieves the data for Bugs raised across projects categorized by the project owners (User).
Note: You could only configure a single path to connect two tables. You cannot configure different paths for two columns from the same table in the report. However, you can configure different paths for columns from the different tables.
Joining with Query Tables
Query Table is a feature that enables you to prepare data for easy reporting and analysis. You can combine data from one or more tables in a Workspace and create specific data views using the standard SQL SELECT queries. These data views are similar to tables and you can perform operations such as report creation, sharing, and even create another Query Table over an existing Query Table.
You can create Query Tables for filtering datasets, batching datasets together (union), transforming data, applying SQL query functions, joining data and more.
For example, a query to combine the Employee and Department tables can be created as shown below.
.

The example query above joins the Employee & Department tables, getting the department name mapped to each employee. Over the query table that you have created by joining the necessary tables, Zoho Analytics allows you to create any type of reports for analysis and visualization.Click to learn more.