X Advanced Analytics
Advanced Analytics for X, formerly known as Twitter empowers you to analyze your own tweets, the responses you've garnered, and the overall engagement metrics associated with your X handle.
With the Advanced Analytics for X, you can generate in-depth reports based on your X handle data. By examining patterns and trends in engagement, you can ultimately enhance and boost the level of engagement for your X account.
General
Pricing & Trial
- How much does this connector cost?
- Do you provide trial evaluation for this connector?
- What do you mean by 'Users' in the (connector) pricing plan?
- What do you mean by 'Rows'/'Records' and how is it calculated in the pricing plan?
Setup
- How do I setup the X Insight Analytics?
- How long should I wait for my X data to initially appear in Zoho Analytics?
- I got this email which said 'Setup Process Failed'/'Synchronization Process Failed'. What should I do?
- How frequently can I synchronize my data with Zoho Analytics?
- Can I edit the X connector Synchronization setting?
- Can I view the data synced history?
- Can I synchronize my X data instantly?
- Can I set up the X Analytics in any other existing Workspace or in any other Advanced Analytics Workspace?
- Can I add/modify data in the X data tables within Zoho Analytics?
- Can I add new columns to the X data tables within Zoho Analytics?
- Can I add new data tables in this Workspace to create reports & dashboards?
- Can I transfer my X connector to another admin account?
- How do I Re-authenticate my X account in Zoho Analytics?
- How can I remove the Integration?
Reporting Features
- What are the modules in X on which I can create reports?
- Can I create reports using the columns from different modules?
- What are the report types supported by Zoho Analytics?
- What are Formulas in Zoho Analytics?
- How do I create my own custom formulas in Zoho Analytics?
- What are the default formulas that gets added by Zoho Analytics on setting up this connector?
- Can I combine data from other sources with the data from X to create reports and dashboards?
- Can I join data from multiple tables to create reports?
- What are Query Tables?
Sentiment Analysis
- What is sentiment analysis?
- How does sentiment analysis work in Zoho Analytics?
- How do I analyze a tweet sentiment in Zoho Analytics?
Cross-Functional Analytics with Popular Business Applications
- What are the popular business applications that I can integrate this connector with?
- How can I analyze the data from the other business applications along with X?
- Will a lookup relationship between the related modules from X and other third-party application be created automatically?
Users, Sharing & Collaboration
- How do I share the reports in Zoho Analytics with my colleagues?
- What are the user roles available in Zoho Analytics?
- Why can't other users edit the reports that I have shared to them?
- Can I share the same report created, to multiple users with different criteria associated so that they see different data?
- Can I export a report/dashboard?
- How can I print the reports & dashboards created in Zoho Analytics?
- How can I email reports & dashboards created in Zoho Analytics in a scheduled manner?
Solutions
Help & Support
General
1. What is Zoho Analytics?
Zoho Analytics is a business intelligence and analytics solution that helps you derive insights from your business data, through its powerful reporting and analytical capabilities. You can create dynamic and interactive reports and dashboards in minutes, with no IT help.
It offers the following important capabilities:
- Complete Online Business Intelligence and analytics service, accessible anytime, anywhere!
- Easy to adopt 'spreadsheet-like' interface with powerful drag & drop based reporting features for quick report creation.
- Visual Analysis capability for in-depth analysis and to slice & dice your data.
- Supports a wide range of reporting capabilities like Dashboards, Charts, Pivot Tables, Summary Views, and simple tabular reports.
- Supports creation of KPI widgets in dashboards to analyze the performance.
- Supports data import from a variety of file formats like Excel, JSON, HTML etc. Also supports data import from cloud storage and Web URLs. Supports periodic scheduling of importing data.
- Integrated with a suite of Zoho products such as Zoho CRM, Zoho Desk, Zoho Projects, Zoho BugTracker, Zoho Books etc.
- Integrated with popular business applications like Google Analytics, Google Ads, Zendesk, Xero, Salesforce CRM, X Competitive Analysis etc.
- You can also integrate your own applications with Zoho Analytics using Zoho Analytics API.
- Integrated with Zapier to power up import from over 500+ apps.
- Blend & merge data from across different sources to create meaningful business reports.
- With an advanced formula engine, you can derive key business metrics from your data.
- Supports SQL (Structured Query Language) driven querying for powerful report creation.
- Real-time collaboration by sharing data and reports with your colleagues & friends, in either read or read-write modes.
- Export and Print reports in a variety of formats. Notify reports via email.
- Publish reports for wider consumption. Embed reports within your websites, web applications and blogs.
- Highly secure as all users login only over HTTPS (SSL connection). All your data and reports are hosted in highly secure data centers. (Refer Security and Privacy)
- Supports Logo Rebranding.
2. Why X Analytics?
Advanced Analytics for X (formerly known as Twitter) enables you to analyse the responses for your X engagement. With Zoho Analytics you can easily slice and dice your tweets data (your X handle data in general), and transform it into actionable insights by using the power of data analytics.
Advanced Analytics for X brings in all the capabilities of Zoho Analytics described below.
- A full-featured business intelligence (BI) and reporting tool that can slice & dice the X data to create any report/dashboard you require.
- Create your own reports and dashboards based on not only your X data but also by blending data from other data sources.
- Share reports and dashboards with your colleagues.
- Schedule and email your reports whenever you want.
- Export your reports as PDF, HTML, Excel, CSV and image files.
- Embed your reports in websites, blogs etc.
3. Who can subscribe to the Zoho Analytics connector?
Social media marketers or Support Managers who are using X as the channel. This helps to learn about your response for their activities in the X handle.
Social media marketers can comprehend what brings better engagement into your handle or how satisfactory the customers are of their service. This helps in better decision to bring a good customer relation through X.
Pricing & Trial
1. How much does this connector cost?
X Analytics is bundled free for all the paid users of Zoho Analytics. The Zoho Analytics paid plans starts at per month. Click to learn more about Zoho Analytics pricing page.
2. Do you provide trial evaluation for this connector?
Yes, we do provide a 15-day free trial for this connector from the date of setup.
3. What do you mean by 'Users' in the (connector) pricing plan?
Anyone to whom you privately share your Workspace, tables (data), reports and dashboards, created in Zoho Analytics, for collaboration is considered a 'User' in Zoho Analytics. A user is identified by his/her unique email address, with which their Zoho Analytics account was registered.
Suppose you subscribe to the Zoho Analytics Standard plan, you can privately share the data/reports in your account and collaborate with 4 other persons. Now your Zoho Analytics account is said to have 5 users (including yourself).
4. What do you mean by 'Rows'/'Records' and how is it calculated in the pricing plan?
In Zoho Analytics, a row or record is defined in the same context as in a database (or spreadsheet). In simple terms, a table consists of rows (records) and columns (fields). Each row in a table represents a set of related data and has the same structure. For example, in a table that represents "Tweets", each row would represent a single tweed record. The number of rows calculated for pricing is the sum of all rows/records stored across all your Workspace tables in your Zoho Analytics account.
Setup
1. How do I setup the X Insight Analytics?
2. How long should I wait for my X data to initially appear in Zoho Analytics?
Initial data import will take from few minuted to couple of hours depending on the volume of the data. You will receive an email notification once the import is complete. If you access the Workspace before the initial fetch, it will not display any data.
3. I got this email which said 'Setup Process Failed'/'Synchronization Process Failed'. What should I do?
The import/sync process of your X data can fail sometimes, due to a variety of reasons. Hence, you may receive such mails occasionally. The Zoho Analytics team will look into it immediately and get back to you, after taking the required corrective action.
Case 1: You will receive the Setup Process Failed mail when there is a failure during the initial fetch. In this case, we request you to:
- Open the Workspace in which you have set up the connector.
- Click the Data Sources button in the Explorer tab.
- In the Data Sources page that opens click the Retry Now link.
- If the issue persists please do write to support@zohoanalytics.com. We will look into it and get back to you immediately.
Case 2: You will receive the Synchronization Failed mail if there is any failure during the data synchronization process between X and Zoho Analytics, after the initial setup & import of data. This might be a momentary failure due to any internal issues. This import schedule will get suspended if there are five successive failures.
4. How frequently can I synchronize my data with Zoho Analytics?
You can choose to synchronize data at one of the intervals mentioned below.
- 1 Hour (Enterprise plan Only)
- 3 Hours
- 6 Hours
- 12 Hours
- Every day
Note:
- Users in Enterprise plan alone can choose to synchronize data at every 1 hour.
- Users in Basic plan can synchronize their data only once everyday.
5. Can I edit the X connector Synchronization setting?
Yes, you can edit the X connector synchronization setting if you are the administrator of the X Analytics.
To do so,
- Open the corresponding X Analytics Workspace in Zoho Analytics.
- Click Data Sources on the left panel.
- In the Data Sources page that opens, click the Edit Setup link.
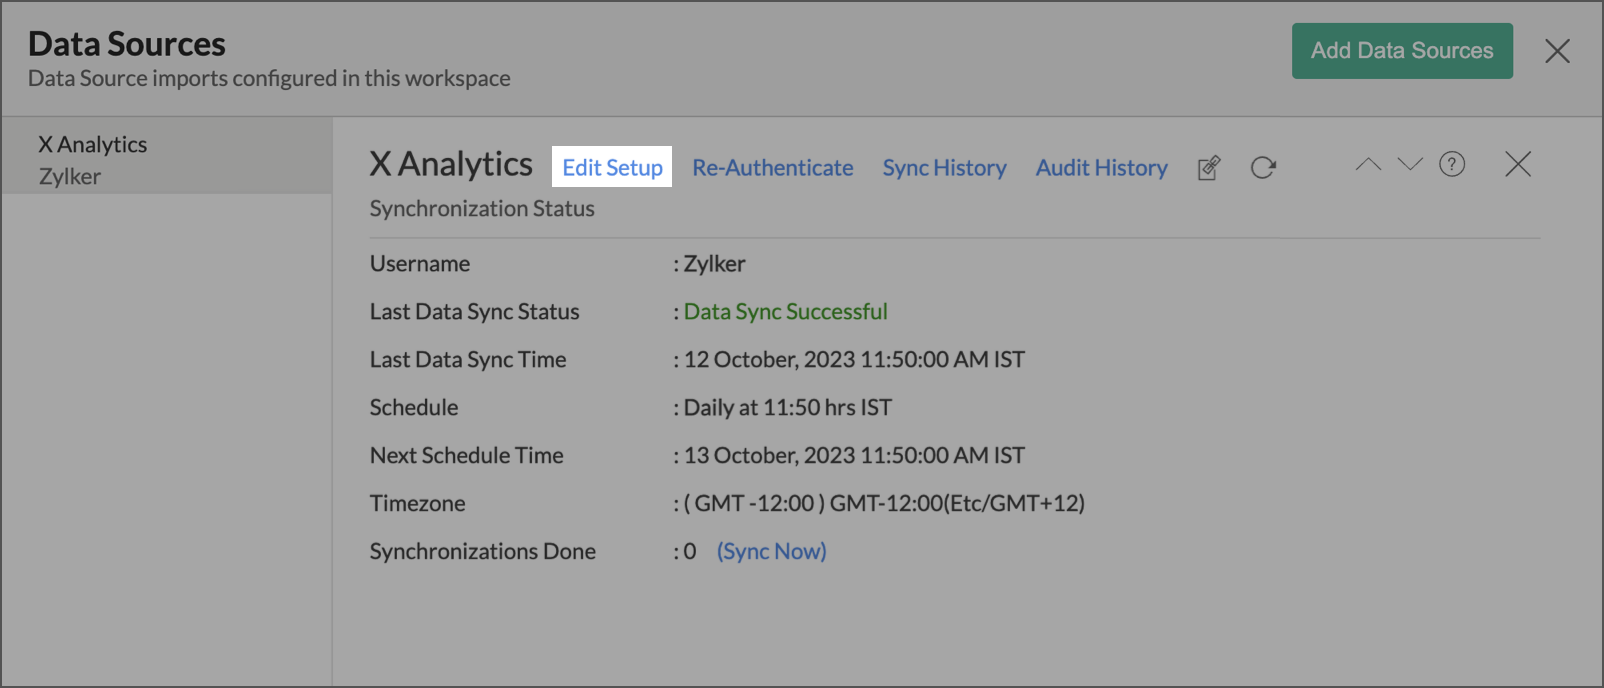
- The Edit X Setup dialog will open. Modify the settings as needed.
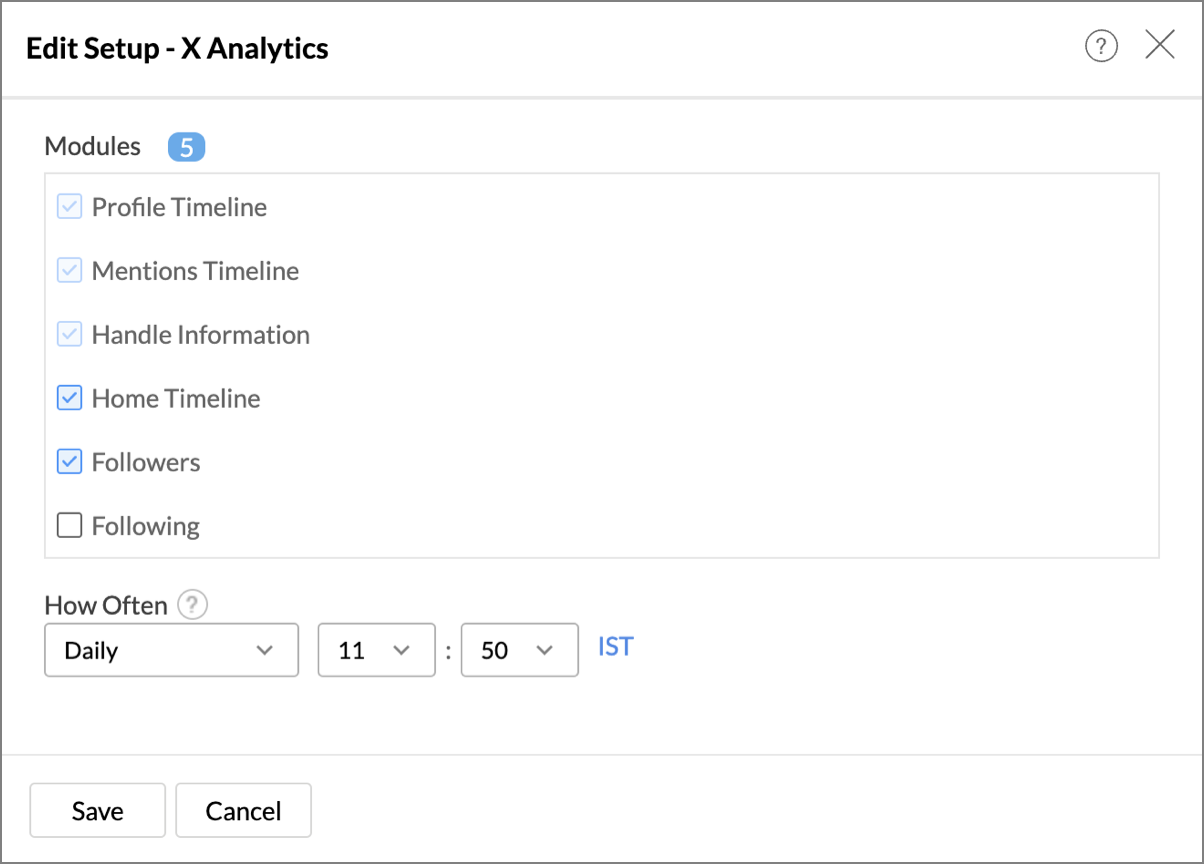
- Click Save. The synchronization setting will be modified and data will be synced in the next synchronization interval.


6. Can I view the data synced history?
Yes, you can view the data synced history. Follow the below steps to view the data synced history.
- Open the corresponding X Analytics Workspace in Zoho Analytics.
- Click Data Sources on the left panel.
- In the Data Sources page that opens, click the Sync History.
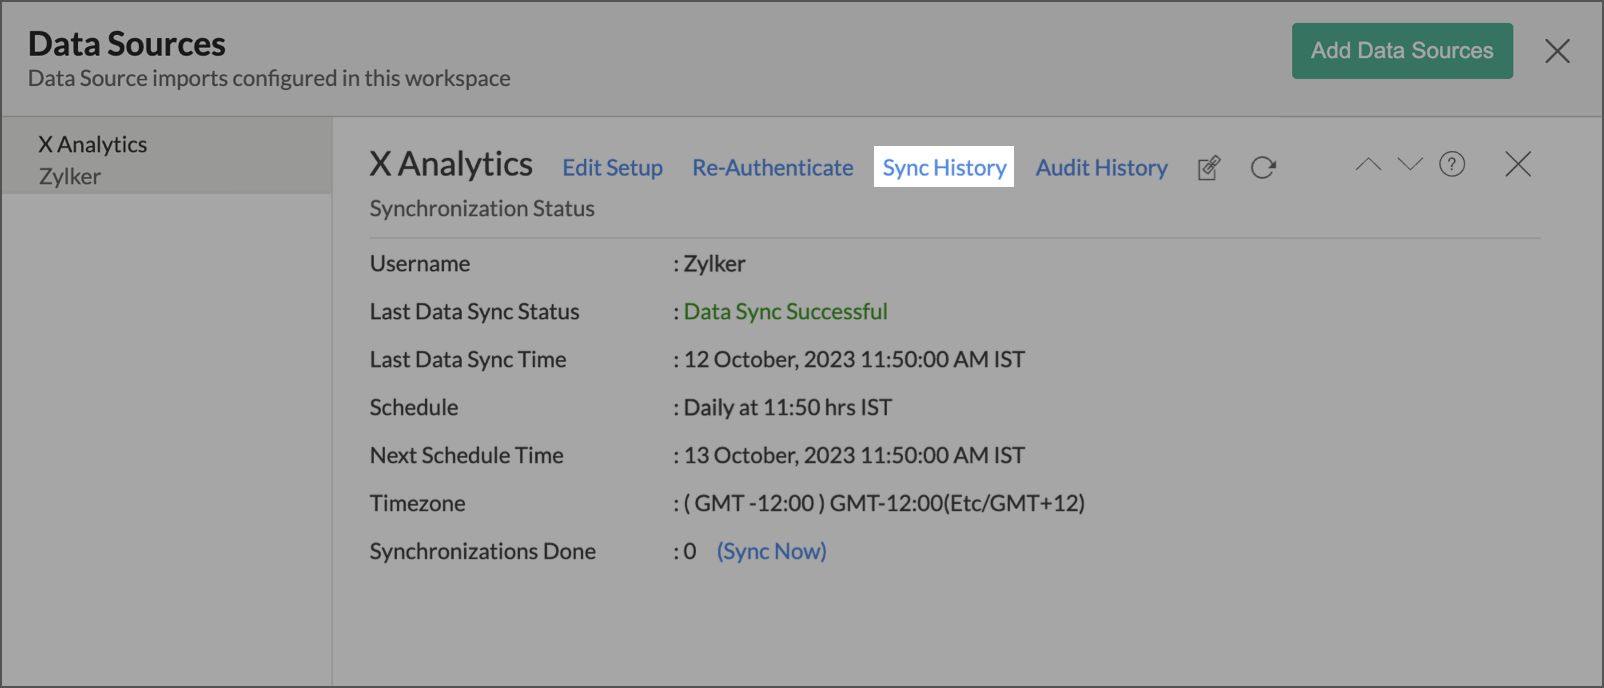
- A calendar with the sync history of the last 45 days will open. The date when the data sync has happened will be highlighted. Hover to view the number of times the data had got synced on a specific date.
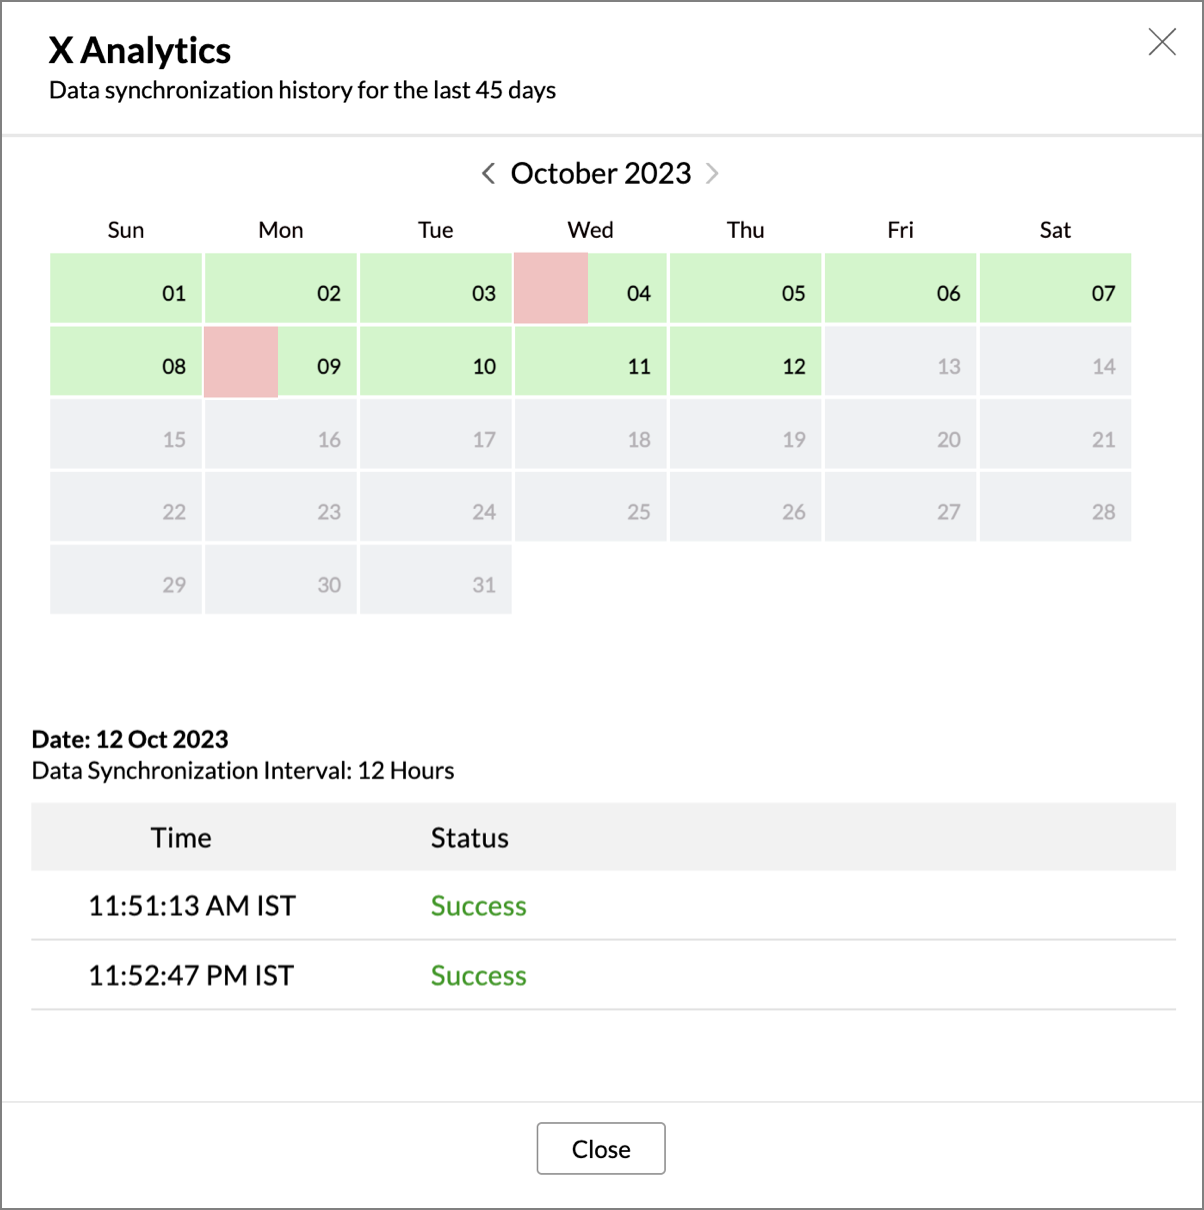
- Click the date to view more details.
- Time - Displays the time when the data is synced.
- Status - Shows whether the sync was a success or a failure.
In case of failure, the reason will be displayed. Refer to this page to learn how to resolve the issue and avoid further failure.


7. Can I synchronize my X data instantly?
Yes, you can synchronize your X data instantly when needed.
To synchronize your data instantly:
- Open the Data Sources page.
- Click Sync Now. X data will get instantly synchronized.
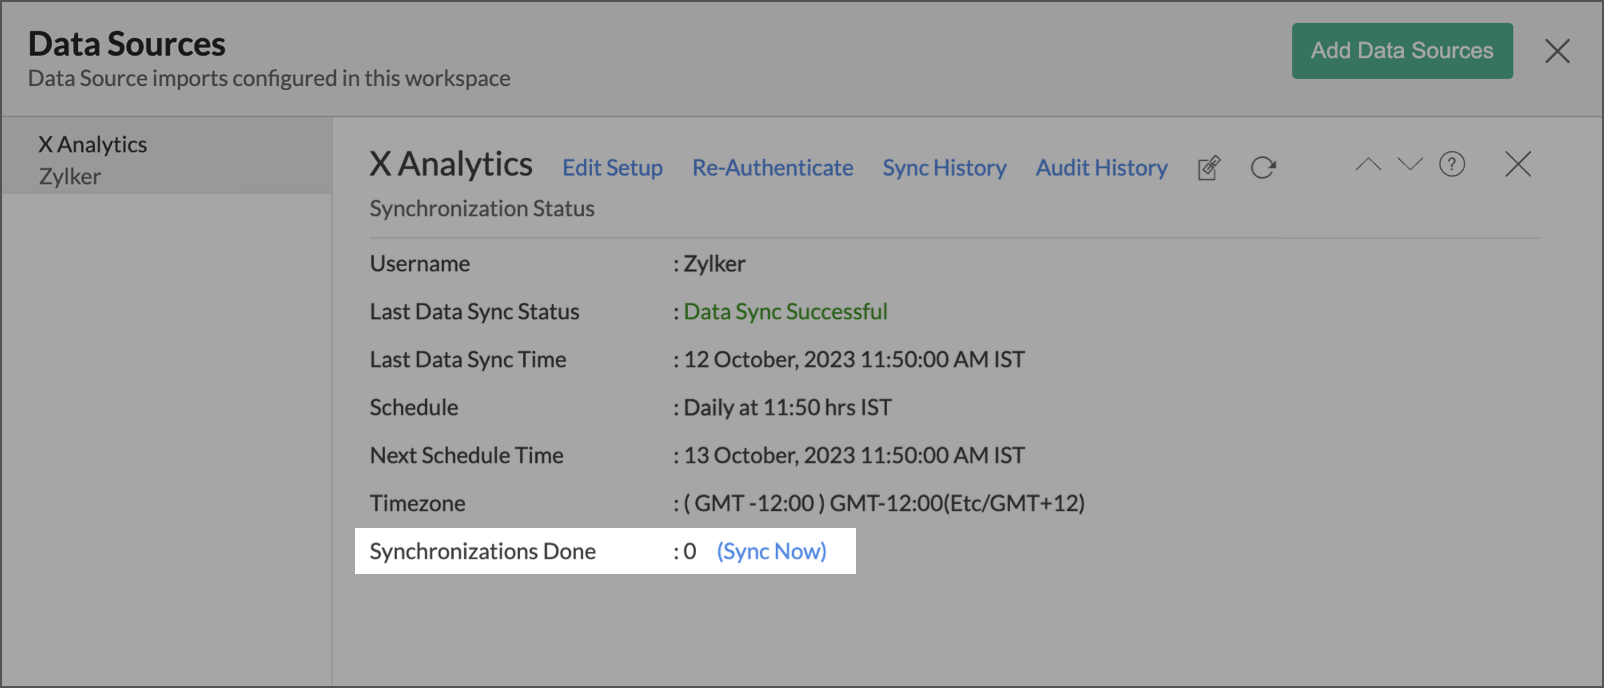

This option can be used up to five times between the schedules.
8. Can I set up the X Analytics in any other existing Workspace or in any other Advanced Analytics Workspace?
Yes, you can setup the X Analytics in any of the existing Workspace or in any of the Advanced Analytics Workspace to analyze data together. You can do this by creating a new table by importing data.
9. Can I add/modify data in the X data tables within Zoho Analytics?
No, you cannot add/modify data in the X data tables. Data from X application will automatically get synced into Zoho Analytics in the different tables. You cannot edit any of this data or add new data records from within Zoho Analytics.
However, you can add new tables and add/import data into that, to create reports combining it with the data from X.
10. Can I add new columns to the X data tables within Zoho Analytics?
No, you cannot add new columns. But, you can add Custom and Aggregate Formulas (i.e., calculated fields) to these tables to help you create powerful reports. Refer Adding Formulas to know more on this.
11. Can I add new data tables in this Workspace to create reports & dashboards?
Yes, you can add new data tables. Click New > New Table to add a new table in the existing X Workspace.
With this feature, you can import data from other sources or add them manually into your Workspace to analyze and create reports combining this with your X data.
Refer:
- How to Import data from files and feeds into Zoho Analytics
- How to Import Data from Cloud Storages
- How to Import data from local Database
- Import data from popular Business Applications
- How to Import data using Zoho Analytics API
12. Can I transfer my X connector to another admin account?
At present, we do not provide an option in the user interface. If you require this transfer, please do mail us to support@zohoanalytics.com. We will get your requirements and handle this.
13. How do I Re-authenticate my X account in Zoho Analytics?
You can re-authenticate the setup by following the below steps.
- Open the corresponding X Analytics Workspace in Zoho Analytics.
- Click Data Sources on the left panel.
- In the Data Sources page that opens, click the Re-authenticate link.
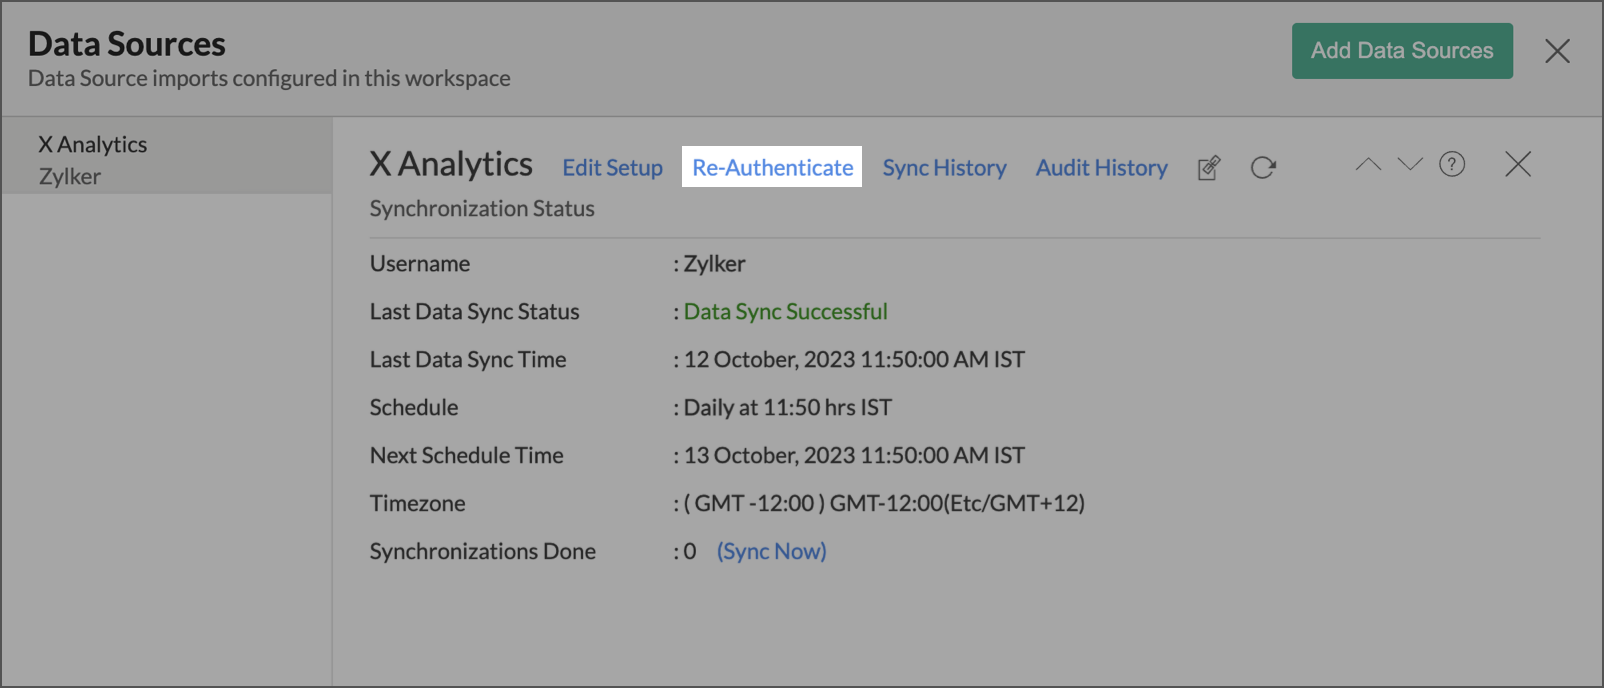
- Enter your credentials and re-authenticate your account.


14. How can I remove the Integration?
You can remove the connector from the Data Source page.
- Open the Data Source page.
- Hover the mouse over X Profile. A Settings icon will appear.
- Click the Settings icon, then select Remove Data Source.
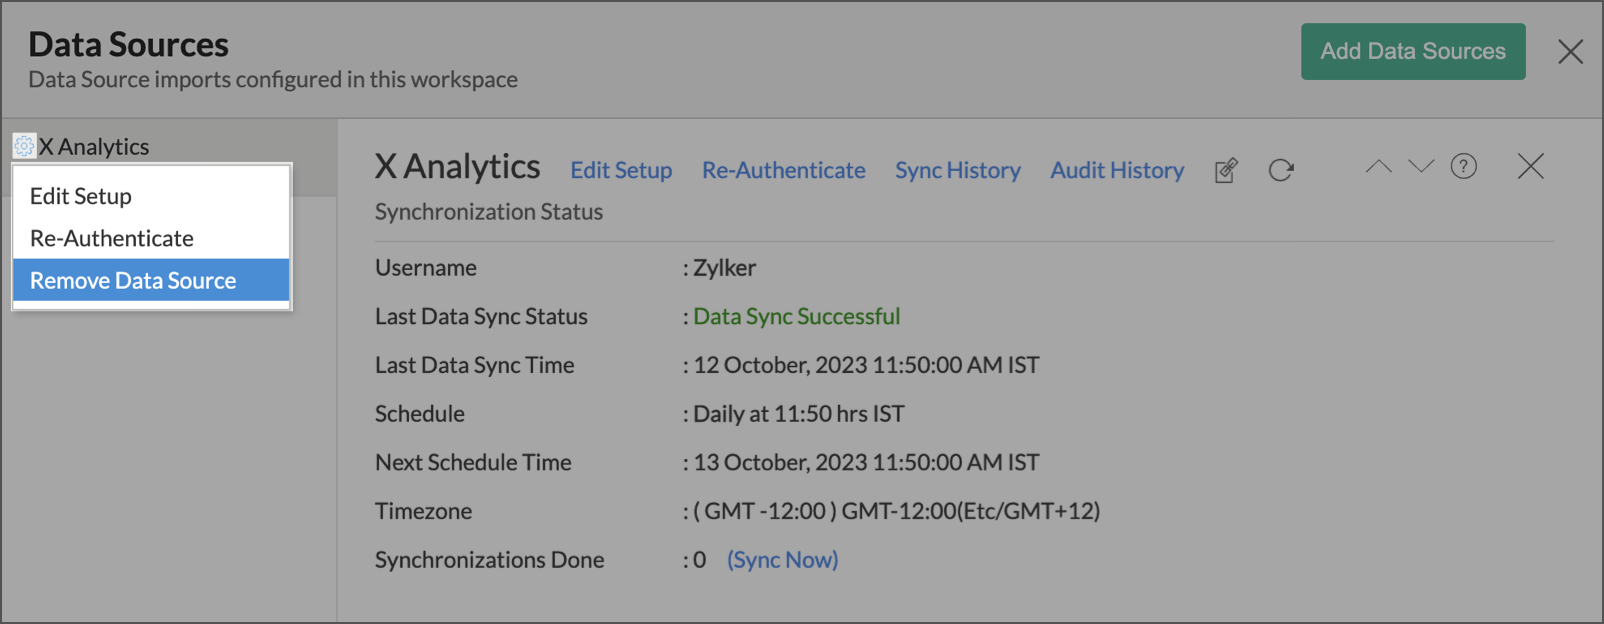
- The data synchronization from X Profile into this Workspace will be removed. However, you will still be able to access this workspace with existing data.

Reporting Features
1. What are the modules in X on which I can create reports?
You can create reports using the data from the following modules:
- Handle Information
- Profile Timeline
- Mentions Timeline
- Followers
- Following
- Home Timeline
2. Can I create reports using the columns from different modules?
Yes, you can create reports using the columns from different tables. All the modules (tables) from X will be linked by default. You can create reports by simply dragging and dropping the required columns into the reports designer.
3. What are the report types supported by Zoho Analytics?
Zoho Analytics supports a wide variety of reports.
- Charts
- Pie
- Bubble
- Packed Bubble
- Bar
- Stacked bar
- Line
- Smooth Line
- Scatter
- Combination
- Map Chart
- Area
- Stacked Area
- Web
- Funnel
- Doughnut
- Table View
- Pivot tables (Matrix Views)
- Summary view
- Tabular view
- KPI Widgets
- Single Numeric Widget
- Dial Chart Widget
- Bullet Chart Widget
- Dashboards (multiple reports arranged in the same page)
4. What are Formulas in Zoho Analytics?
Formulas, as the name indicates, are calculations that help you derive key business metrics that can be used for reporting and analysis. Zoho Analytics provides a powerful formula engine to create any type of calculations required, to enable creating the required reports. Refer Adding Formulas in Zoho Analytics to know more.
5. How do I create my own custom formulas in Zoho Analytics?
To know how to create your own formulas refer to the Adding Formulas in Zoho Analytics help page.
6. What are the default formulas that gets added by Zoho Analytics on setting up this connector?
The default formulas added by Zoho Analytics are listed below. You can view these formulas by opening the corresponding table and selecting Add > Edit Formulas from the toolbar.
The following are the default formulas in the Handle Information table.
| Formula Name | Formula | Formula Type | Description |
| Account age in days | Custom | Datediff( currentdate (),"Created Date") | This formula calculates age of the X account in days. |
| Avg tweets per day | Custom | "Tweets"/"Account Age in Days" | This formula calculates the Average tweets posted per day in the lifetime. |
The following are the default formulas in the Followers table.
| Formula Name | Formula | Formula Type | Description |
| Account age in days | Custom | Datediff( currentdate (),"Created Date") | This formula calculates age of the X account in days. |
The following are the default formulas in the Following table.
| Formula Name | Formula | Formula Type | Description |
| Account age in days | Custom | Datediff( currentdate (),"Created Date") | This formula calculates age of the X account in days. |
The following are the default formulas in the Profile Timeline table.
| Formula Name | Formula | Formula Type | Description |
| Engagement | Custom | "Retweets"+"Favourites" | This formula calculates the total number of engagements gained for a Tweet. |
| Virality | Custom | (avg("Profile Timeline"."Engagement"))/ Sum("Handle Information"."Followers") | This formula calculates virality factor based on the engagements of tweet per followers. |
| Post Type | Custom | if( Isnull ("Retweet Id") ,If ( Isnull ("Quote Tweet Id") , If( Isnull ("Replied To Tweet Id"), 'Original Tweet' ,'Replied Tweet'),'Quoted Tweet'), 'Retweet' ) | This formula finds the type of the tweet i.e., Original tweet or a Retweet or Quoted tweet or Replied tweet. |
The following are the default formulas in the Mentions Timeline table.
| Formula Name | Formula | Formula Type | Description |
| Engagement | Custom | "Retweets"+"Favourites" | This formula calculates the total number of engagements gained for a Tweet. |
7. Can I combine data from other sources with the data from X to create reports and dashboards?
Yes, you can combine data from your other sources with your X data for analysis.
To do this, you need to add/import a new data table into the X Workspace as explained in the previous question and then define a look-up to join it with the table from X.
To define a lookup relationship between two tables, it is essential that the tables have at least one column which is common between them. Follow the below steps to look up a column from X along with the data from any other source.
- Open the corresponding table, right-click the column header and select Change to Lookup Column.
- In the Change to Lookup Column dialog that opens, select the column to look up.
- Click OK.
8. Can I join data from multiple tables to create reports?
Yes, you can join data from multiple tables to create the reports. Refer to Joining Tables in Zoho Analytics for detailed help on this.
9. What are Query Tables?
Zoho Analytics allows you to drive the data required by writing standard SQL SELECT Queries. This feature is called Query Tables. With Query Tables, you can also combine data from different tables and create reports from the same. View this video demo to know about how to create Query Tables in Zoho Analytics.
Sentiment Analysis
1. What is sentiment analysis?
Zoho Analytics supports sentiment analysis, a branch of Cognitive Analytics.
Sentiment analysis is used for evaluating the underlying emotions of a post/text based on its semantics. Zoho Analytics applies advanced AI/ML models to analyze the text (tweet) content and arrive at the sentiment.
This feature automatically analyzes your tweet sentiment and creates a Tweet Sentiment column in your Timeline data tables. This will help you analyze which tweet sentiments have gained more engagement and strategize your tweets accordingly.
Zoho Analytics categorizes the tweet sentiments as follows:
- Extremely happy
- Happy
- Neutral
- Sarcasm
- Disappointment
- Anger
2. How does sentiment analysis work in Zoho Analytics?
Zoho Analytics provides Augmented Analytical capabilities using technologies like artificial intelligence (AI) and machine learning (ML) across the product, to empower users with easy, faster & deeper insights. Sentiment analysis is one such capability that applies advanced AI/ML models to analyze the text content and arrive at the sentiment. In the context of X Advanced Analysis, this feature automatically analyzes your tweet sentiment and creates a Tweet Sentiment column in your Timeline data tables.
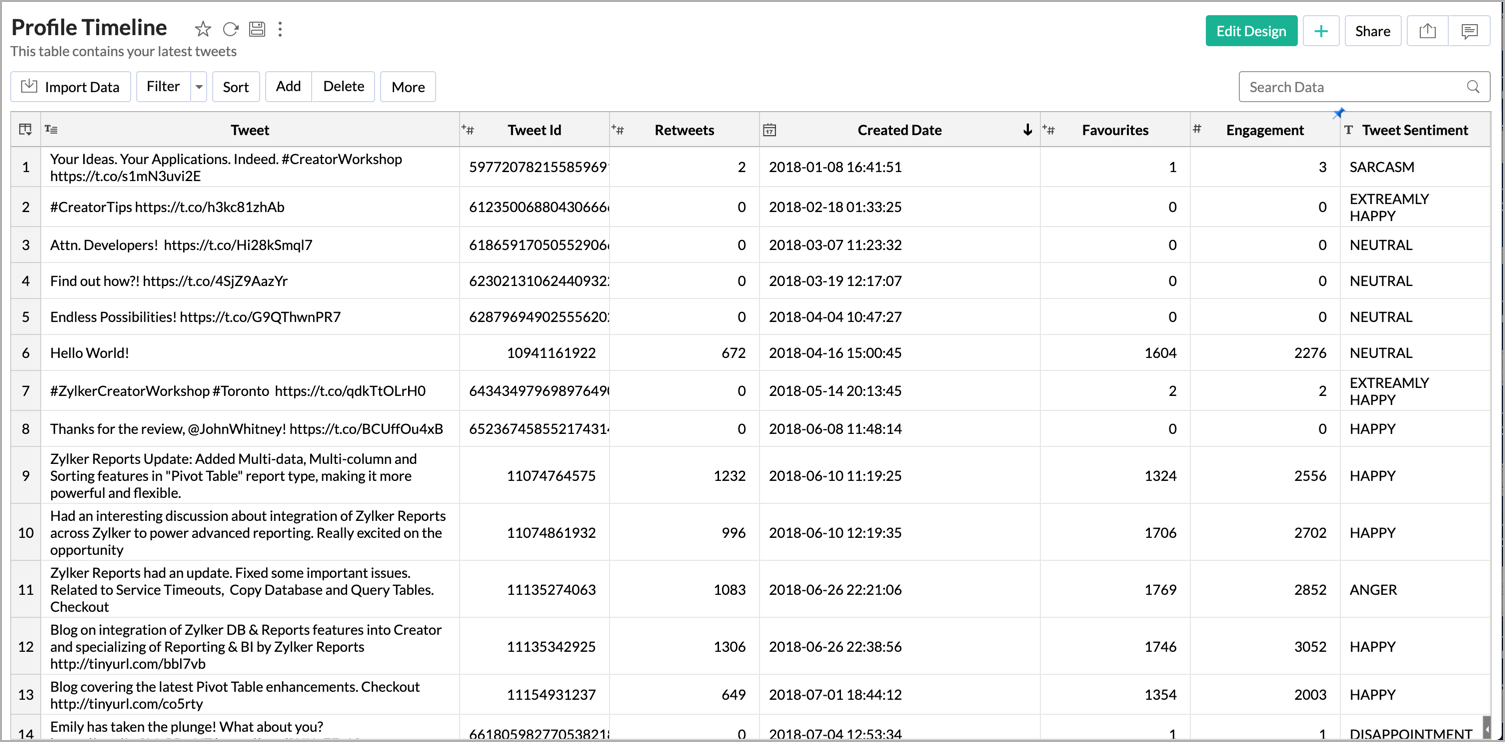
3. How do I analyze a tweet sentiment in Zoho Analytics?
Zoho Analytics provides a Tweet Sentiment column as part of your Timeline data tables and a few pre-built reports to analyze the tweets posted and tweet engagement.
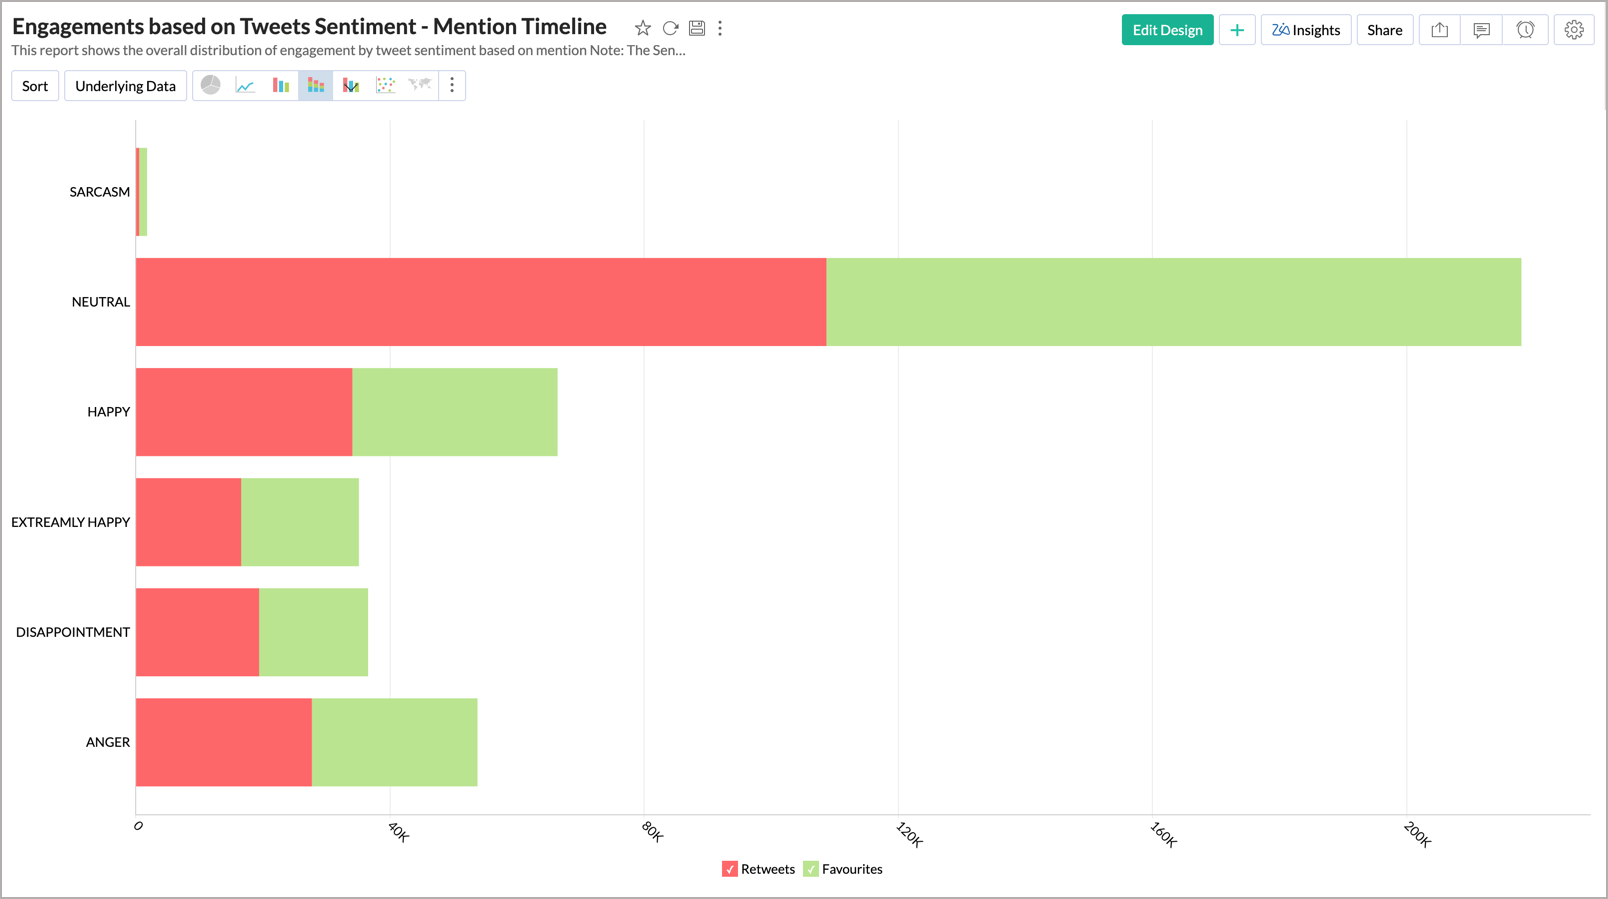
Engagements based on Tweets Sentiment - Mention Timeline
As shown in the below screenshot, you can analyze the overall distribution of engagement by tweet sentiment based on mention.
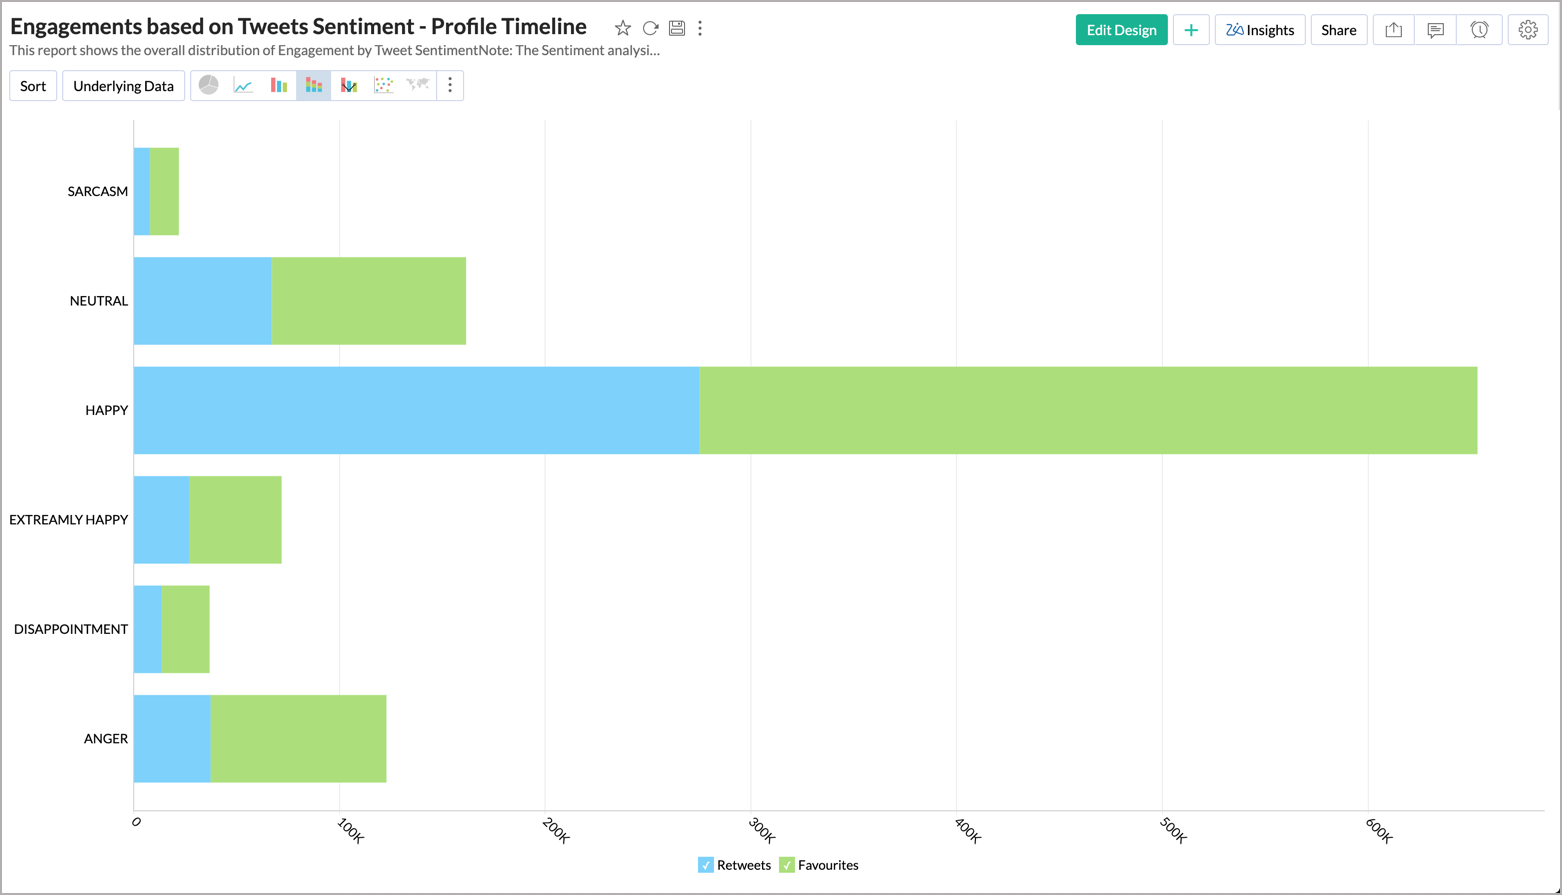
Engagements based on Tweets Sentiment - Profile Timeline
As shown in the below screenshot, you can analyze the overall distribution of engagement by tweet sentiment based on profile data.
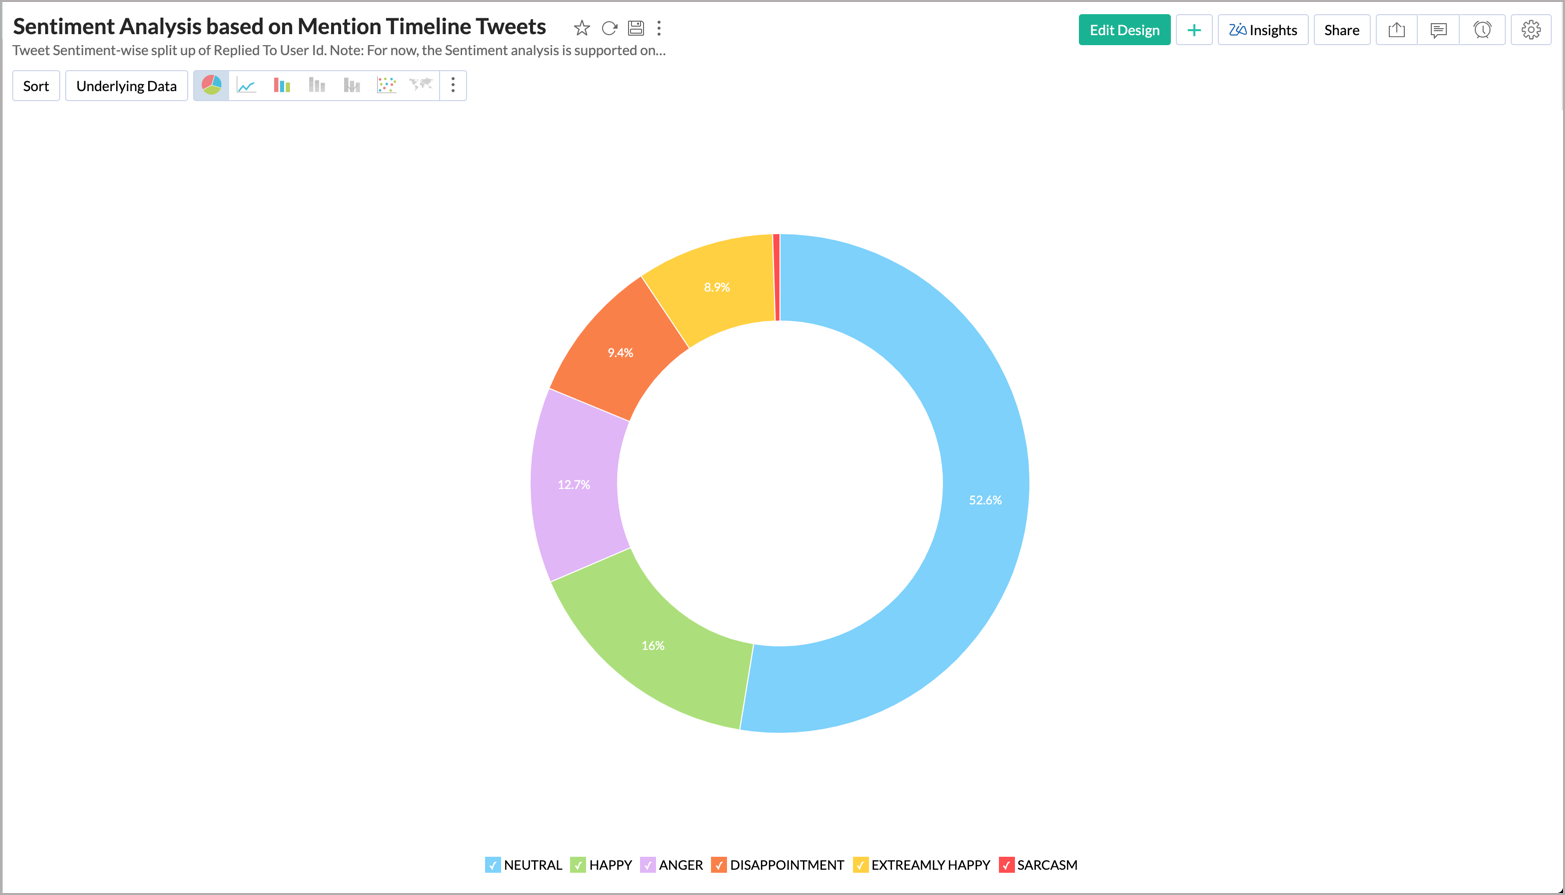
Sentiment Analysis based on Mention Timeline Tweets
As shown in the below screenshot, you can analyze the overall distribution of tweet sentiment based on the tweet mentions.
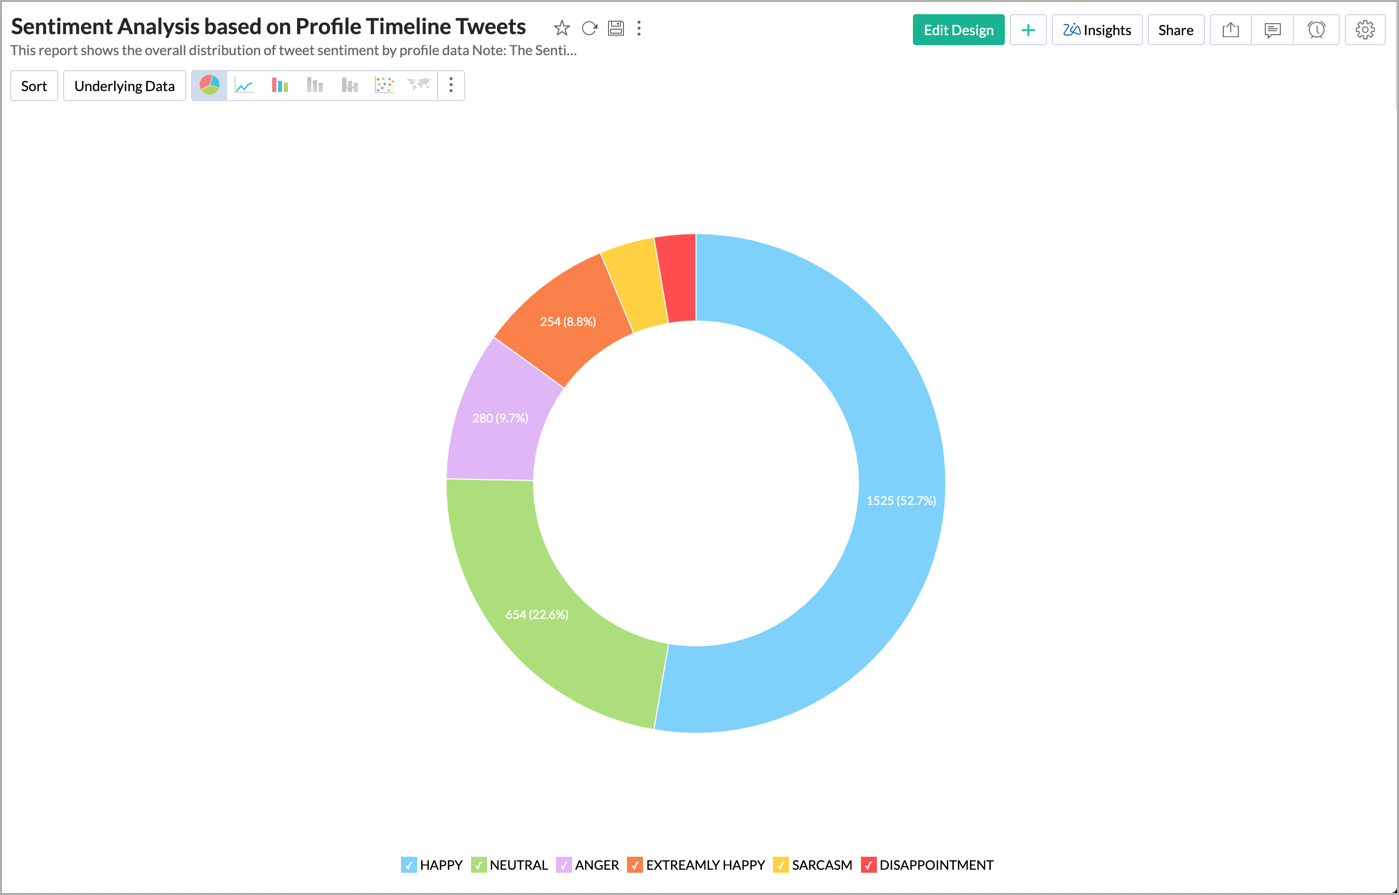
Sentiment Analysis based on Profile Timeline Tweets
As shown in the below screenshot, you can analyze the overall distribution of tweet sentiment based on profile data.
In addition to the pre-built reports, you can also create your own reports and dashboards in Zoho Analytics to analyze the tweet sentiments.
Cross-Functional Analytics with Popular Business Applications
1. What are the popular business applications that I can integrate this connector with?
You can integrate and perform cross-functional analytics with most business applications that Zoho Analytics integrates with.
2. How can I analyze the data from the other business applications along with X?
To import data from business apps,
- Open the Workspace in which you have set up the connector.
- Click the Import Data button.
- In the Create New Table tab that opens, select the application that you wish to import.
- Provide the necessary authentications.
- Select the necessary modules and fields.
- Select the schedule import option.
- Click Create. Data from the selected application will be imported into a new table in the X Analytics workspace.
3. Will a lookup relationship between the related modules from X and other third-party application be created automatically?
A lookup relationship will not be created automatically between the X modules and the modules of the application that you are trying to import. You will have to manually link the tables using a lookup relationship.
To manually create a lookup relationship refer this help link -
https://www.zoho.com/analytics/help/table/joining-tables.html
Users, Sharing & Collaboration
1. How do I share the reports in Zoho Analytics with my colleagues?
You can easily share the reports that you create with the other users in your organization. Refer to Sharing and Collaboration help page for more details on this.
Once you privately share a report to your colleagues they will be able to access the reports as you do. Refer here to know how to access the reports.
2. What are the user roles available in Zoho Analytics?
Zoho Analytics offers three user roles - Account Administrator, Workspace Administrator, and User. Click to know more about the Zoho Analytics Organization Model and User Roles.
3. Why can't other users edit the reports that I have shared to them?
This is the expected behavior. Only when the users to whom the reports are being shared is set as a Workspace Administrator, they will be able to edit the reports. If a normal user wants to edit the report, he/she will have to save the report with a new name using the Save As option toolbar. The User can edit this report. To know more about user roles click here.
4. Can I share the same report created, to multiple users with different criteria associated so that they see different data?
Yes, you can. Refer the topic Apply filter criteria.
5. Can I export a report/dashboard?
Yes, you can export the report/dashboard in various file formats such as CSV, EXCEL, PDF, HTML, and Image. Click to know more.
6. How can I print the reports & dashboards created in Zoho Analytics?
In order to print the report/dashboard, you first need to export it. You can export the report in various file formats such as CSV, EXCEL, PDF, HTML and Image. Click to know more.
If you are a user to whom a report has been shared and you want to take a print, ensure you have been provided the Export permission by the Administrator to the report, only then you will be able to print the report.
7. How can I email reports & dashboards created in Zoho Analytics in a scheduled manner?
If you are the Administrator of the Zoho Analytics or a 'Workspace Administrator', you can schedule reports and dashboards to be emailed automatically. Refer to the email schedule section in this help documentation.
Solutions
1. Can I analyze the average engagement rate of positive and negative tweets in Zoho Analytics?
Yes, you can analyze the average engagement rate of positive and negative tweets, in Zoho Analytics, by following the below steps:
Create Formula Column
You will have to create a formula column and segregate the tweet sentiments as positive, negative, and neutral. To do this,
- From the Tweets table, click Add > Formula Column.
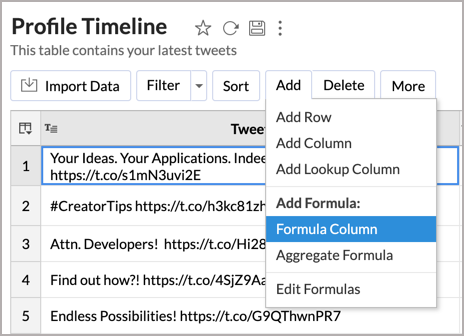
- In the Add Formula dialog,
- Provide a Formula Column Name. Here, we will name the formula column as 'Sentiment Category'.
- Add the below formula in the Formula text box. This formula categorizes Extremely Happy and Happy sentiments as Positive; Anger, Disappointed, and Sarcasm sentiments as Negative; and Neutral sentiment as Neutral.
if_case ("Tweet Sentiment", contains('Extremely Happy'),'Positive', contains('Happy'),'Positive', contains('Anger'),'Negative', contains('Disappointed'),'Negative', contains('Sarcasm'),'Negative',contains('Neutral'),'Neutral') - Click Save.

A formula column will be added to your table.
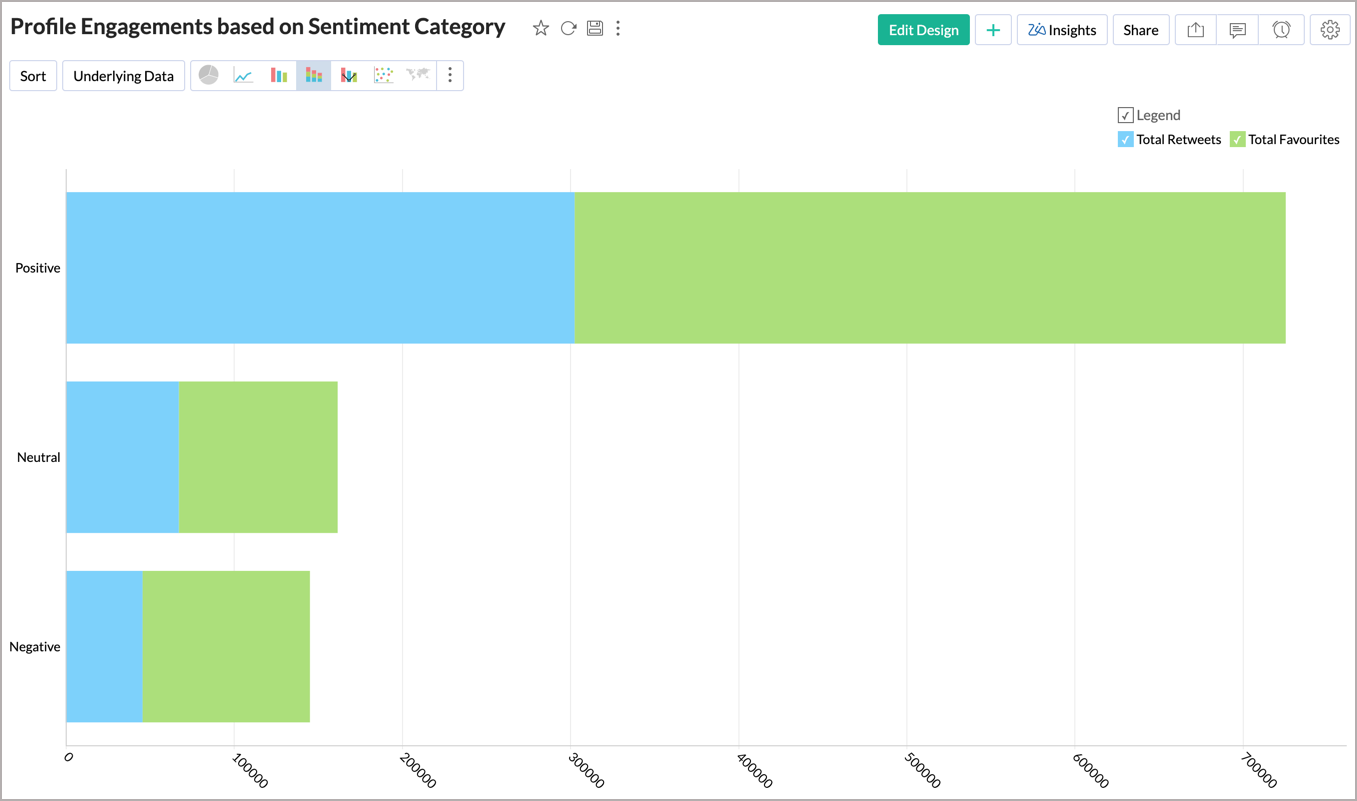
Create Report
You can create a tweet engagement report by plotting the average engagement count against the tweet handles by following the below steps:
- Add the columns, as shown below, in your chart designer:
Table Name Column Name Shelf Profile Timeline Sentiment Category -> Actual X-Axis Profile Timeline Retweets -> Sum Y-Axis Profile Timeline Favourites -> Sum Y-Axis - Click Click Here to Generate Graph.
A chart, similar to the one below, will be generated.
2. Does Zoho Analytics offer Embedded Analytics or rebranding?
Yes, Zoho Analytics supports various rebranding options such as Portal rebranding/white labeling and Logo Rebranding.
Help & Support
1. How do I get technical support on Zoho Analytics?
We offer 24x5 technical support (Monday to Friday). In case if you need our assistance kindly do mail us your questions to support@zohoanalytics.com.
You can also reach out to us on our toll-free numbers -
United States: +1 (888) 900 9646
United Kingdom: +44 (20) 35647890
Australia: +61-2-80662898
India: +91-44-67447000
2. Can I have someone from Zoho do a demo for me?
Yes, certainly. Register for a demo in this page.