

Inventory

The Inventory section contains comprehensive reports related to the inventory of your organization.
Inventory Summary
The Inventory Summary report shows you the quantity of an item sold, purchased, and currently available for each item across all warehouses for a selected period.
To generate this report:
- Go to Reports from the left sidebar.
- Select Inventory from the Report Category list.
- Click Inventory Summary.
- Set an As of date and any additional filters (Warehouse Name, Mode of Stock Tracking, Stock Availability).
- Click Run Report.
This report includes the following columns:
- Item Name: Name of the inventory item.
- SKU: Stock Keeping Unit used to identify the item.
- Reorder Level: The minimum stock level at which a replenishment order should be placed.
- Quantity Ordered: Total quantity on open purchase orders for the item.
- Quantity In: Total quantity received into stock via bills or purchase receives during the selected period.
- Quantity Out: Total quantity despatched via invoices or shipment orders during the selected period.
- Stock on Hand: Current physical stock available across all locations.
- Commited Stock: Quantity reserved against confirmed sales orders.
- Available for Sale: Quantity available to fulfil new orders.
- In-Transit: Total quantity of stock currently in transit, including in-transit purchase receipts and transfer order stock when the Shipment and Receipts filter is selected.
- Usage Unit: The unit of measurement used for the item (e.g., pcs, kg, box).
Customize Report
You can customize the Inventory Summary report to filter results by date, stock tracking mode, grouping, and more. To customize this report:
- In the Inventory Summary report page, click the Customize icon in the top right corner.
- Under General, set the following filters:
| Filter | Description |
|---|---|
| As of | Select the date up to which you want to view stock levels. The available options include preset periods such as This Month, This Quarter, This Year, and Custom. |
| Group By | Group the report results by a specific attribute. |
| Mode of Stock Tracking | Choose how stock movement is tracked in the report. Select Bills & Invoices to track stock based on purchase bills and sales invoices, or Shipments & Receipts to track stock based on shipment and purchase receive transactions. |
| Do not include Transfer Orders | Check this option to exclude stock levels impacted by transfer orders from the report. |
- Under Advanced Filters, click + Add Filters to filter the report based on specific fields. You can filter by Reports, Locations, Item, and Reporting Tag fields.
- Click Run Report.
The report will be generated based on your selected filters.
Inventory Aging Summary
The Inventory Ageing Summary report gives you a clear picture of how long you have been holding each item in stock. It groups inventory items in configurable aging intervals. Use it to identify slow-moving and stale stock before it becomes a write-off.
To view this report:
- Go to Reports on the left sidebar.
- Select Inventory from the Report Category list.
- Click Inventory Aging Summary.
The inventory aging summary report displays the following columns:
| Column | Description |
|---|---|
| Item Name | Name of the inventory item. |
| 1 - 3 Days | Quantity of stock held for 1 to 3 days. |
| Asset Value (1 - 3 Days) | Monetary value of stock held for 1 to 3 days. |
| 4 - 6 Days | Quantity of stock held for 4 to 6 days. |
| Asset Value (4 - 6 Days) | Monetary value of stock held for 4 to 6 days. |
| 7 - 9 Days | Quantity of stock held for 7 to 9 days. |
| Asset Value (7 - 9 Days) | Monetary value of stock held for 7 to 9 days. |
| 10 - 12 Days | Quantity of stock held for 10 to 12 days. |
| Asset Value (10 - 12 Days) | Monetary value of stock held for 10 to 12 days. |
| 13 - 15 Days | Quantity of stock held for 13 to 15 days. |
| Asset Value (13 - 15 Days) | Monetary value of stock held for 13 to 15 days. |
| >15 Days | Quantity of stock held for >15 days. |
| Asset Value (>15 Days) | Monetary value of stock held for >15 days. |
Customize Report
To customize this report:
- Click the Customize icon.
Under General, you can customize the report based on the following filters:
| Filters | Description |
|---|---|
| As of | Select the period for which you want to view the inventory aging details. |
| Stock Type | Select No Criteria, Moving, or Not Moving to filter the last interval based on the stock movement status. |
| Aging Intervals | Select the number of aging intervals to display in the report. |
| Intervals of | Enter the number and select the aging interval, such as Days, Weeks, Months, or Years. |
| Advanced Filters | Apply custom filters based on item fields, and locations. |
Inventory Valuation Summary
This report is a summary of the value of the stock of all the items that you have in your organization.
To view this report:
- Go to Reports > Inventory Valuation Summary under the Inventory section.
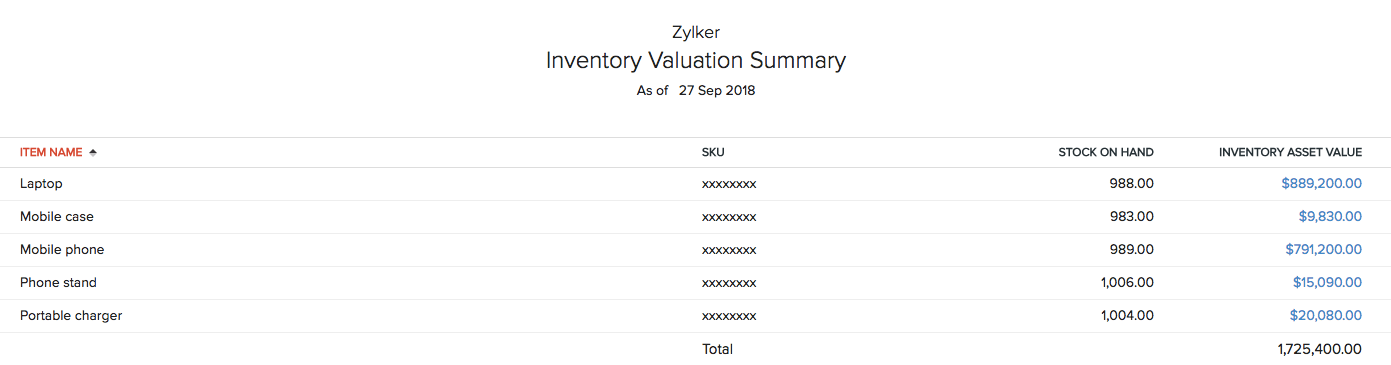
This report contains the following fields:
| Fields | Description |
|---|---|
| Item Name | Item for which you want to view the asset value. |
| SKU | Stock Keeping Unit of the item. |
| Stock on Hand | Stock you have for an item in your organization. |
| Inventory Asset Value | Total value of the stock of an item in your organization. |
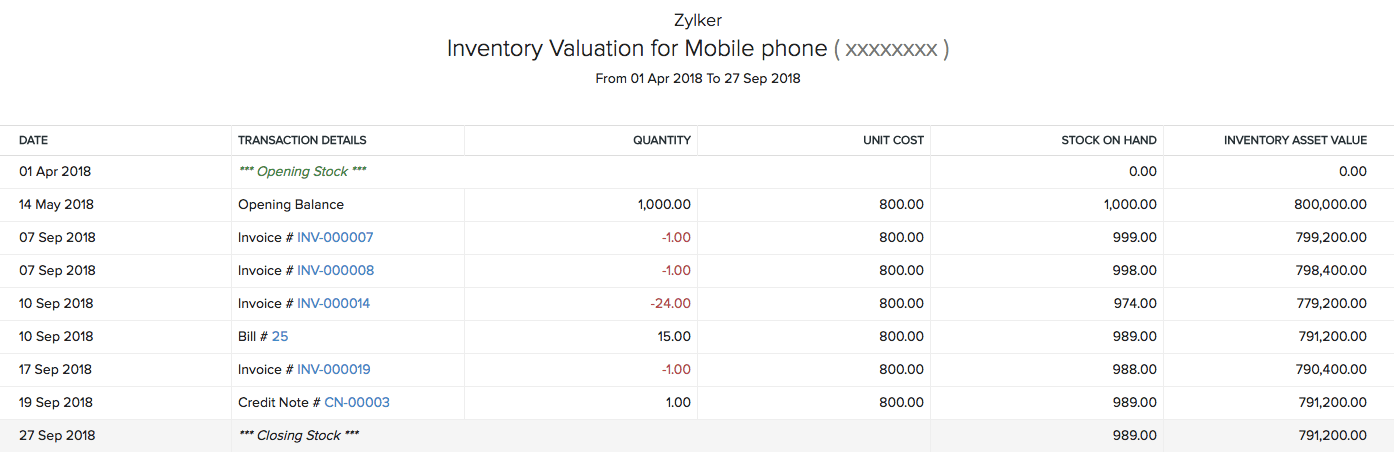
You can click any amount under the Inventory Asset Value to view its detailed drill-down summary. This will show you the opening and closing stock of an item and how it changes based on the sales and purchase transactions created for it.
To customize this report:
- Go to Reports > Inventory Valuation Summary under the Inventory section.
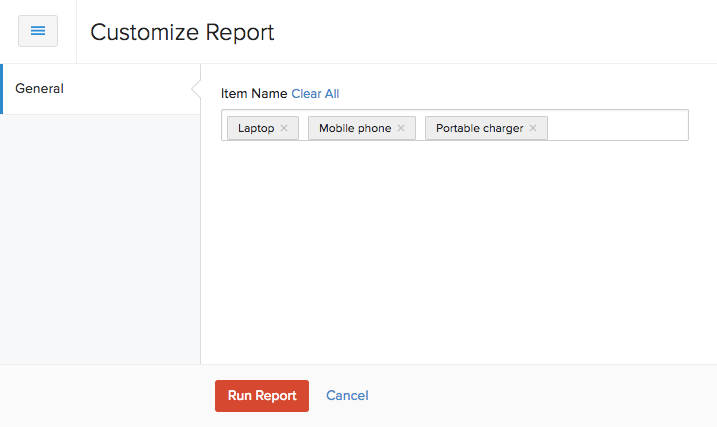
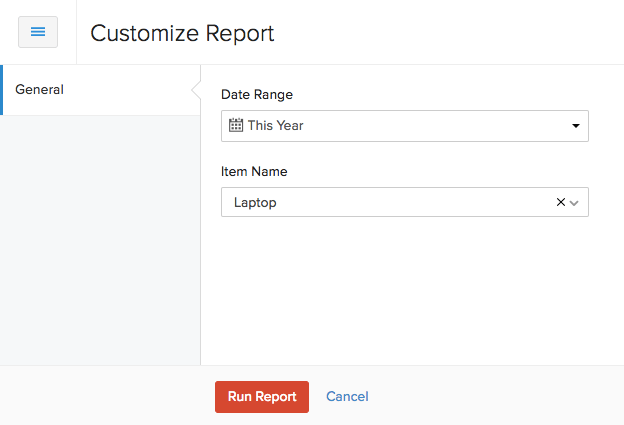
- Click Customize Report in the top of the page.
- Select the item(s) for which you want to run the report.
- Click Run Report.
FIFO Cost Lot Tracking
In the First In First Out (FIFO) concept, the stock that comes in first to the organization through any means like the opening stock, and other sales and purchase transactions gets sold out in the same order. In simple words, the stock which comes in first, goes out first.
Let’s understand this better with the help of a scenario. John has an opening stock of 100 laptops, which he enters in Zoho Books. He purchases another 50 of them from Bailey, and records a bill for it. Now, John decides to sell 2 laptops to his customer.
In this case, John will have two lots of laptops – the opening stock (100 laptops) and the stock from the bill (50 laptops). When he sells the laptops, the stock gets deducted from the opening stock first since this is his first lot . After the opening stock of 100 laptops get sold out, the stock gets deducted from the next transaction recorded in Zoho Books (in this case, the bill from Bailey).
Note:
It doesn’t matter from where John manually selects the two laptops, i.e., the opening stock or the stock received from Bailey. It will always be deducted from the first lot (in this case, the opening balance).
To view this report:
- Go to Reports > FIFO Cost Lot Tracking under the Inventory section.
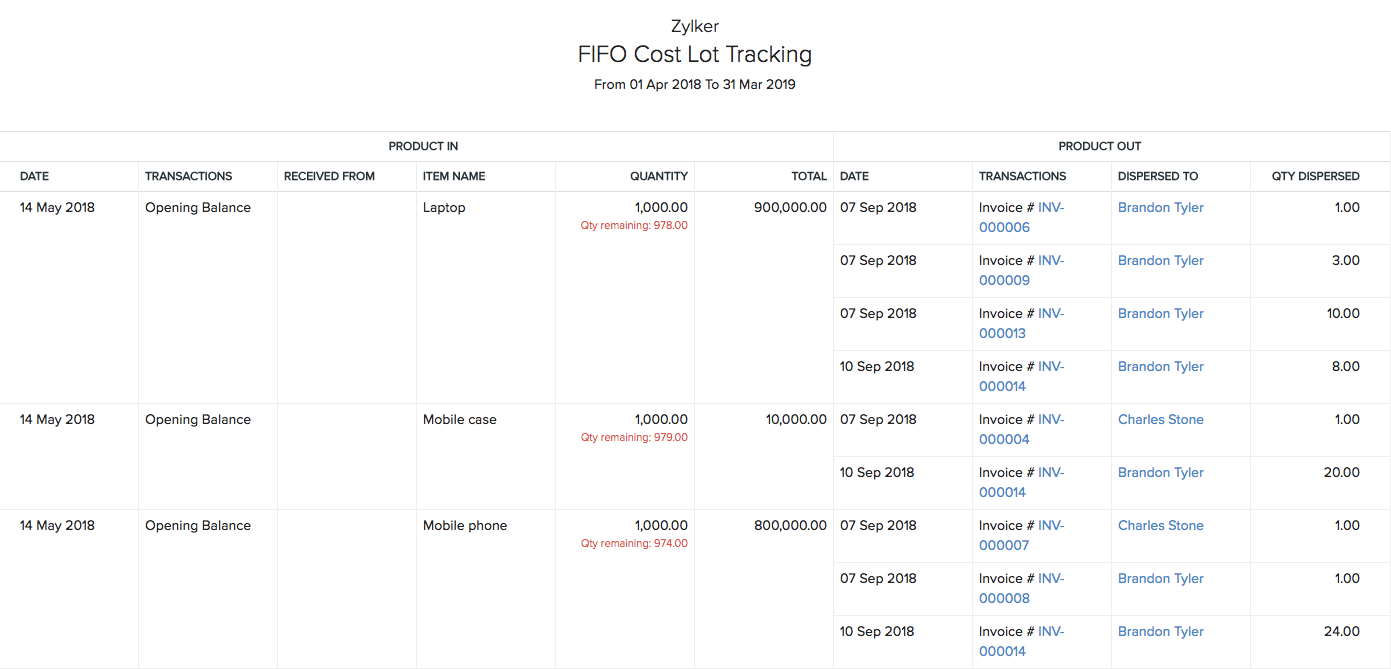
This report has two sections:
Product In
This section contains the movement of goods or services into the organization.
| Fields | Description |
|---|---|
| Date | Date on which the items were received. |
| Transactions | Transactions which facilitate the movement of goods into the organization. |
| Received From | Vendor from whom you’ve received the items. |
| Item Name | Name of the item you’ve received. |
| Quantity | Quantity of the item received. |
| Total | Total cost of all the items. |
Product Out
This section contains the movement of goods or services out of the organization.
| Fields | Description |
|---|---|
| Date | Date on which items were moved out of the organization. |
| Transactions | Transactions which facilitate the movement of goods outside the organization. |
| Dispersed To | Customer to whom you’re providing the item. |
| Qty Dispersed | Quantity of the item sold. |
You can view a detailed drill-down report by clicking any of the transactions in the report.
To customize this report:
- Go to Reports > FIFO Cost Lot Tracking under the Inventory section.
- Click Customize Report in the top of the page.
You can customize this report based on:
| Fields | Description |
|---|---|
| Date Range | Filter the report for a week, month, quarter, year or a custom period. |
| Item | Select the item for which you want to run the report. |
- Click Run Report.
ABC Classification
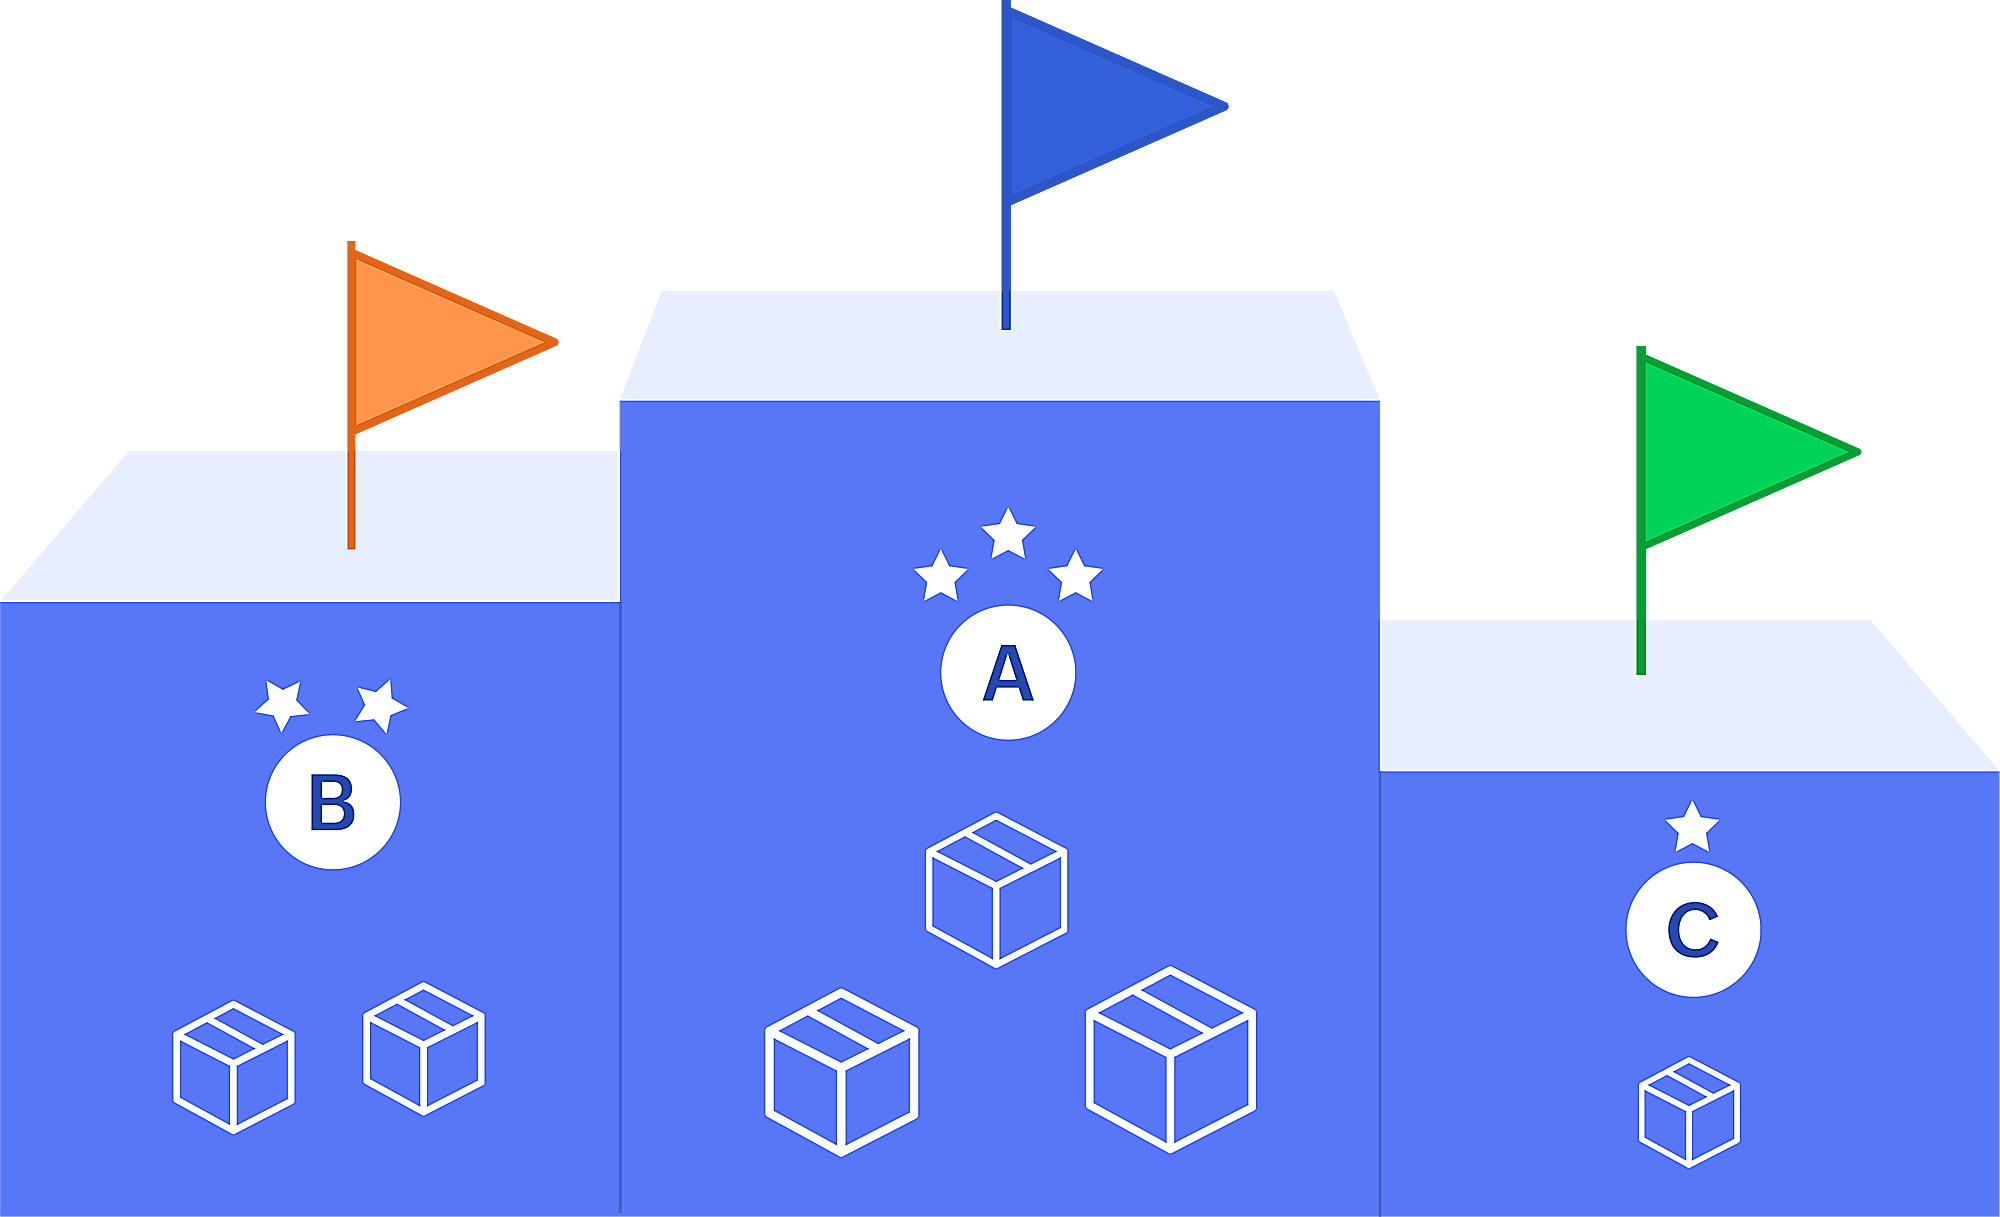
The ABC Classification report is an inventory categorization report that groups your items into three classes, namely A, B, and C, based on the revenue they generate and its impact on your business for a specific period.
| Class | Description |
|---|---|
| A | This class consists of the most revenue-generating items. These items contribute heavily to the overall profit of your company. The items listed under this class are critical for your business and require your complete focus to ensure that these items are never out of stock. |
| B | This class consists of moderately selling items that don’t have a low-impact as class C but not as crucial as class A. However, based on the shifting demands, they move into class A or class C. |
| c | This class consists of the bottom-of-the-barrel items that are usually surplus but contribute the least to your revenue. Since they take up most of the inventory space and holding costs, they do not require replenishing unless they are out of stock. |
Knowing this information will help you allocate resources to each item efficiently based on its impact. To view this report:
- Go to the Reports module on the left sidebar.
- Under Inventory, select ABC Classification.
Notes: If the number of items in your organization exceeds 1000, you cannot view this report within Zoho Books. You will have to export the report in your preferred format and view it on your device.
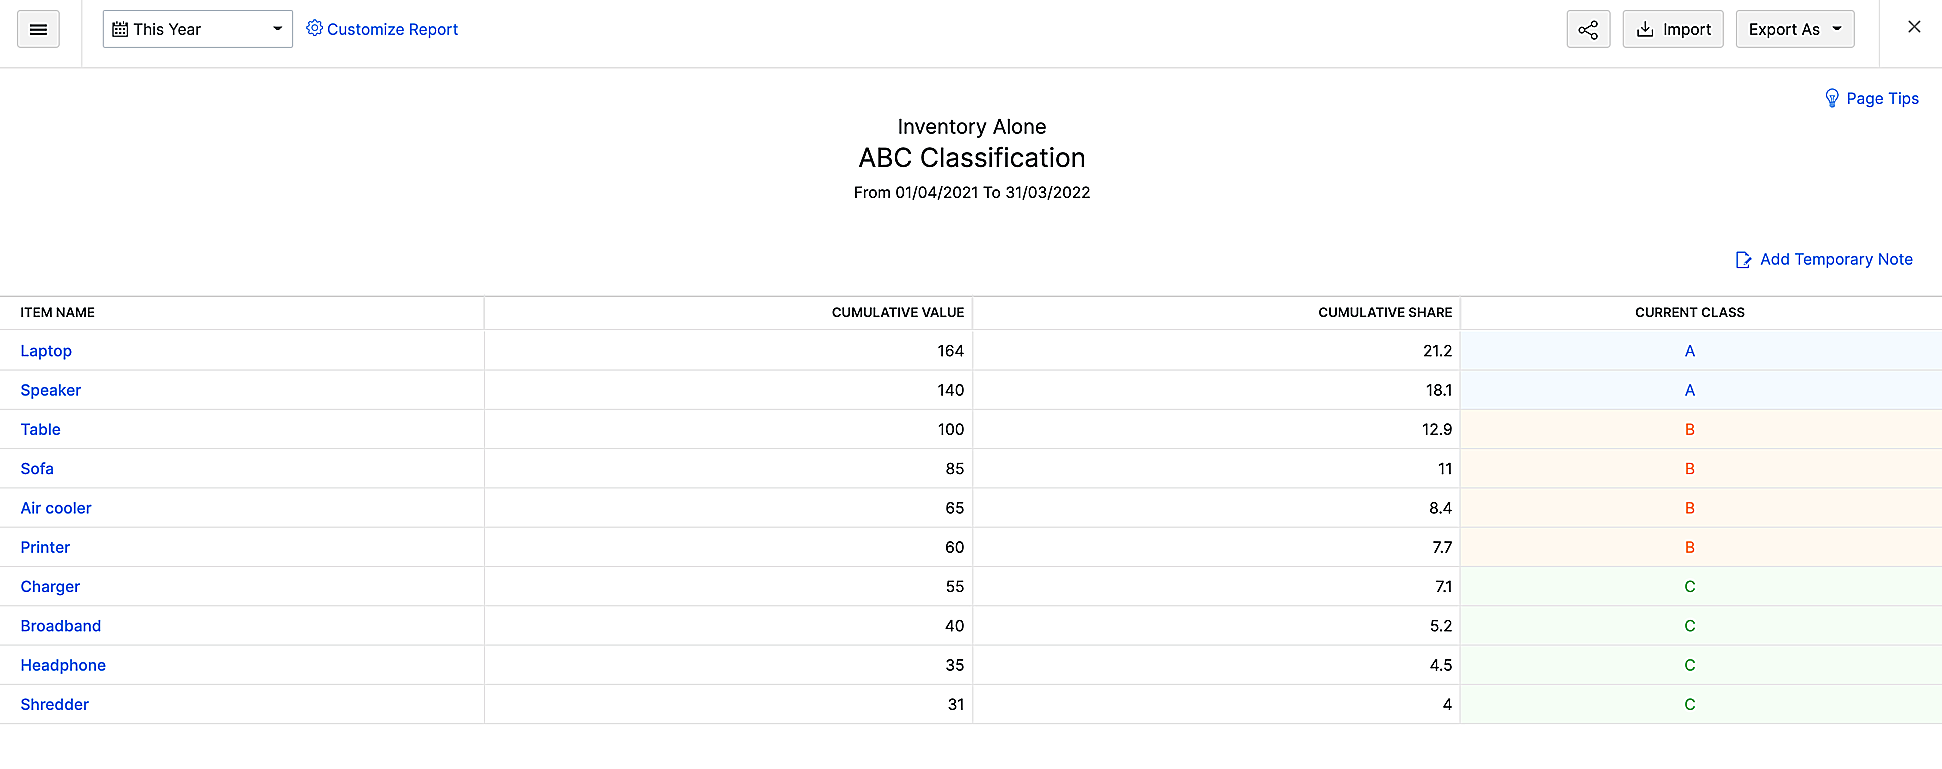
| Field | Description |
|---|---|
| Item Name | Under this header, all the items available in your organization are listed. |
| Cumulative Value | |
| Cumulative Share | Cumulative Share represents the percentage of cumulative value that each item contributes to the total cumulative value. |
| Current Class | Based on the percentage you have given for each class and the cumulative share for each item, the class assigned to all the items will be listed here. |
Customize Report
You can customize this report according to your business needs using the Customize Report option.
To customize this report:
- In the ABC Report page, click Customize Report in the top left corner.
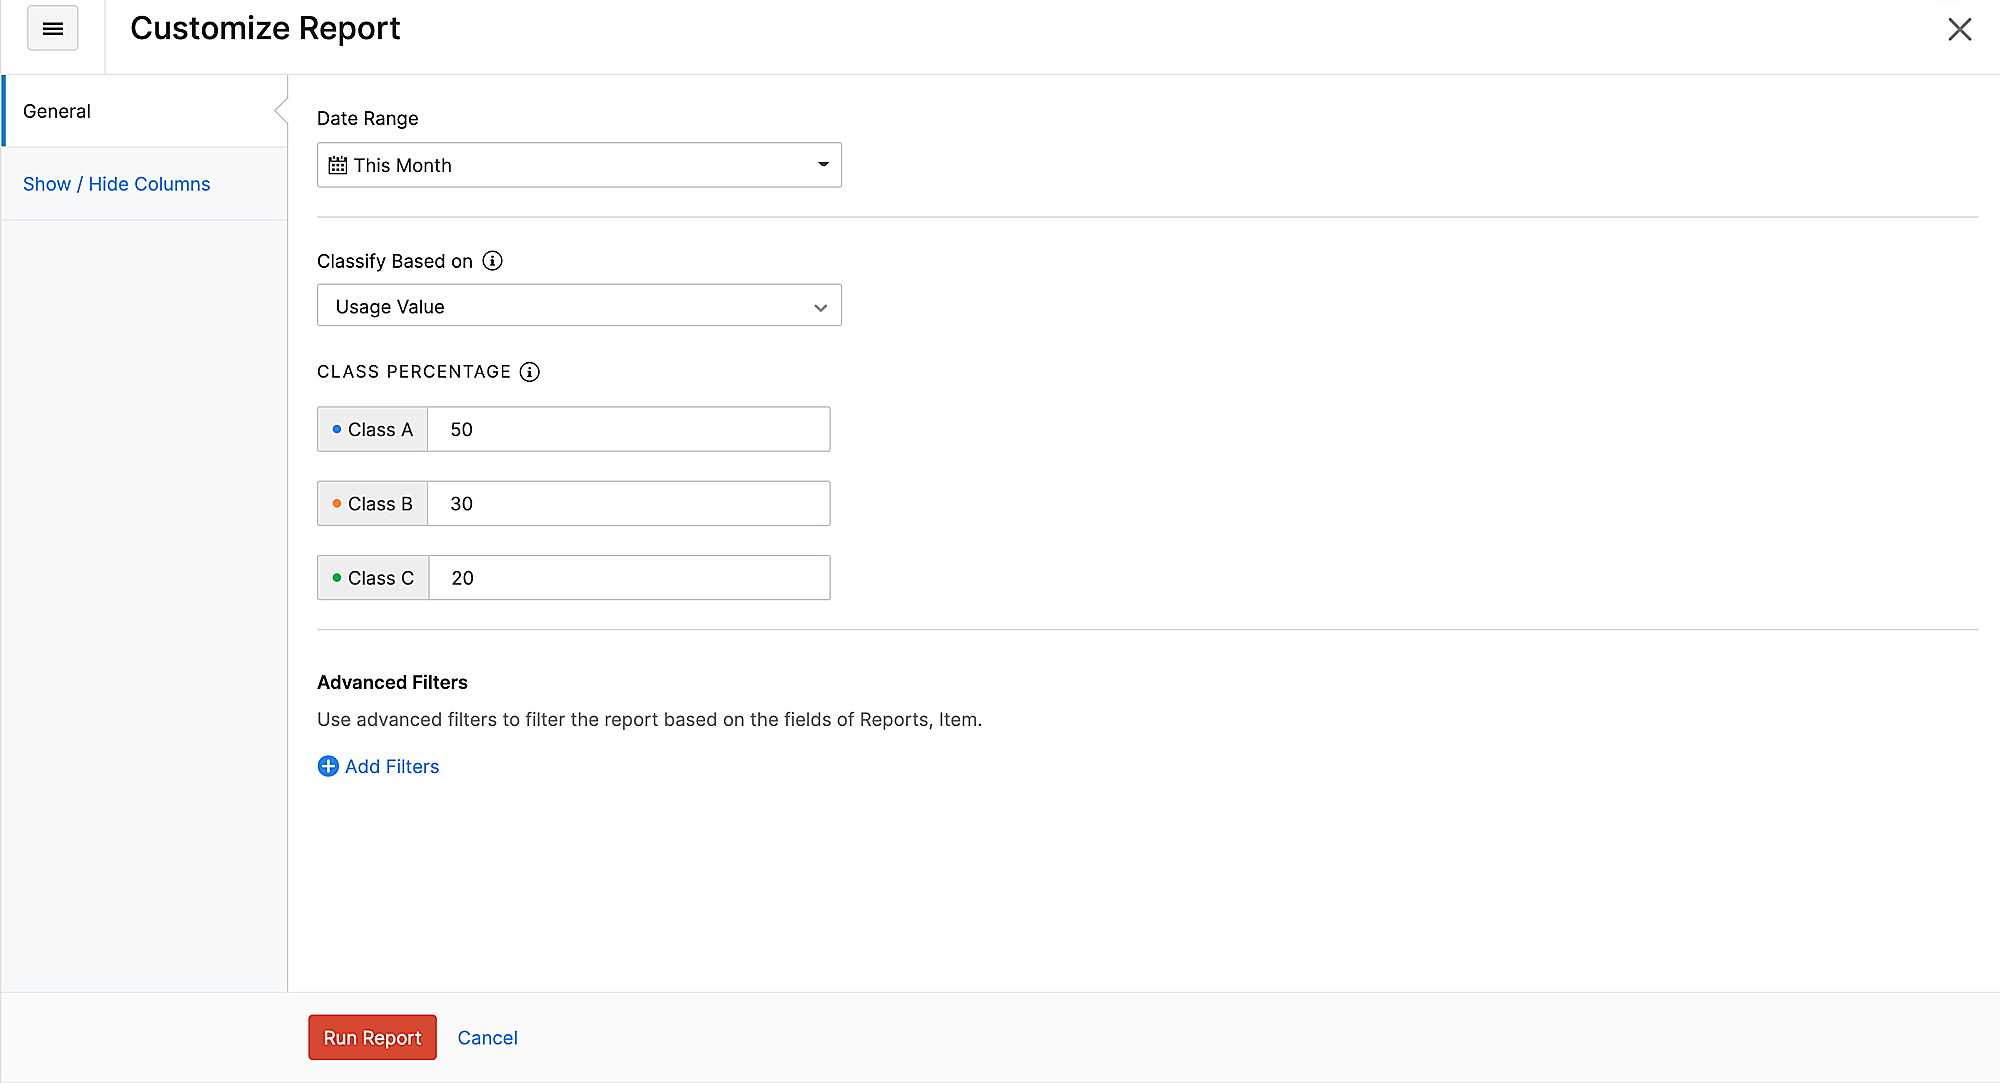
Here, you can customize the percentage limit for each class, choose the filter using which the items are classified, and select the date range. You can also add any advanced filters if you want to.
- Under Date Range, select the period within which you want to generate the report.
- Under Classify Based on, you can choose any of the two available filters. Based on your selection, the classification of the items will change.
- Usage Value: This filter will calculate the Cumulative Value of the items based on the total number of times an item was sold multiplied by its cost. If an item was sold 10 times for $100 per item, the cumulative value of that item would be 10 * 100 = 1000.
- Quantity: This filter will calculate the Cumulative Value of the items based on the number of times an item was sold.
- Under Percentages, enter the percentage limit for the classes A, B, and C.
Notes: The sum of the percentage limits of the three classes should not exceed 100.
Let’s understand how the percentage limit that you give here affects the classification of each item.
After the Cumulative Share of each item is calculated, the items are arranged in descending order. This means that the item with the highest Cumulative Share will be at the top of the report.
Let’s say that you have set the percentage limit for Class A, B, and C as 40, 40, and 20, respectively.
If the Cumulative Share of Item 1 is 39 and Item 2 is 35, Zoho Books will put Item 1 under Class A. The calculations will be repeated from the beginning. Here, 39 + 35 is 74, which is less than 80. Now, Zoho Books will put Item B under Class B. If the next item, Item 3, has a Cumulative Share of 7, the total sum of the Cumulative Share of all the items will then be 81. Since the total sum is more than 80, Zoho Books will put this item under Class C.
To sum up the example above, the first set of items whose Cumulative Shares add up to 40 will be categorized as Class A. For categorizing Class B items, the Cumulative Shares of the items are summed up from the beginning, and the set of items whose Cumulative Shares add up to 80 are grouped. All items in this group that do not belong to Class A are classified as Class B. The rest of the items in the report will be classified as Class C.
- You can also add Advanced Filters if you want to.
- Go to the Show / Hide Columns tab to modify the columns that appear in the report.
- Choose the columns that you want to view or remove in your report.
- Click Run Report, and the ABC Classification report will be generated based on your preferences.
Export Report
To export a report:
- Go to the Reports module on the left sidebar.
- Under Inventory, select ABC Classification.
- Click the Export As dropdown in the top right corner and select your preferred format for export.
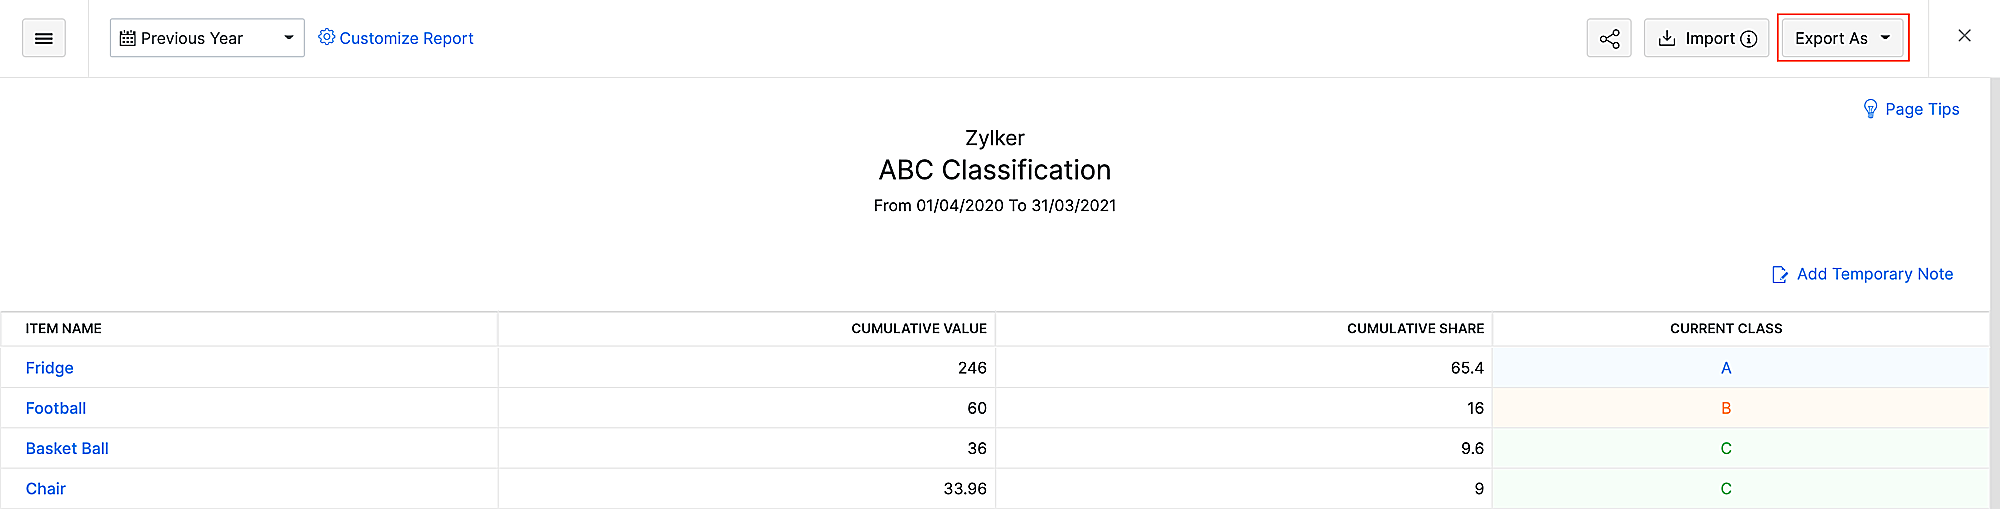
- Select your preferences, and click Export.
The report will be exported in your preferred format.
Other than having it saved offline, the exported file can also be used to get more insights. Let’s see how:
Import Report
Notes: Before you import the report, ensure that you have moved the Previous Class column from the Available Column to Selected Column. To do this, go to Customize Report > Show / Hide Columns.
Importing a previously exported report and comparing it with the current report shows how your items have performed over a certain period. If an item in Class C in the previous report increased its sales, it would be moved to Class B or even Class A based on the percentage of improvement in the current report. Knowing these details will help you shift your focus on these items. To import a report:
- Go to the Reports module on the left sidebar.
- Under Inventory, select ABC Classification.
- Click Import in the top right corner.
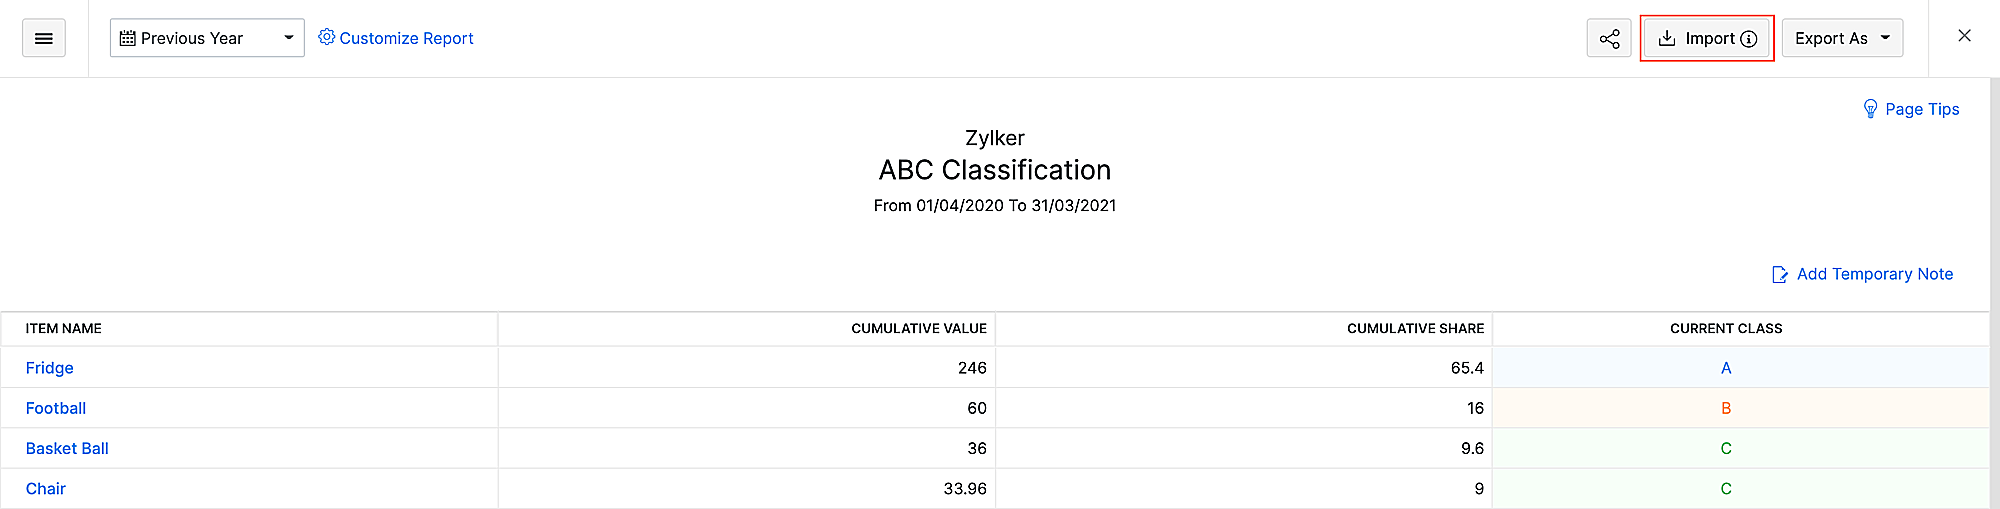
- Next to Upload File, click Choose File to upload the exported report.
- If you want to overwrite duplicate records, select the Overwrite radio button.
- Select the Character Encoding based on your import file.
- In the next step, map the fields from the file to fields in Zoho Books and click Next.
- Click Import.
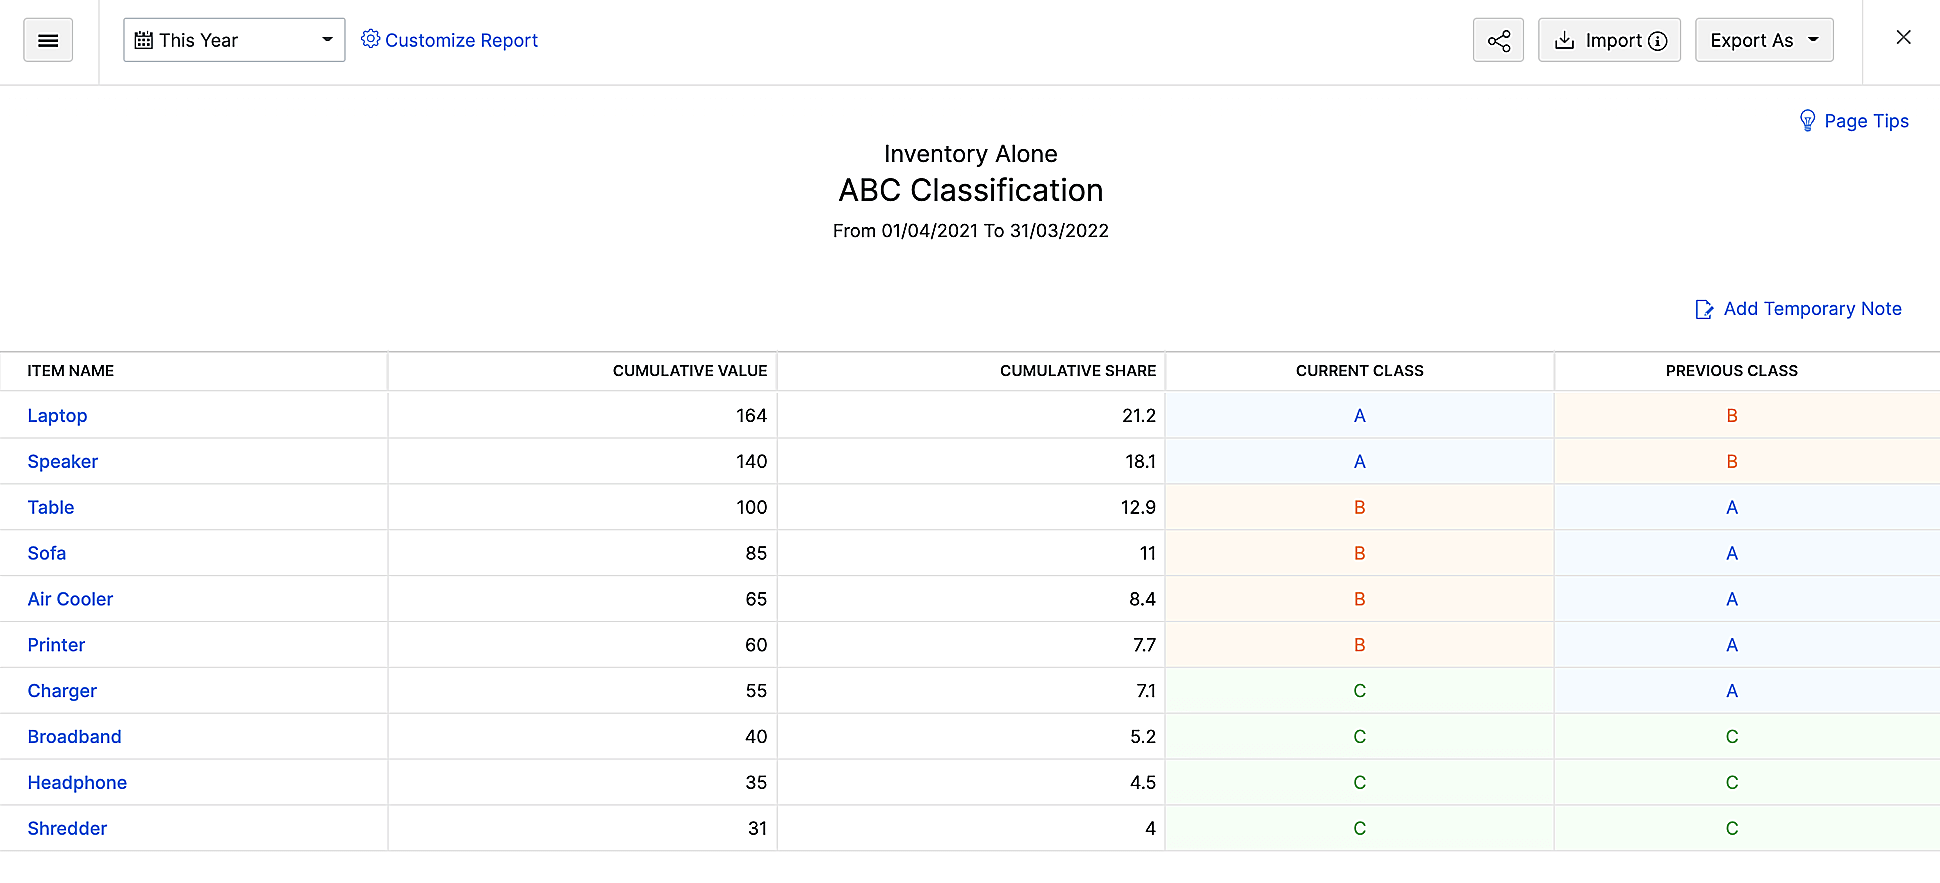
After the file is imported, the class from the imported file will be shown under Previous Class in the current report.
Inventory Adjustment Summary
This report provides a clear overview of inventory adjustments made within a specific date range in Zoho Books. It shows increases and decreases in quantity and value, grouped by date, reason, or adjustment type. This report helps you quickly understand the overall impact of inventory adjustments on stock levels and inventory value.
To view this report:
- Go to Reports on the left sidebar.
- Scroll down to the Inventory section, and select Inventory Adjustment Summary.
The report will be displayed, and it contains the following sections:
Reference Number: The reference number associated with the inventory adjustment for internal use.
Date: The date on which the adjustment was recorded.
Status: It displays whether the adjustment is in Draft or Adjusted status.
Inventory Adjustment Reason: The reason provided while recording the adjustment.
Adjustment Type: It displays whether the adjustment was made by quantity or value of the stock.
Quantity Increased: It displays how much the quantity of the inventory item was added.
Quantity Decreased: It displays how much the quantity of the inventory item was removed.
Value Increased: It displays how much the value of the inventory item was increased.
Value Decreased: It displays how much the value of the inventory item was decreased.
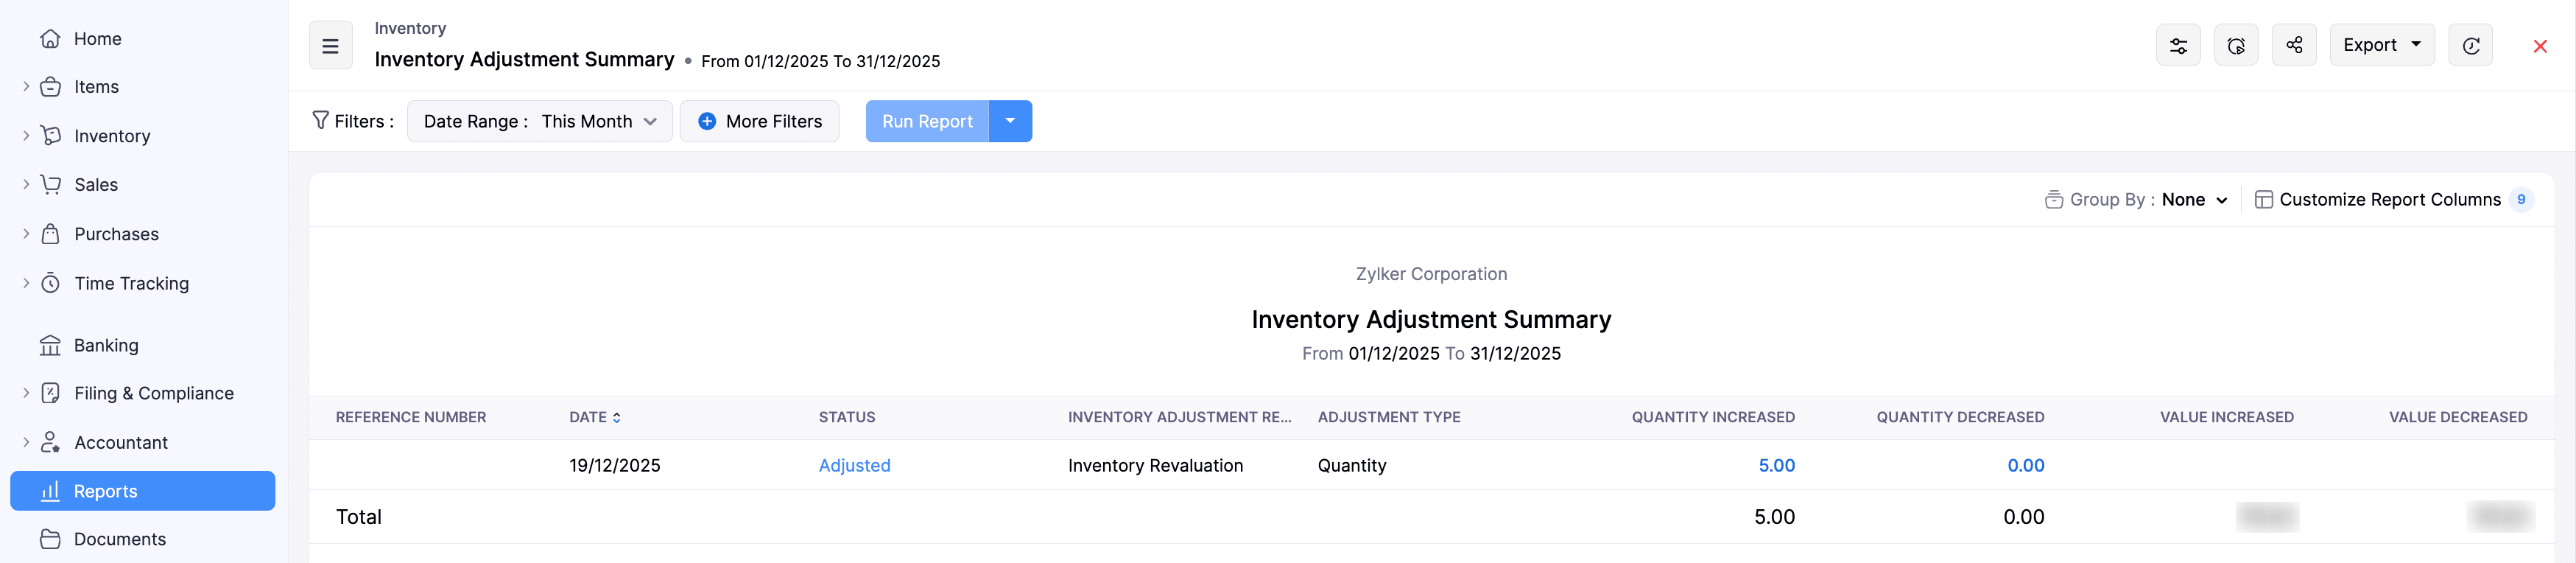
To customize this report:
- In the Inventory Adjustment Summary report page, click the Customize icon in the top right corner.
- In the next page, under General, fill in the following fields:
- Date Range: Choose the date range for which you want to generate the report.
- Group By: Choose how you want to group the records in the report. The available options are Date, Inventory Adjustment Reason, and Adjustment Type.
- Advanced Filters: Click + Add Filters to filter the report based on your preferences.
- Navigate to Show/Hide Columns on the left sidebar, and choose which columns must appear in the report.
- Click Run Report.
The report will be generated, based on your preferences.
To share this report with other users in your organization:
- In the Inventory Adjustment Summary report page, click the Share Report icon in the top right corner.
- In the Share Report pop-up, fill in the following fields:
- Users: Select users to grant access to this report.
- Permissions: Configure permissions for the selected users. The available options are View only and View and Export.
- Click Add Users. The selected users will be listed below.
- Check the Skip Module Access option next to the added user if you want them to access the report, even if they don’t have access to the associated modules.
Note: If you want to remove a user, click the Remove icon next to the listed user in the Share Report pop-up.
Click Share.
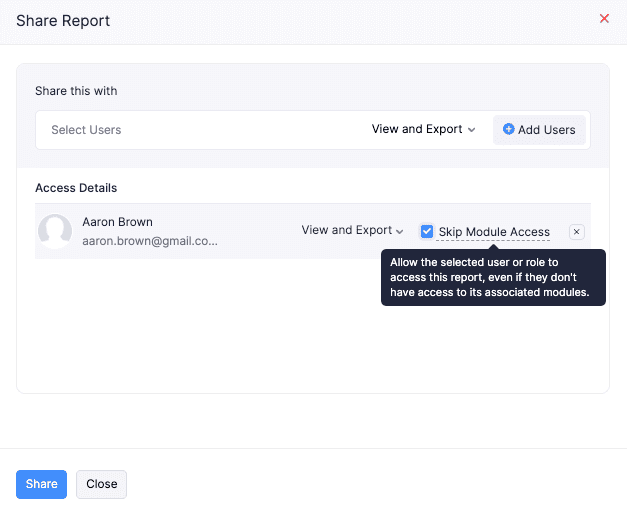
The report will be shared with the selected users, and they can access it based on chosen preferences.
Inventory Adjustment Details
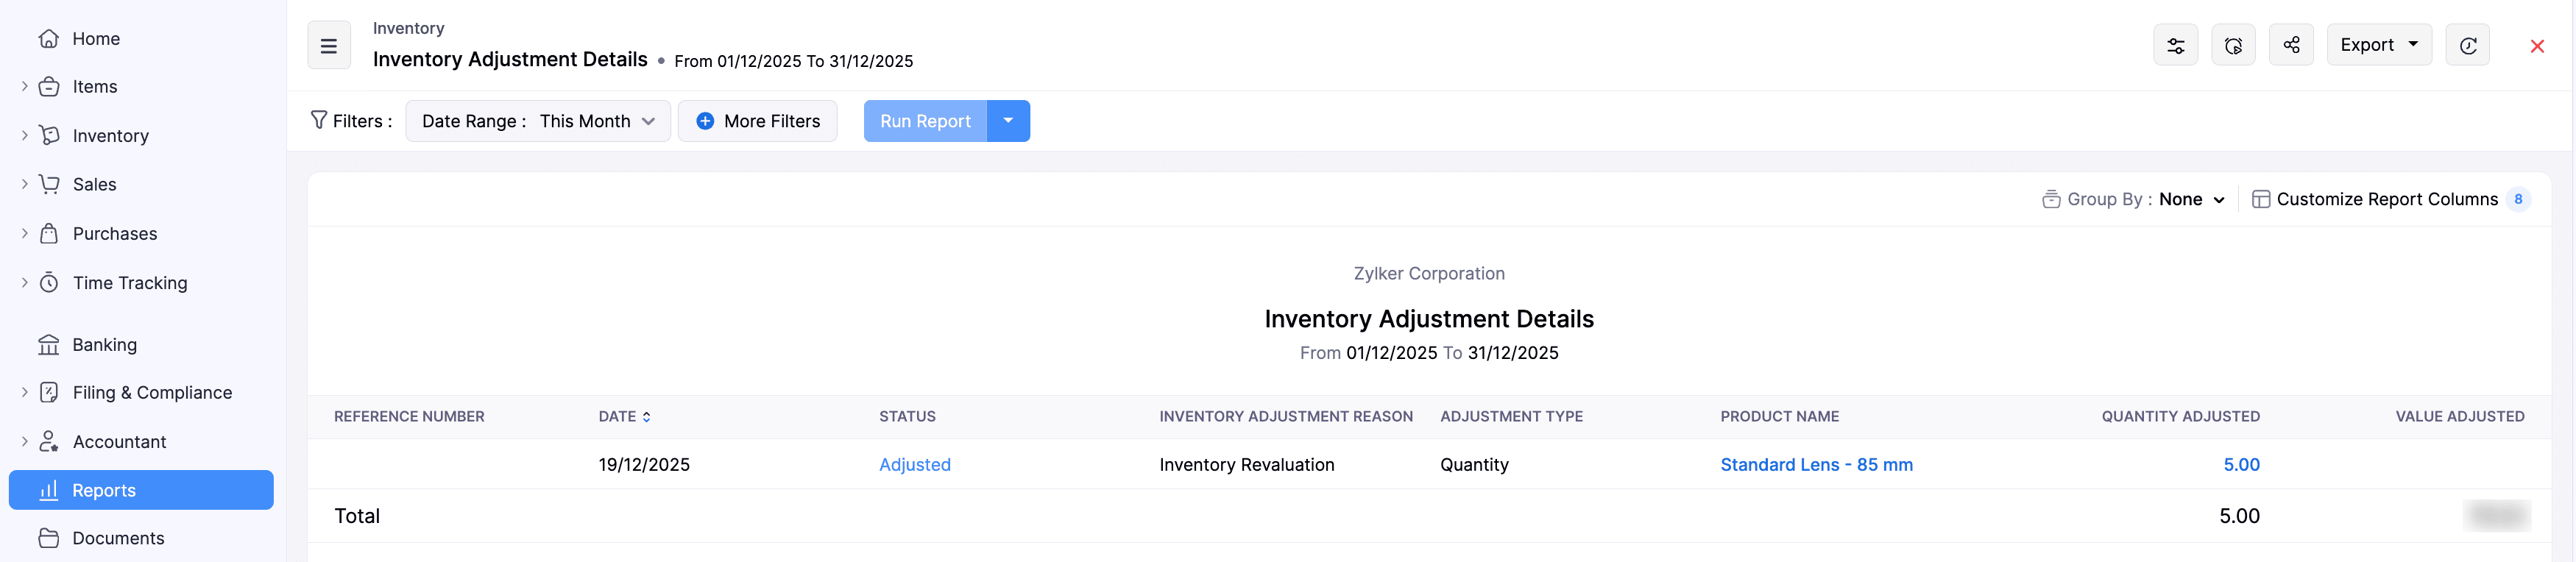
This report shows complete details of every inventory adjustment recorded in Zoho Books. It displays the reason, status, adjustment type, and exact quantity and value changes for each adjustment.
To view this report:
- Go to Reports on the left sidebar.
- Scroll down to the Inventory section, and select Inventory Adjustment Details.
The report will be displayed, and it contains the following sections:
Reference Number: The reference number associated with the inventory adjustment for internal use.
Date: The date on which the adjustment was recorded.
Status: It displays whether the adjustment is in Draft or Adjusted status.
Inventory Adjustment Reason: The reason provided while recording the adjustment.
Adjustment Type: It displays whether the adjustment was made by quantity or value of the stock.
Quantity Adjusted: It displays how much the quantity of the inventory items were adjusted.
Value Adjusted: It displays how much value of inventory items was adjusted.
To customize this report:
- In the Inventory Adjustment Details report page, click the Customize icon in the top right corner.
- In the next page, under General, fill in the following fields:
- Date Range: Choose the date range for which you want to generate the report.
- Group By: Choose how you want to group the records in the report. The available options are Date, Inventory Adjustment Reason, and Adjustment Type.
- Advanced Filters: Click + Add Filters to filter the report based on your preferences.
- Navigate to Show/Hide Columns on the left sidebar, and choose which columns must appear in the report.
- Click Run Report.
The report will be generated, based on your preferences.
To share this report with other users in your organization:
- In the Inventory Adjustment Details report page, click the Share Report icon in the top right corner.
- In the Share Report pop-up, fill in the following fields:
- Users: Select users to grant access to this report.
- Permissions: Configure permissions for the selected users. The available options are View only and View and Export.
- Click Add Users. The selected users will be listed below.
- Check the Skip Module Access option next to the added user if you want them to access the report, even if they don’t have access to the associated modules.
Note: If you want to remove a user, click the Remove icon next to the listed user in the Share Report pop-up.
Click Share.
The report will be shared with the selected users, and they can access it based on chosen preferences.
 Yes
Yes