Gain visual insights into projects data through Zoho Analytics
Zoho Analytics is a business intelligence and reporting tool that helps you turn projects data into powerful reports with no IT help. In addition to the ready-to-use reports and charts, you can also create your own with an easy drag-and-drop interface. With such advanced analytics at your disposal, your team can easily take quick and well-informed decisions.

Full-featured business intelligence
Gain access to a wide range of reporting and analytics tools that help turn raw data into easily understandable visuals. Zoho Analytics also comes with capabilities to share and publish reports and embed them across websites, intranets or blogs.
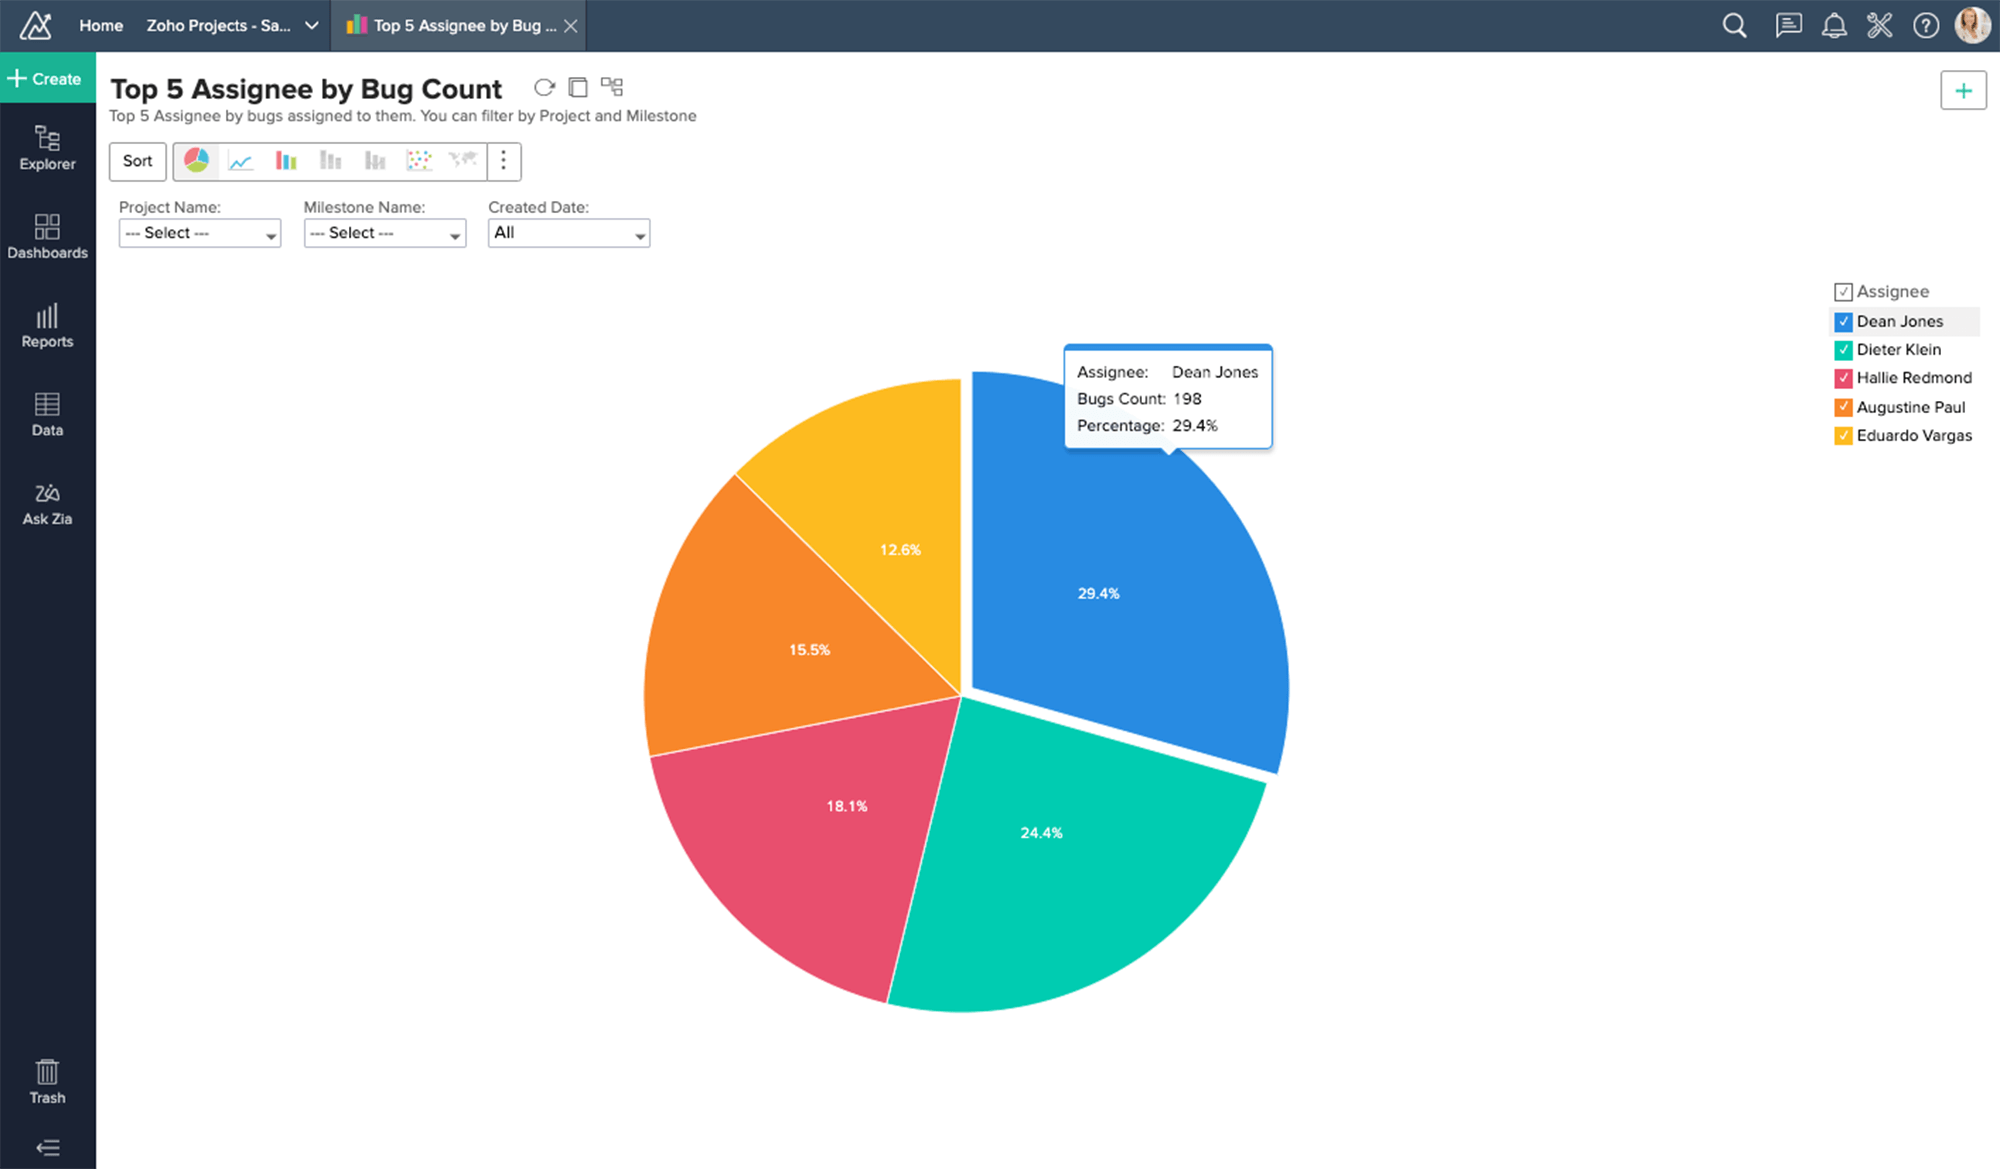
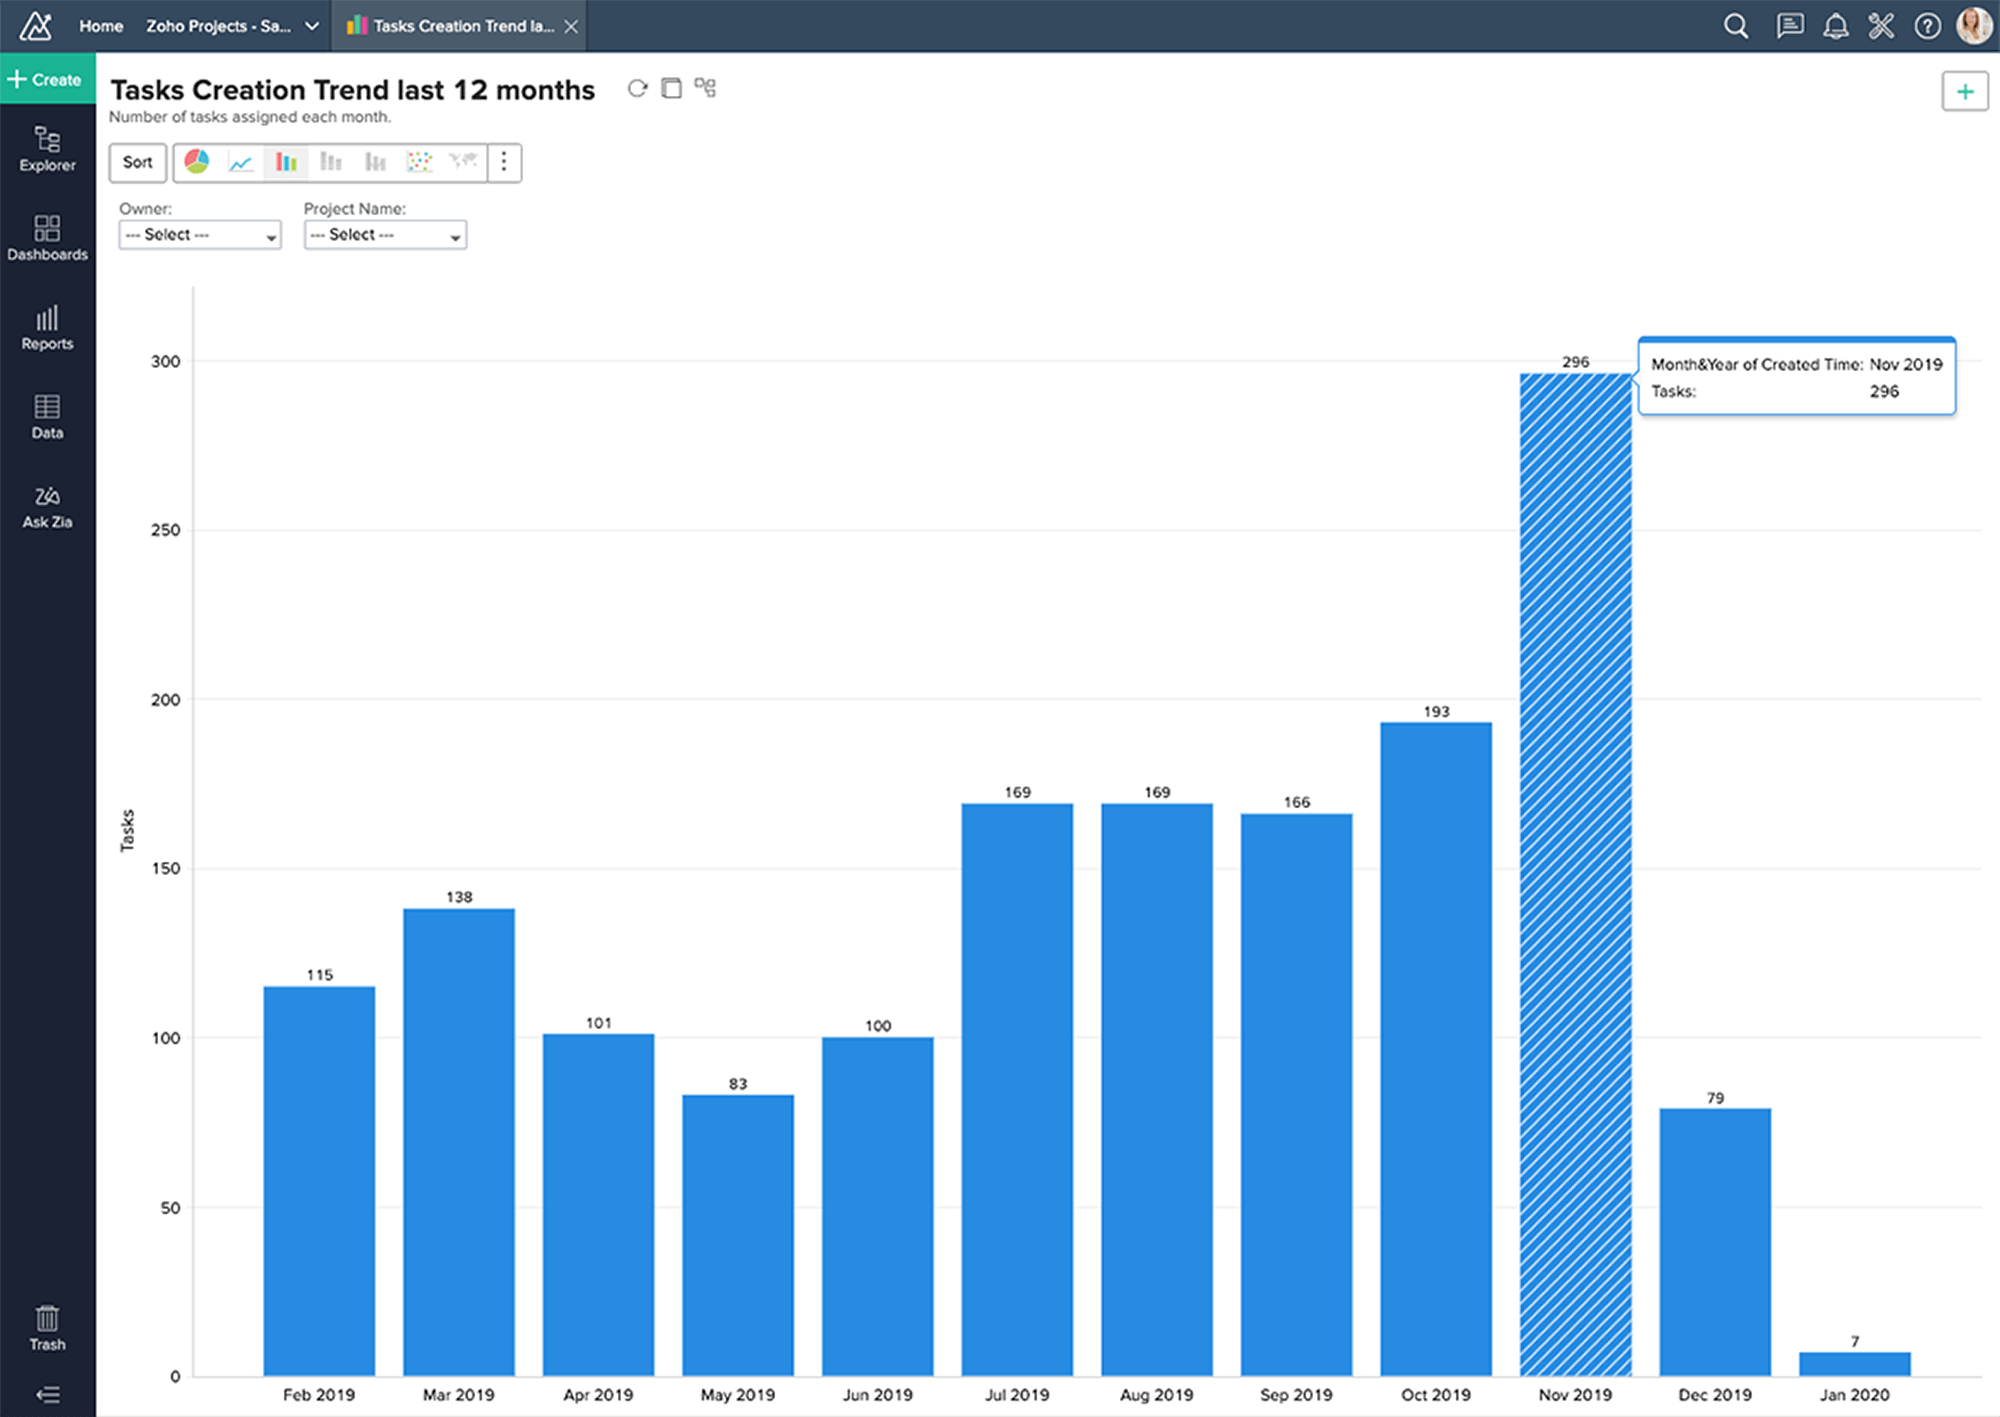
Ready-made reports and dashboard
Data such as milestones, tasks, task owners, timesheets, issues and users are automatically synced with Zoho Analytics. Even before you create your very first chart, you already have access to more than 50 ready-to-use reports and dashboards.
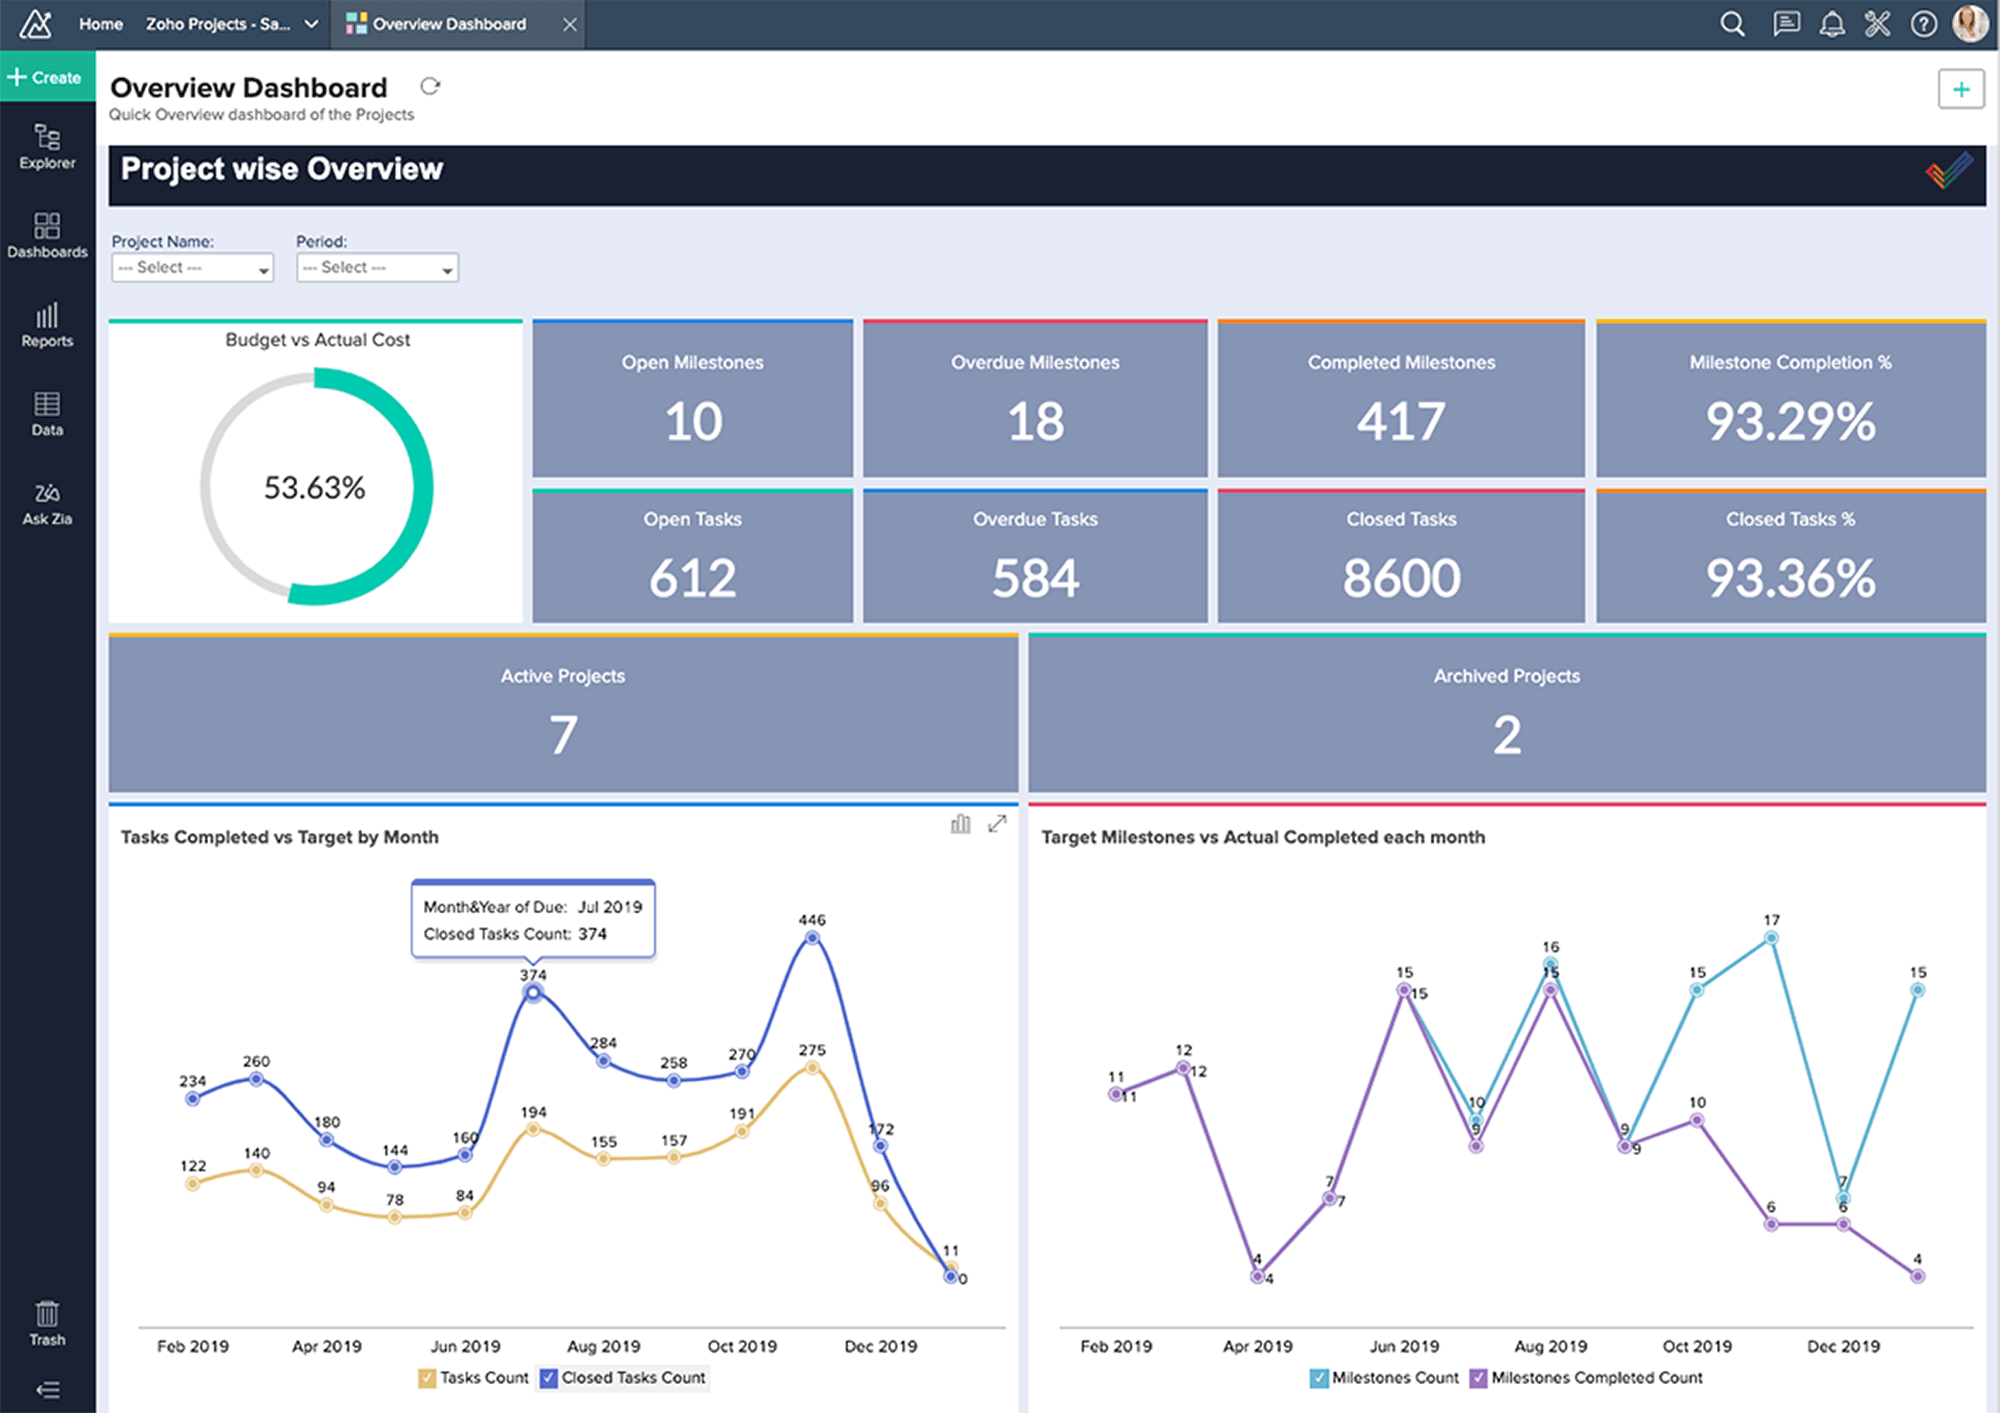
Visualize and understand key project metrics
Combine data from different modules to understand how your projects are progressing. For example, view the delayed tasks and milestones by users, analyze the completion rate, calculate revenue based on ongoing projects and so on. This helps you not only keep track but also manage projects proactively.