Analytics- Use Cases
- To create a department wise employee count report across locations of my organization
- To create a report for viewing employee vs hours logged for individual jobs
- To create a report to view time logs for a particular month for employees
- To create a report to view estimated hours against logged hours for employees
- To generate a report to view the billable status of jobs for specific employees
- To generate a report to see employees' weekly time log details for a particular client
- To create a report to see the monthly count of new joinees in each department
- To create a report to view the monthly leave trend of a specific employee
To create a department wise employee count report across locations of my organization
A report on the number of employees in each department can help you plan your hiring process better. This can be easily obtained using Analytics.
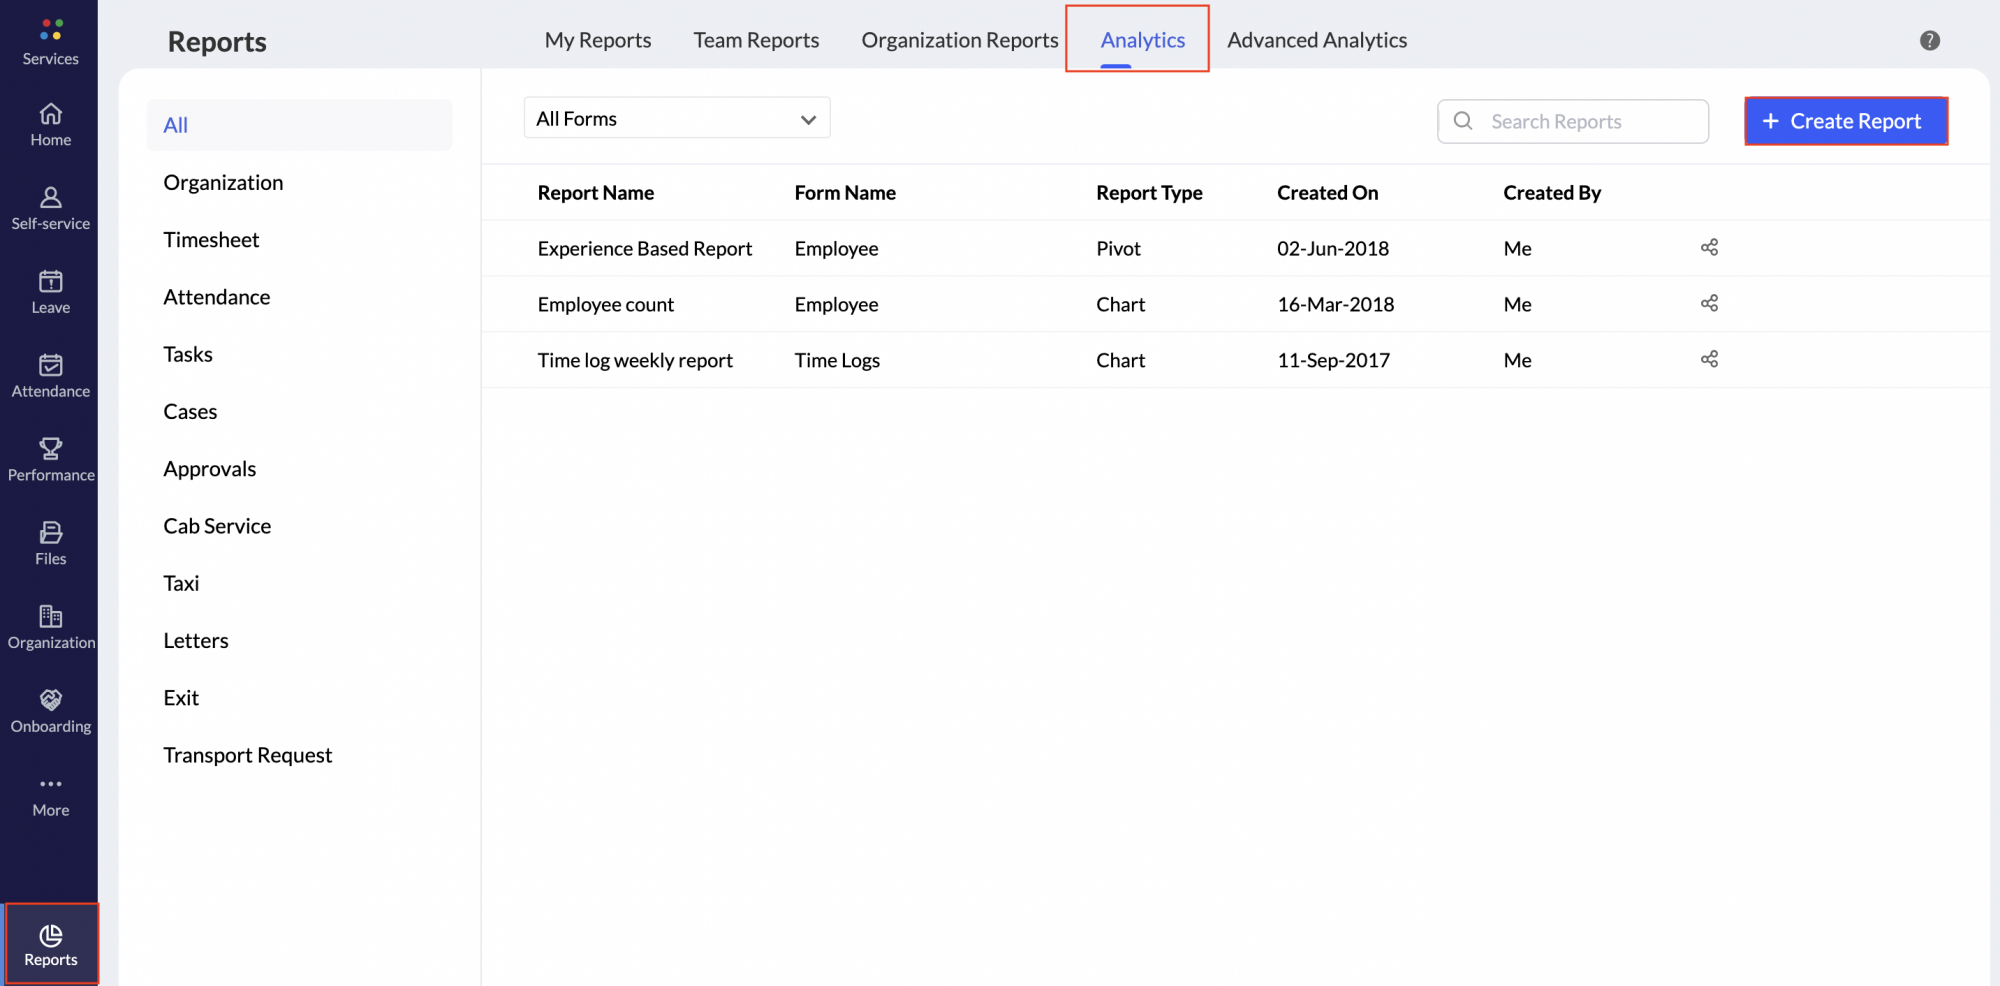
- From your home page, go to Analytics > Create Report
- Give Employee Count Report as Report name
- Under Report Type, select Chart
- Under Report Based on, select Employee
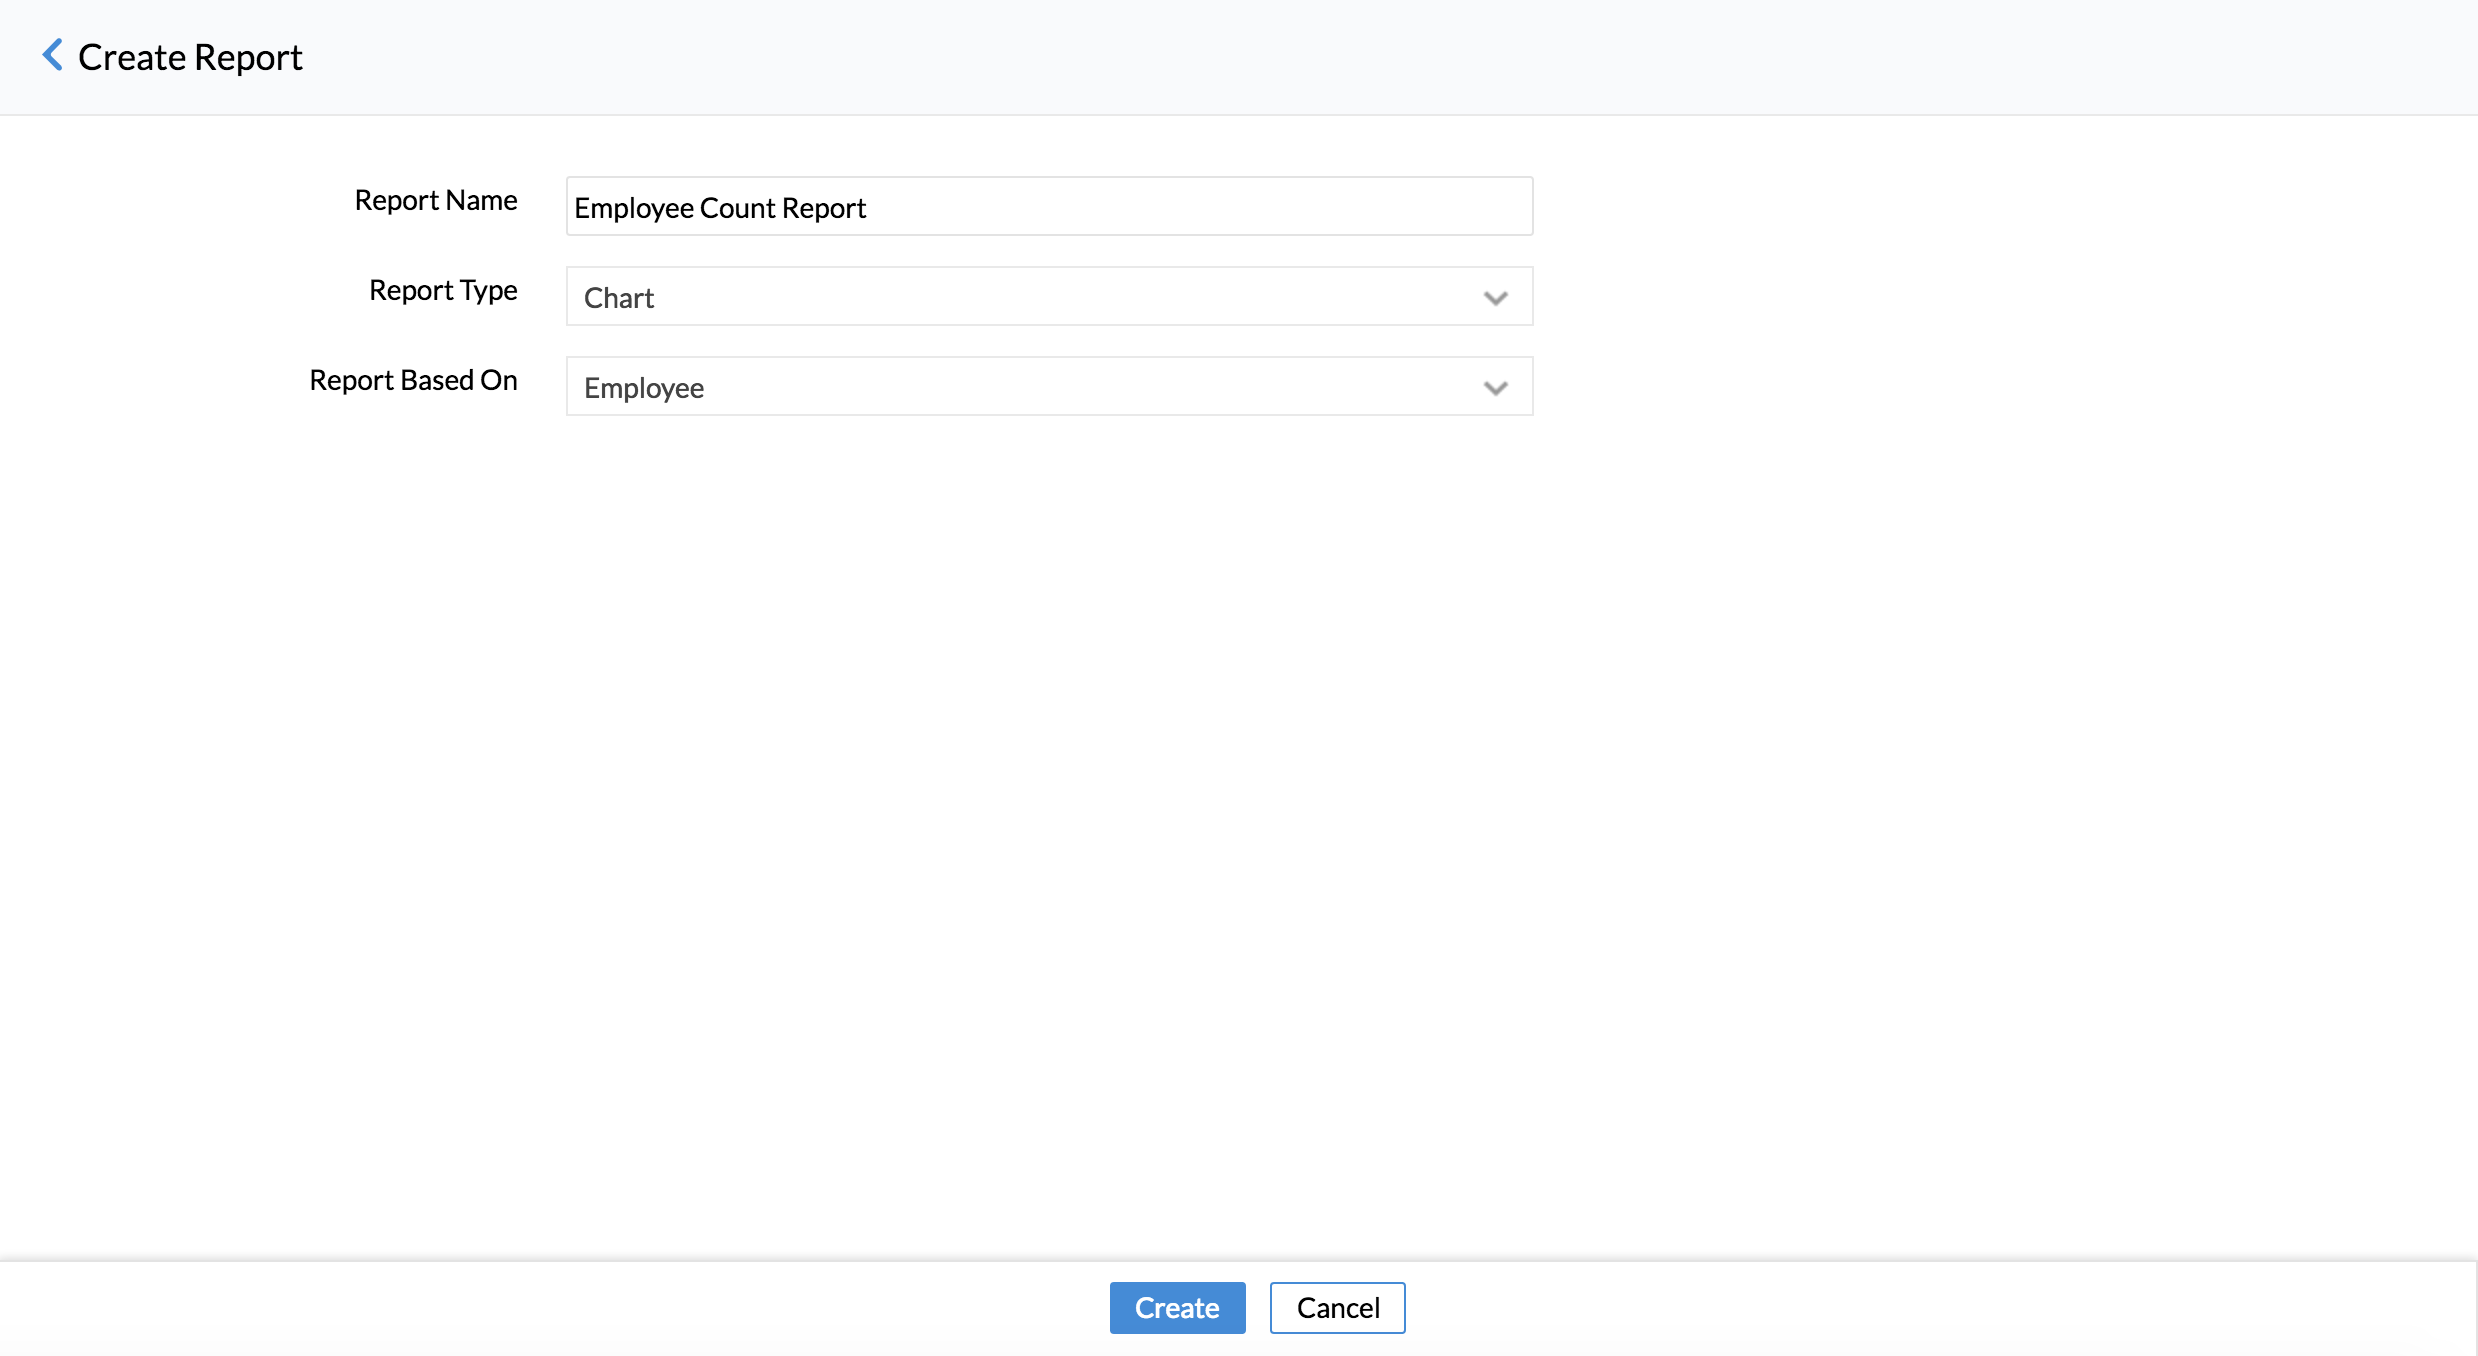
- Click Create
- From the list of fields displayed on the left side, drag the Department name field from the Department section and drop it under the column 'X-Axis'
- In the Department Name dropdown, select 'Actual'
- From the list of fields displayed on the left side, drag the Employee Id from the Employee section and drop it under the column 'Y axis'
- In the Employee ID dropdown, select Count
- Under the Location name column, drag the Location Name field from the Location section that is displayed in the list of fields on the left side and drop it under the column 'Color'
- In the Location Name dropdown, select Actual
- Click 'Click Here to Generate Graph'
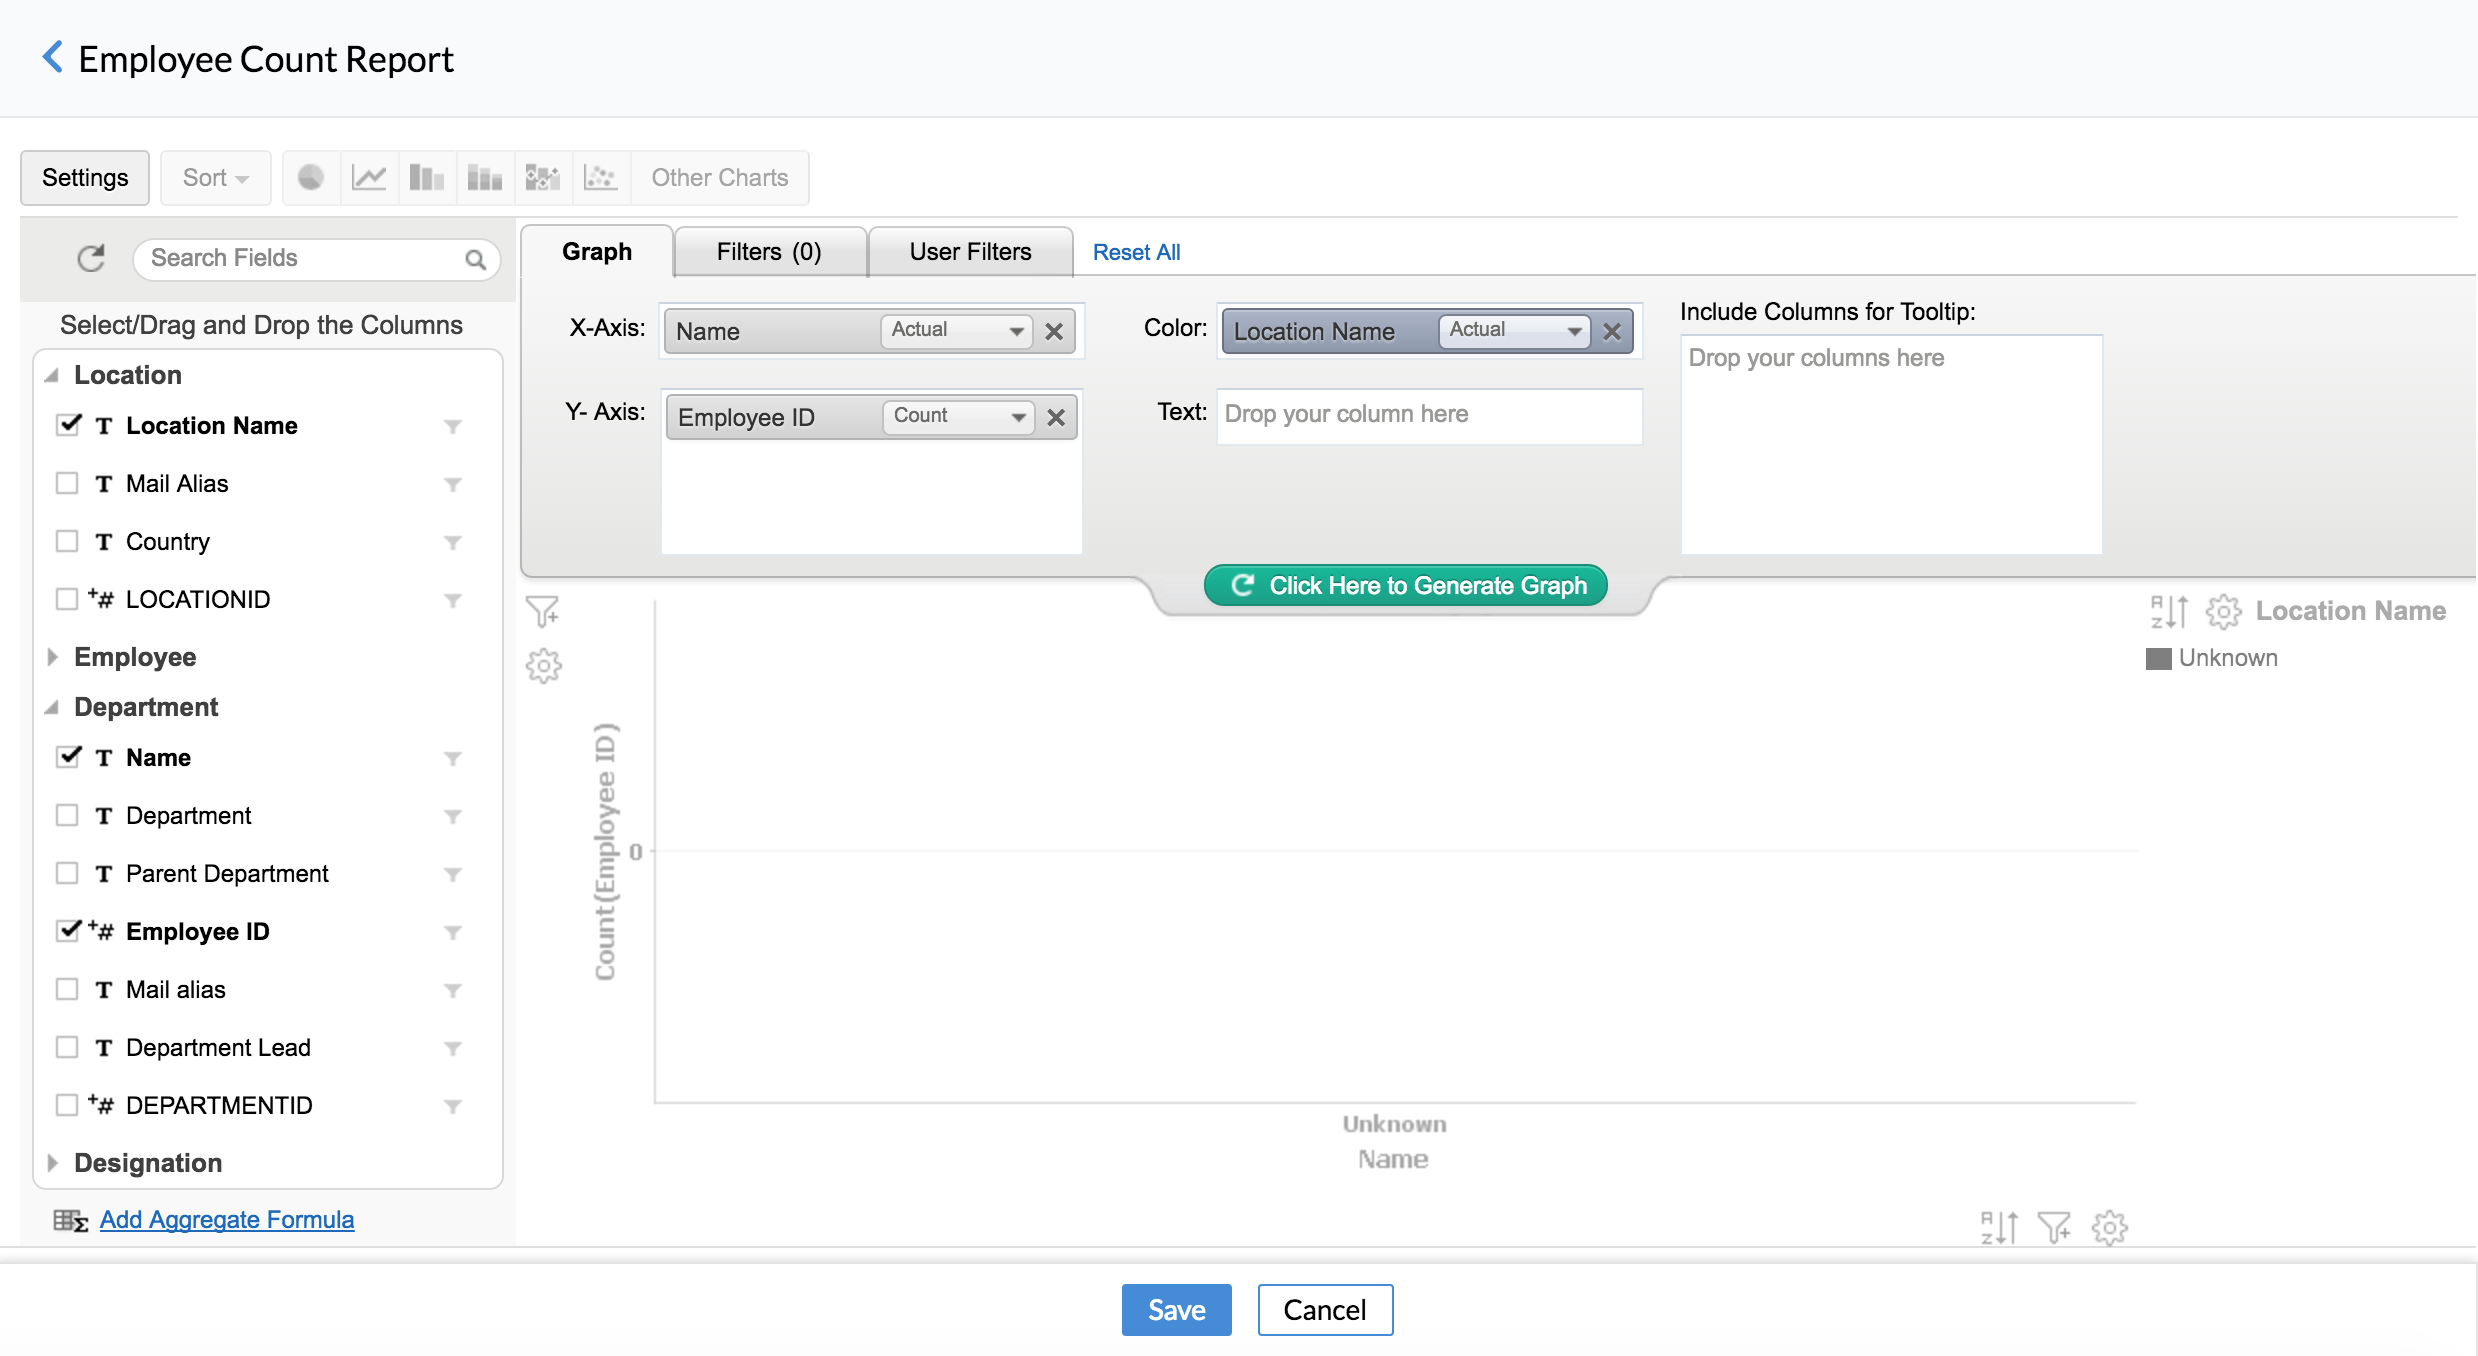
- Click Save
You will be able to see the employee count in each department across locations.
To create a report for viewing employee vs hours logged for individual jobs
- From your home page, go to Analytics > Create Report
- Give a name for the report. Eg - Hours of work for employee vs Jobs
- Select the Report type
Note: If you would like to get the exact count of the number of employees, it is good to use the Pivot option. If you select Chart, the report will only give a range for employees and not the exact count.
Here, we will be choosing the Pivot option.
- Select Pivot from the Report Type.
- Under Report Based On, select Time Logs.
- Click Create.
On the left-hand side, you will be able to see the list of field names that you can use for your columns, rows and for data.
- Select the Employee Name field from the Employee section.
- Drag and drop this to the Rows section.
- From the Jobs section, select Job Name and drag and drop it in the Rows section.
- From the Time Log section, drag the Hours field and drop it in the Data section.
- Click Click here to generate Pivot.
- Click Save.
To create a report to view time logs for a particular month for employees
Follow the steps given below to generate this report.
- From your home page, go to Analytics > Create Report
- Give a name for the report - Eg: Monthly time log report for Employees
- Under Report Type, select Pivot
- Under Report Based on, select Time Logs
- Click Create
On the left-hand side, you will see that there are sections under which field names are grouped together.
- Drag the Date field from the Time logs section and drop it in the Columns section
- After the drag and drop, you will be able to see that there is a drop-down for the date field
- Select the Full date option here
- Drag and drop the Job Name field, from the Job section in the Rows section
- Drag the Employee name field from the Employee section and drop it in the Rows section
- Drag the Hours field from the Time Logs section and drop it in the Data section of the Pivot
- Under the Filter, drag and drop the Job Name field from the Jobs section and select 'Actual' from the drop-down
- Check the Jobs for which you would need the report
- Drag and drop the Date field from the Time Logs section and select 'Actual' in the drop-down
- Check the Month for which the report needs to be generated
- Click on 'Click to Generate Pivot'
- Click Save
To create a report to view estimated hours against logged hours for employees
Follow the steps given below to get this report generated.
- From your home page, go to Analytics > Create Report
- Give a name for the report - Eg - Estimated hours vs logged hours for employees
- Under Report Type, select Chart
- Under Report based on, select Time Logs
- Click Create
On the left-hand side, you will see that there are sections under which field names are grouped together.
- From the Jobs section, drag the Job Name filed and drop it in the X-axis section
- Drag the Hours field from the Assignees section and drop it in the Y-axis section
- Drag the Hours field from the Time Log section of the left-hand side and drop it in the Y-axis section
In this report, we will be using a filter and a user filter. The filter tab will be used to display the fields that should be filtered. In this case, you can choose to filter out and display only some of the jobs. User Filter helps you choose the field that will be visible as a filter in the view mode. Here, we can select the Employee Name field as user filter so that the report can be seen only for specific employees.
- Select the Job Name from the Jobs section and drop it under the Filter tab
- Under Values, check the Job names that need to be displayed. You can also search for a job name using the Search tab
- Select the Employee Name from the Employee section on the left-hand side and drop it under the User Filter tab
If you hover your mouse over the field name, you will see that there is an edit option (pencil icon). You can click on this to select options like Single select (to filter a single value from the drop-down), Multi-select (to select more than one value from the drop-down). You can also delete the user filter by using the delete icon. This icon can be seen if you hover the mouse over the user filter name.
Once you have selected the field names for filter and user filter, click on 'Click to generate graph'
You will be able to see the filter at the left side top corner using which you can select the user for whom you need to see the report.
To generate a report to view the billable status of jobs for specific employees
Follow the steps given below to generate this report.
- From your home page, go to Analytics > Create Report
- Give a name for the report - Eg - Billable status of jobs for employees
- Under Report Type, select Chart
- Under Report based on, select Time Logs
- Click Create
On the left hand side, you will see that there are section under which field names are grouped together.
- Select the Job name from the Jobs field and drop it in the X axis section
- Select the employee name from the Employee field and drop it in the Y axis section. Here, you will be able to see a drop down embedded in the field name. Select 'Count' from the drop down
- From the Time Logs section, select Billable Status field and drop it in the color section
- Drag the Employee Name from the Employee section and drop it under User Filter
- Click on 'Click here to generate graph'
- Click Save
Under Filter, you can choose the employee name whose report you want to see.
To generate a report to see employees' weekly time log details for a particular client
Follow the steps given below to generate this report.
- From your home page, go to Analytics > Create Report
- Give a name for the report Eg - Weekly Time log details
- Under Report Type, select Pivot
- Under Report Based on, select Time Logs
- Click Create
- Drag the Employee Name field from the Employee section on the left-hand side and drop it under Column
- Drag the Job name field from the Jobs section on the left-hand side and drop it under Rows
- Drag the Hours field from the Time Logs section on the left-hand side and drop it under Data
- Select 'Distinct' from the drop-down in order to get the hours rounded off
- Drag the Client Name field from the Clients section on the left-hand side, drop it under Filter and select the option 'Actual' from the drop-down
The list of all clients will get displayed.
- Select the client name as required
- Drag the Date field from the Time Logs section on the left-hand side, drop it under Filter and select the option 'Relative' from the drop-down
- In the next row, select Week from the list Common, Year, Quarter, etc
- Check 'This Week' among the options like This Week, last week, Next Week, etc
Selecting This week is essential when you would like to generate a report for the current week.
- Click on 'Click to Generate Pivot'
- Click Save
Now, you will be able to see the report of Time logs that are done for the current week for employees.
To create a report to see the monthly count of new joinees in each department
Using Analytics, you can create a report to give you the count of new joinees of each department month wise.
Follow the steps given below to generate this report.
- From your home page, go to Analytics > Create Report
- Give a name for the report. Eg - Monthly new joinee report
- Under Report Type, select Pivot'
- Under Report based on, select Employee and click Create.
- From the Designation section on the left-hand side, drag the designation name and drop it under Rows.
- From the Department section on the left-hand side, drag the department name and drop it under Rows.
- From the Employee section on the left-hand side, drag the Employee Name and drop it under Rows.
Now the report will reflect the Employee names and give details like their designation name and department name. In order to find out the total number of new joinees in each department, the date of joining field should be used.
- Drag the Date of Joining field from the Employee section on the left-hand side and drop it under User Filters
- Click Generate Report and click Save.
The report generated will have a user filter in which you can give a date range (in this case you can select the desired month as the range). You will be able to see the new joinee count for each department listed.
To create a report to view the monthly leave trend of a specific employee
- Go to Reports > Analytics > Create Report.
- Enter the Report Name, Monthly leave trend in this case.
- Select Chart under Chart Type.
- Select Leave under Report Based On.
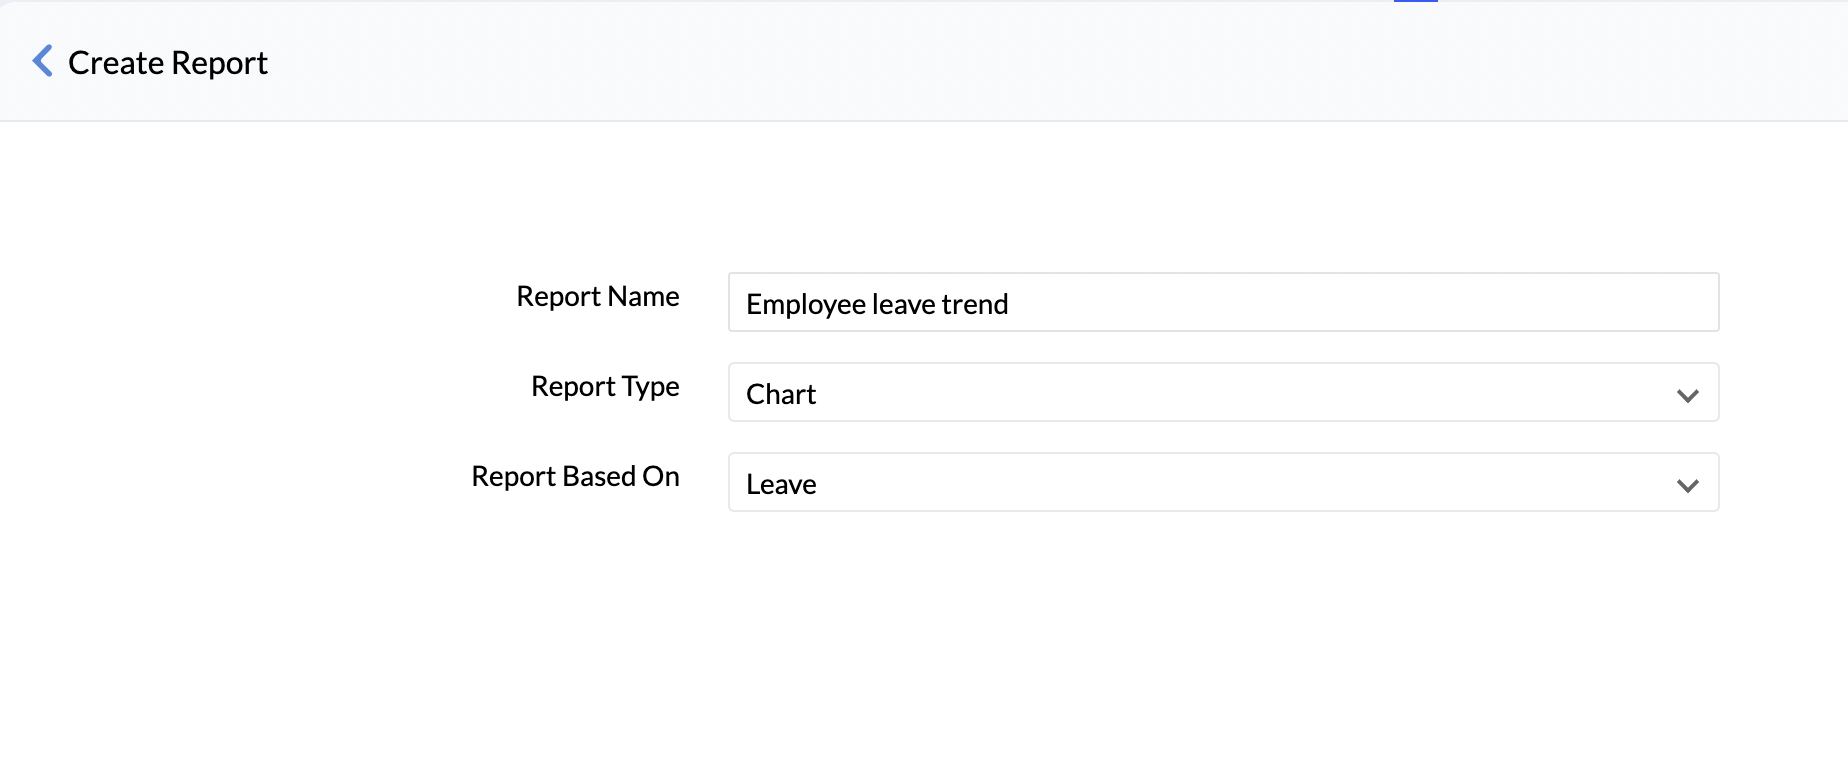
- Click Create.
- For the X axis, drag and drop From field under Leave, with display option as Month &Year.
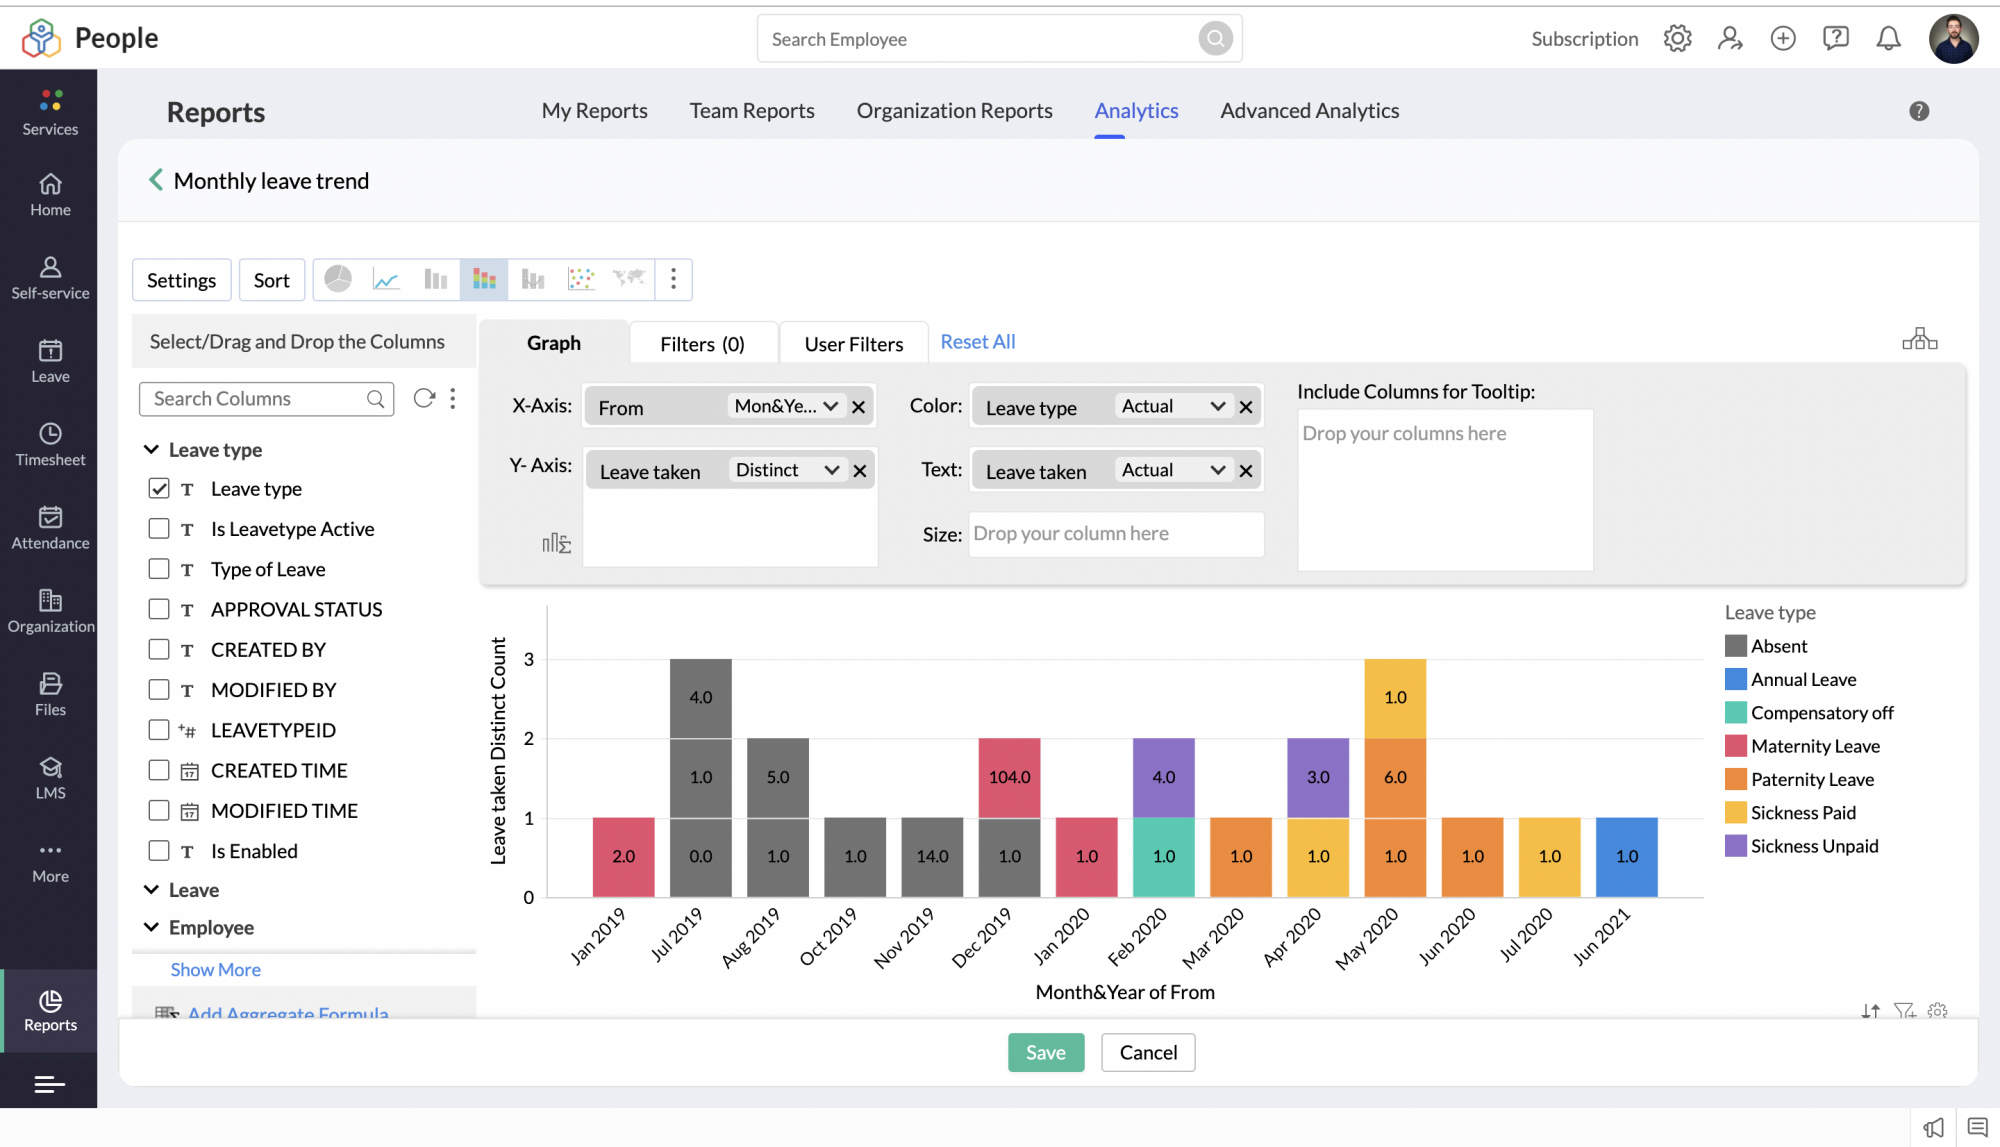
- For the Y axis, drag and drop Leave taken under Leave, with display option as Distinct count.
- Under Colour, drag and drop Leave Type under Leave type, with display option as Actual.
- Under Text, drag and drop Leave taken under Leave, with display option as Measure, Dimension or Range.
- Click the Stacked bar icon on the top left.
- Add Employee ID under User Filter option.
- Click Save.
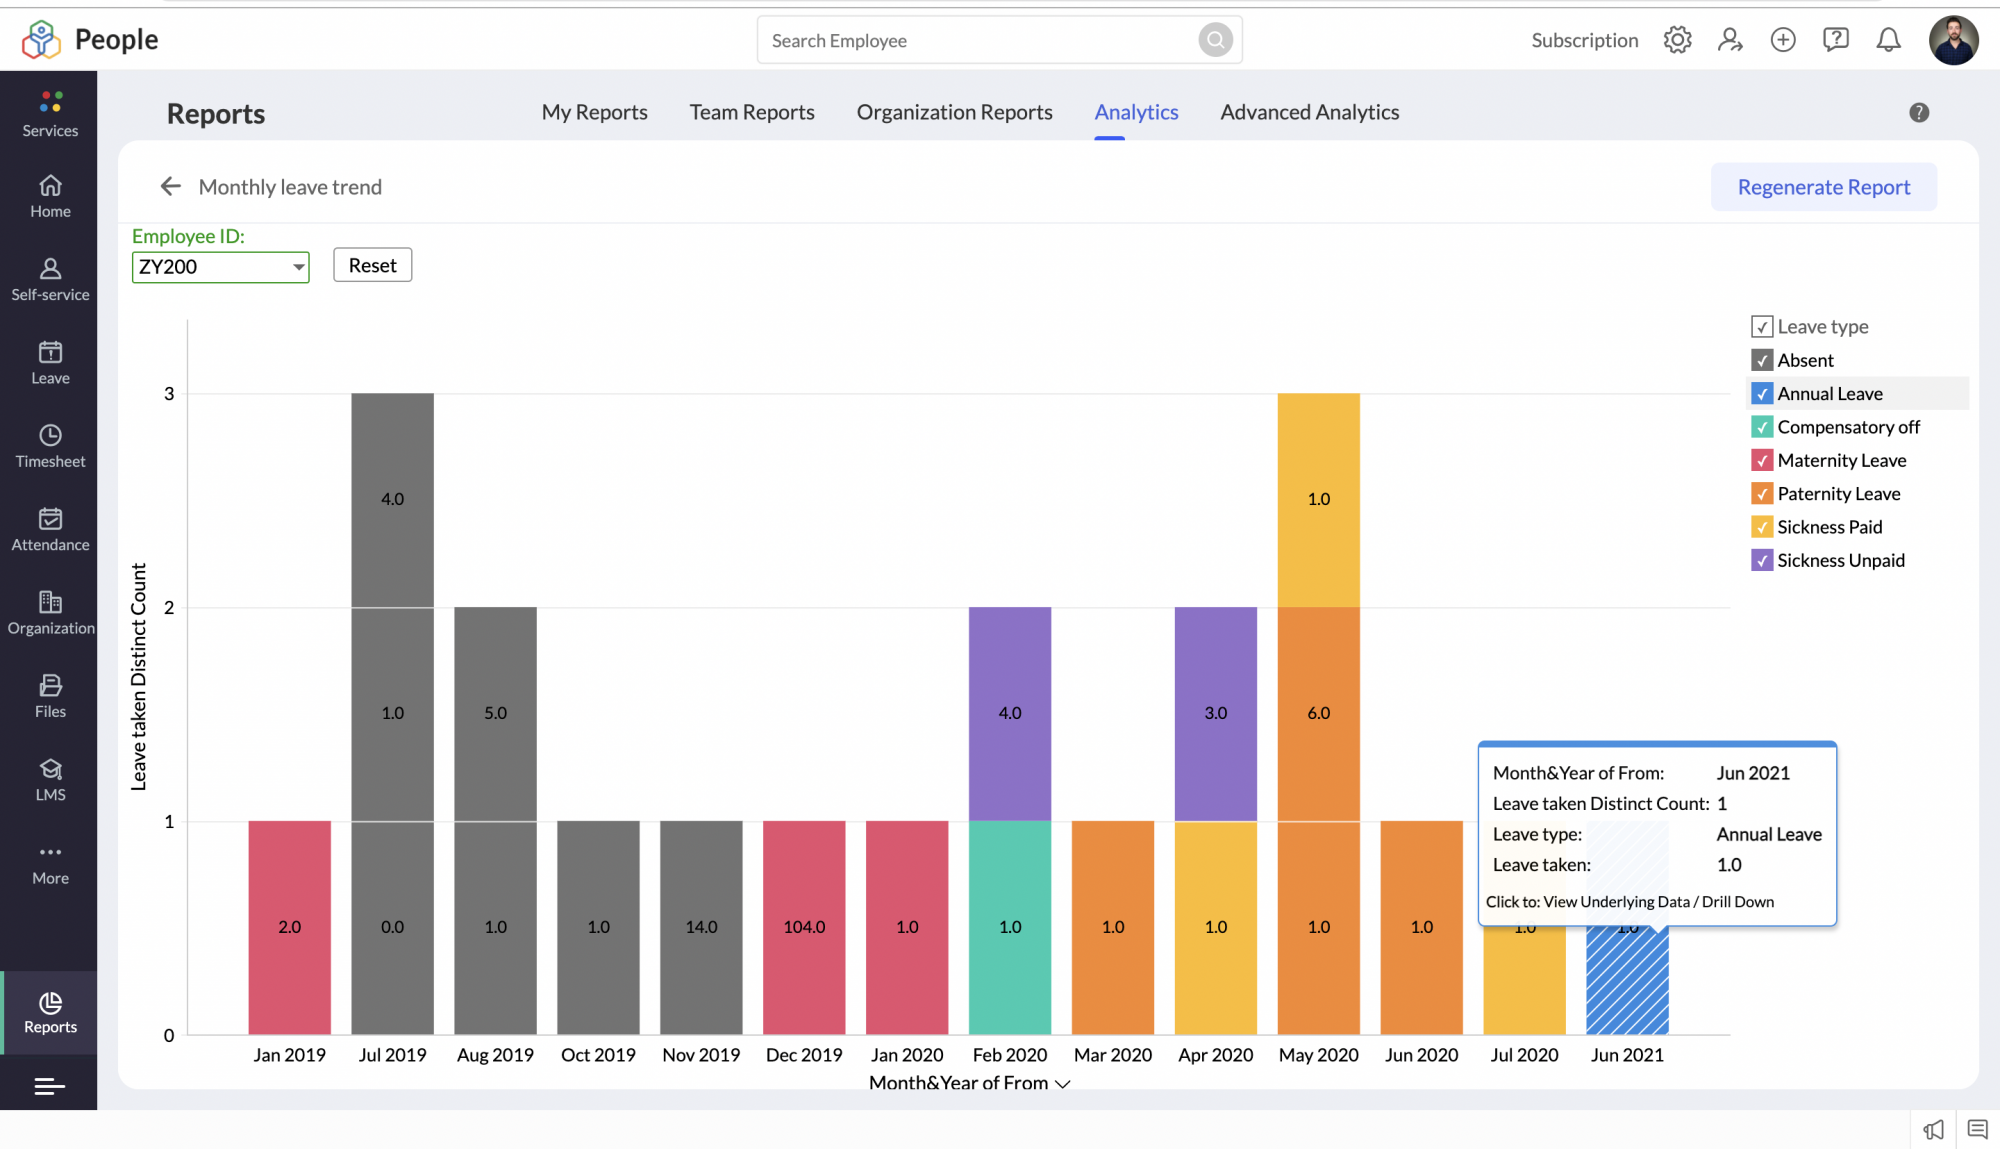
Select the specific employee's ID from the drop-down on the top left corner to view their monthly leave trend.