Employee Information Reports
Here is a detailed look of all the reports that are part of Employee Information in Zoho People.
To access the various employee information reports, navigate to Reports on the bottom left corner of your screen and go to the Organization Reports tab.
- Dashboard
- Headcount
- Employee addition trend
- Employee attrition trend
- Diversity
- Distribution
- Experience wise exit
- EEO-1 Report (U.S region)
Dashboard
The Dashboard aims to provide several employee Information metrics and graphs in one quick glance. Employee stats such as headcount, addition (new hires), attrition and their respective YOY (year-on-year) percentage is depicted on the top band.
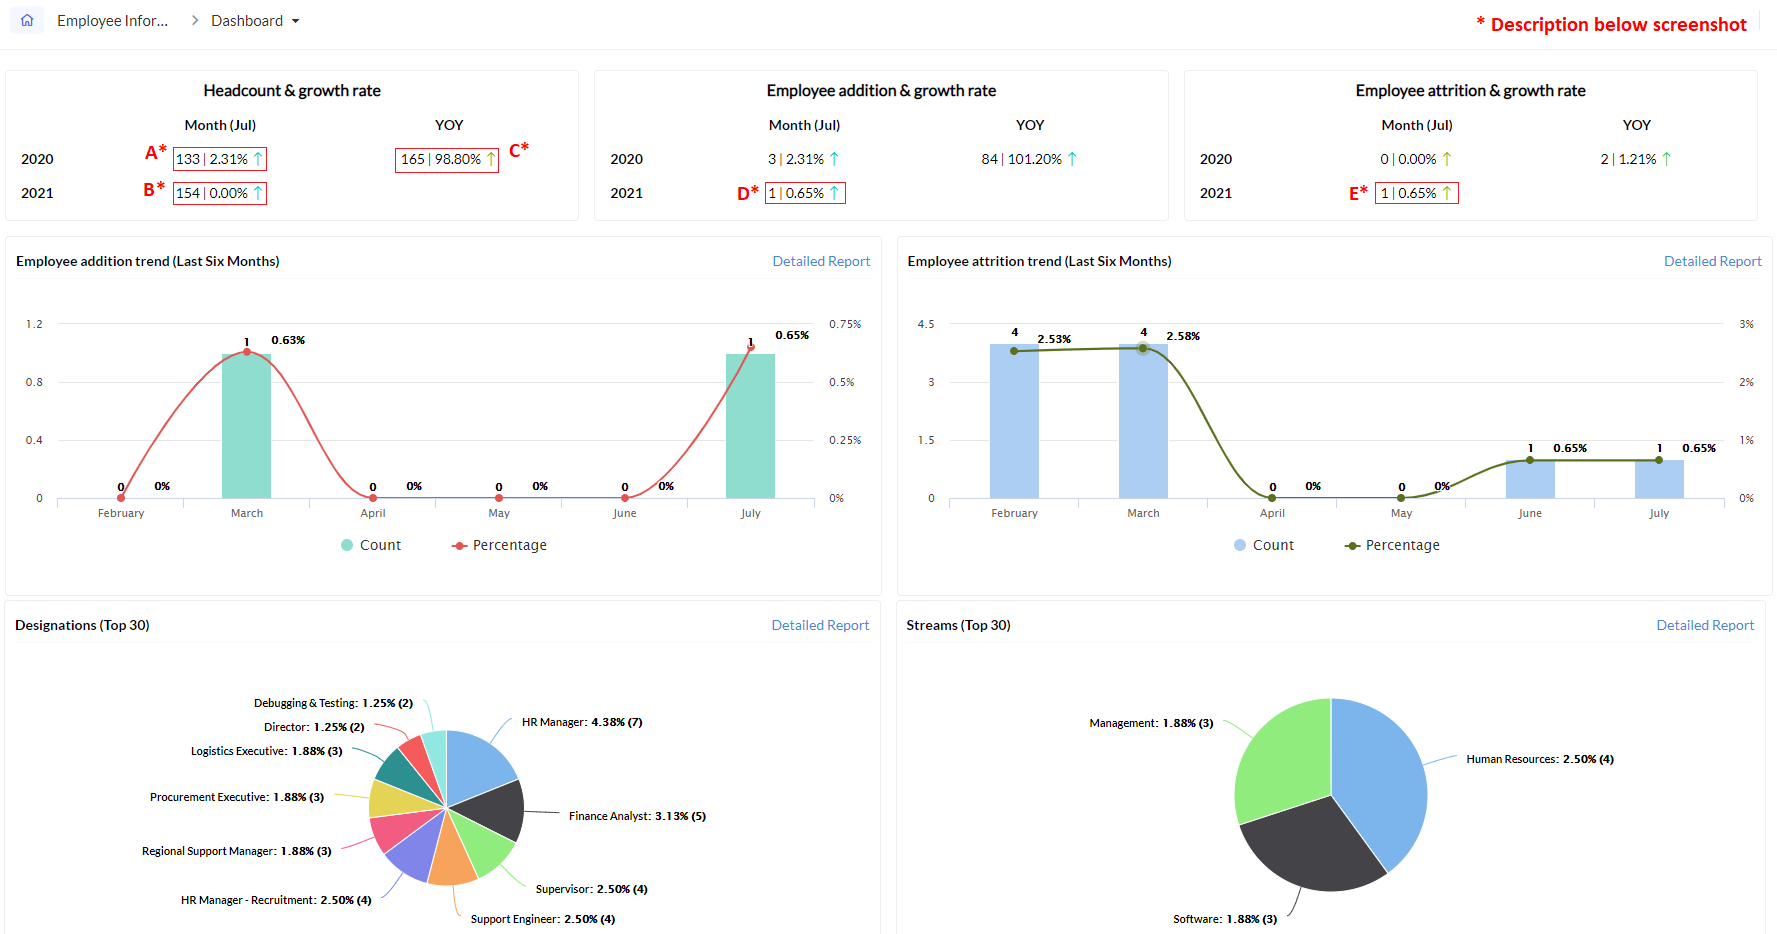
A* - Denotes a headcount of 133 employees in July 2020 in comparison to the previous month (June 2020) | 2.31% headcount growth rate in July 2020 in comparison to June 2020.
B* - Denotes a headcount of 154 employees in July 2020 | 0.00% headcount growth rate in July 2021 in comparison to June 2021.
C* - Denotes a headcount of 165 employees in 2020 | 98.80% YOY growth rate compared to 2019.
D* - Denotes that 1 new employee was added in July 2021 | 0.65% employee addition growth rate in July 2021 in comparison to June 2021.
E* - Denotes that 1 employee has left in July 2021 (attrition) | 0.65% employee attrition growth rate in July 2021 in comparison to June 2021.
Because 1 employee wad added and 1 employee has left in July 2021 (D* and E*) there is no headcount growth observed in B* (0.00%).
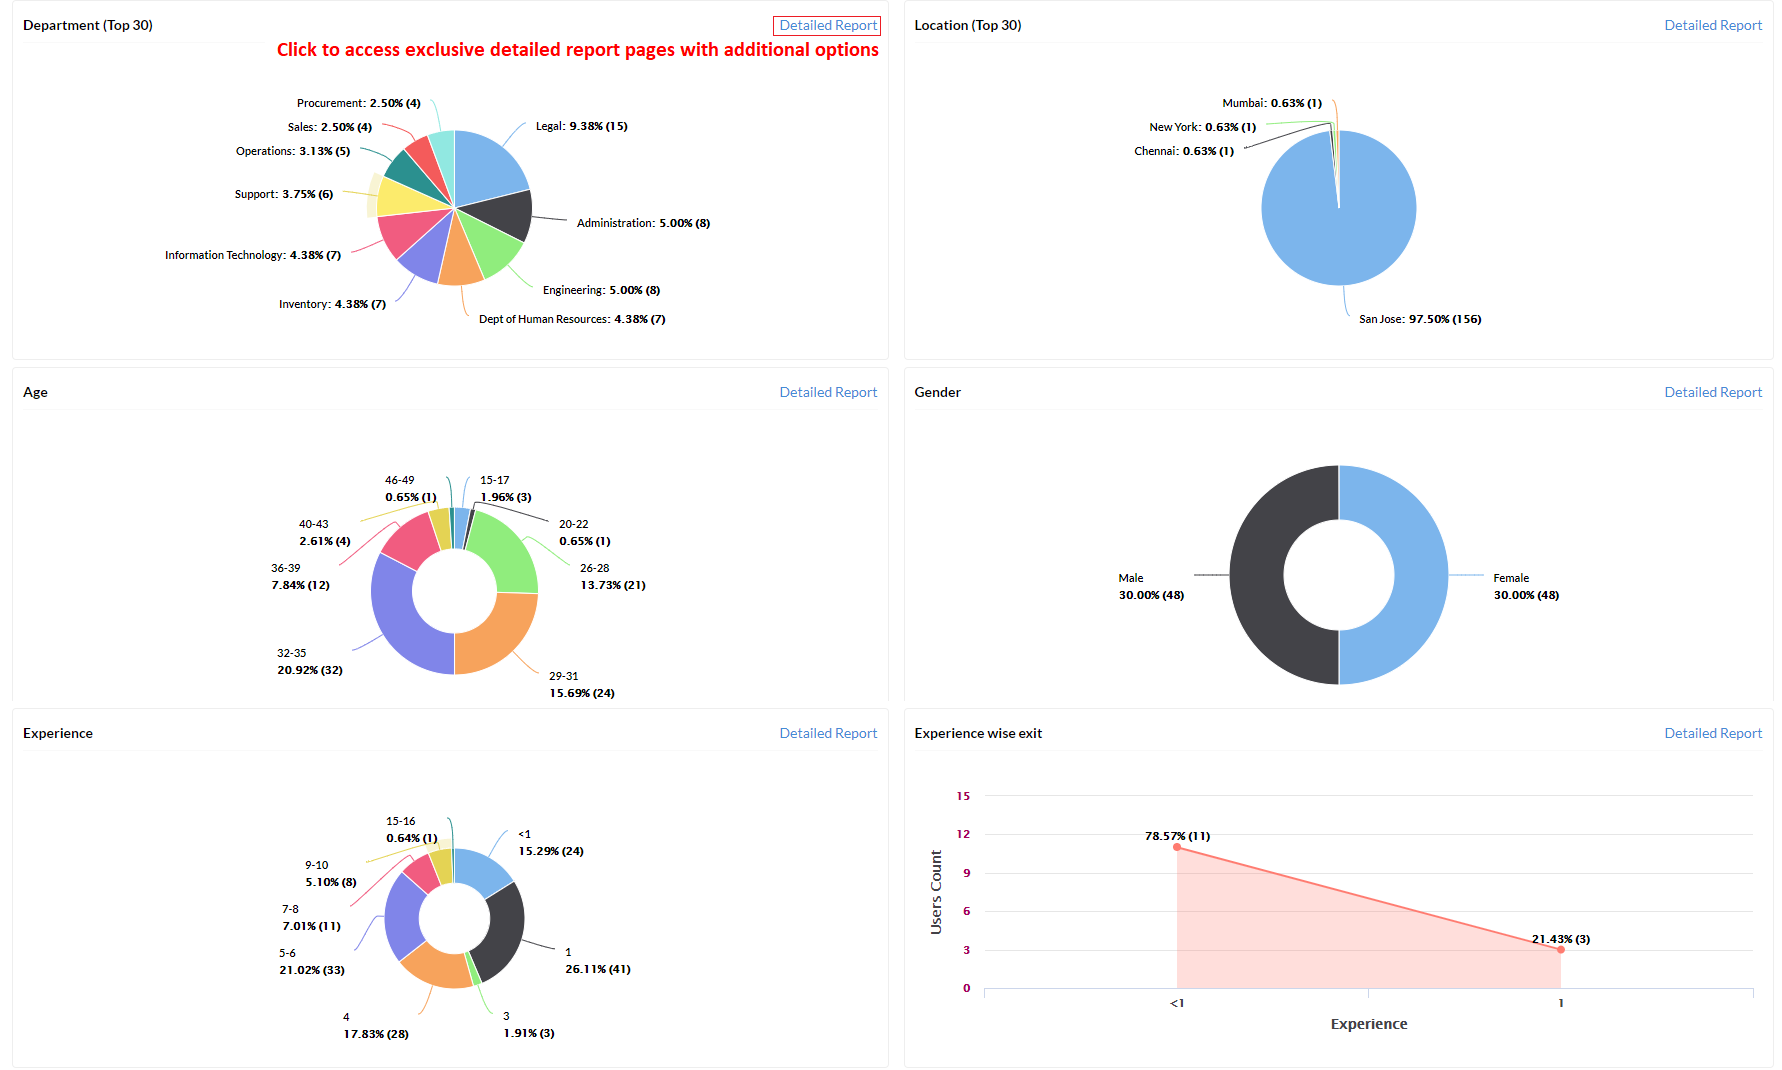
The Dashboard also displays a smaller version of several employee information reports for a quick overview.
Click on Detailed Report anytime to access the respective report pages exclusively with more options (covered in detail here) The reports shown here include:
- Designations (Top 30)
- Streams (Top 30)
- Department (Top 30)
- Location (Top 30)
- Age
- Gender
- Experience
- Experience wise exit
Headcount
The headcount report gives you an overview of the company's growth in terms of manpower over the years.
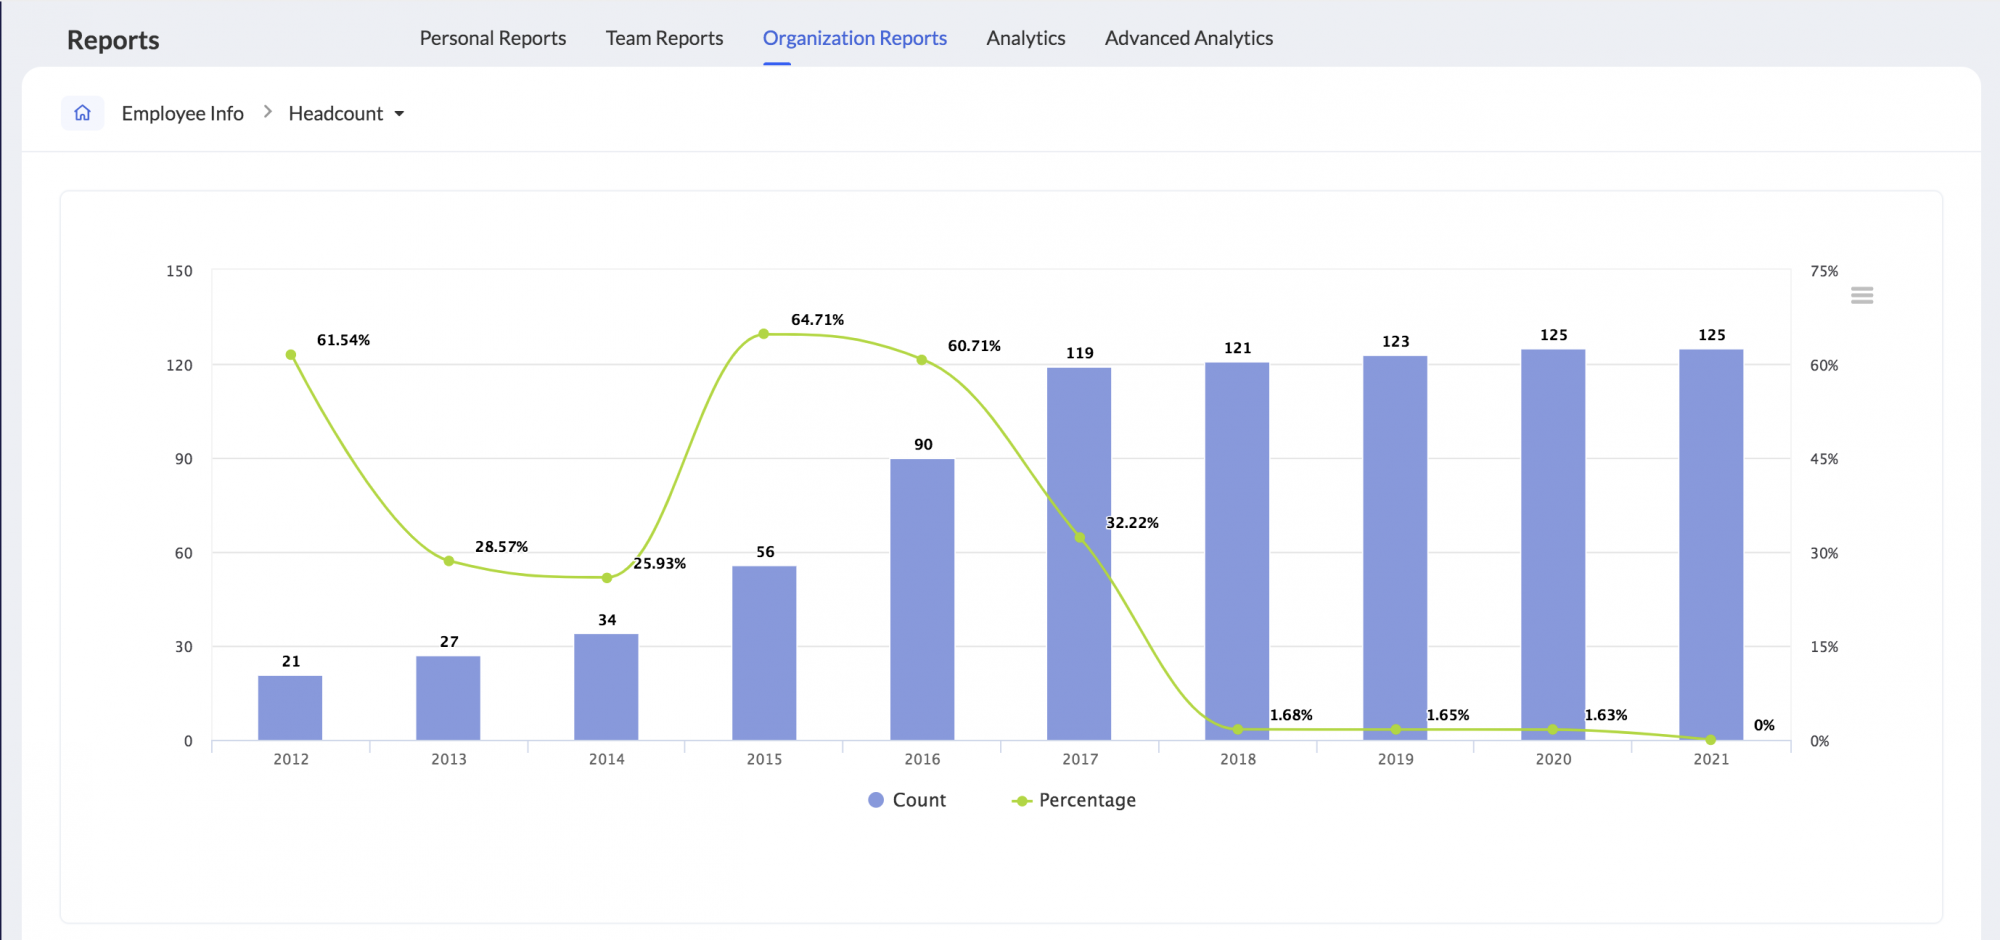
The increase or decrease in headcount can be indicators to take a closer look at hiring and retention strategies for the organization.
Employee addition trend
This report gives you a view of the hiring trends in the organization. The data are represented as count and percentages for easy understanding.
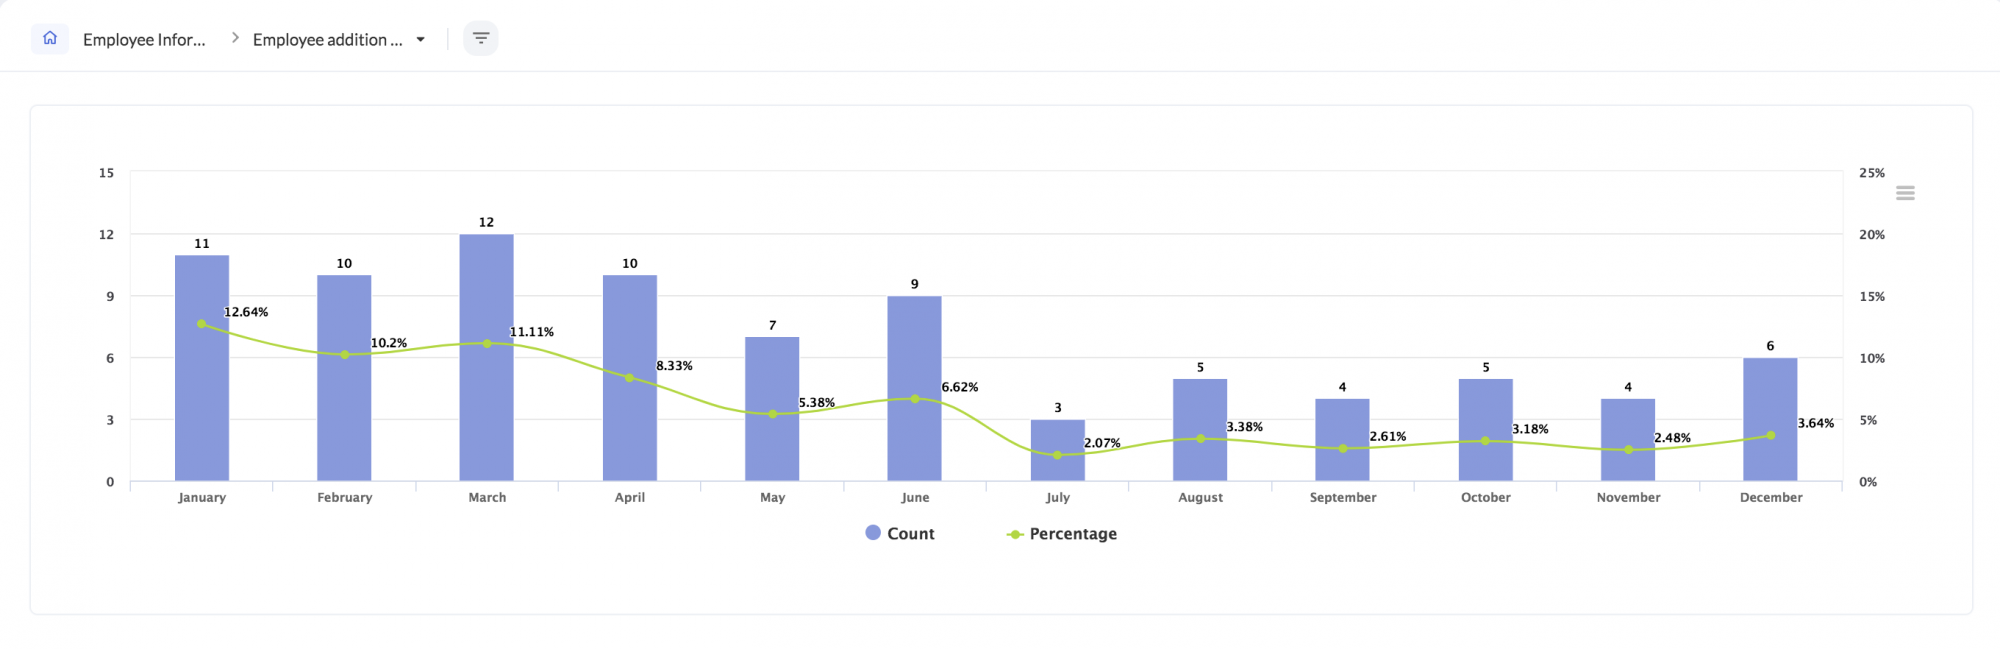
Use the drop-down on the top to change the period displayed. Under Year, Last year and Quarterly data can be filtered and viewed. Under Months, Last three months, Last six months and Last 12 months options can be used.
Employee attrition trend
The employee attrition trend report can warn you of alarming trends in attrition and make you revise your retention strategies.
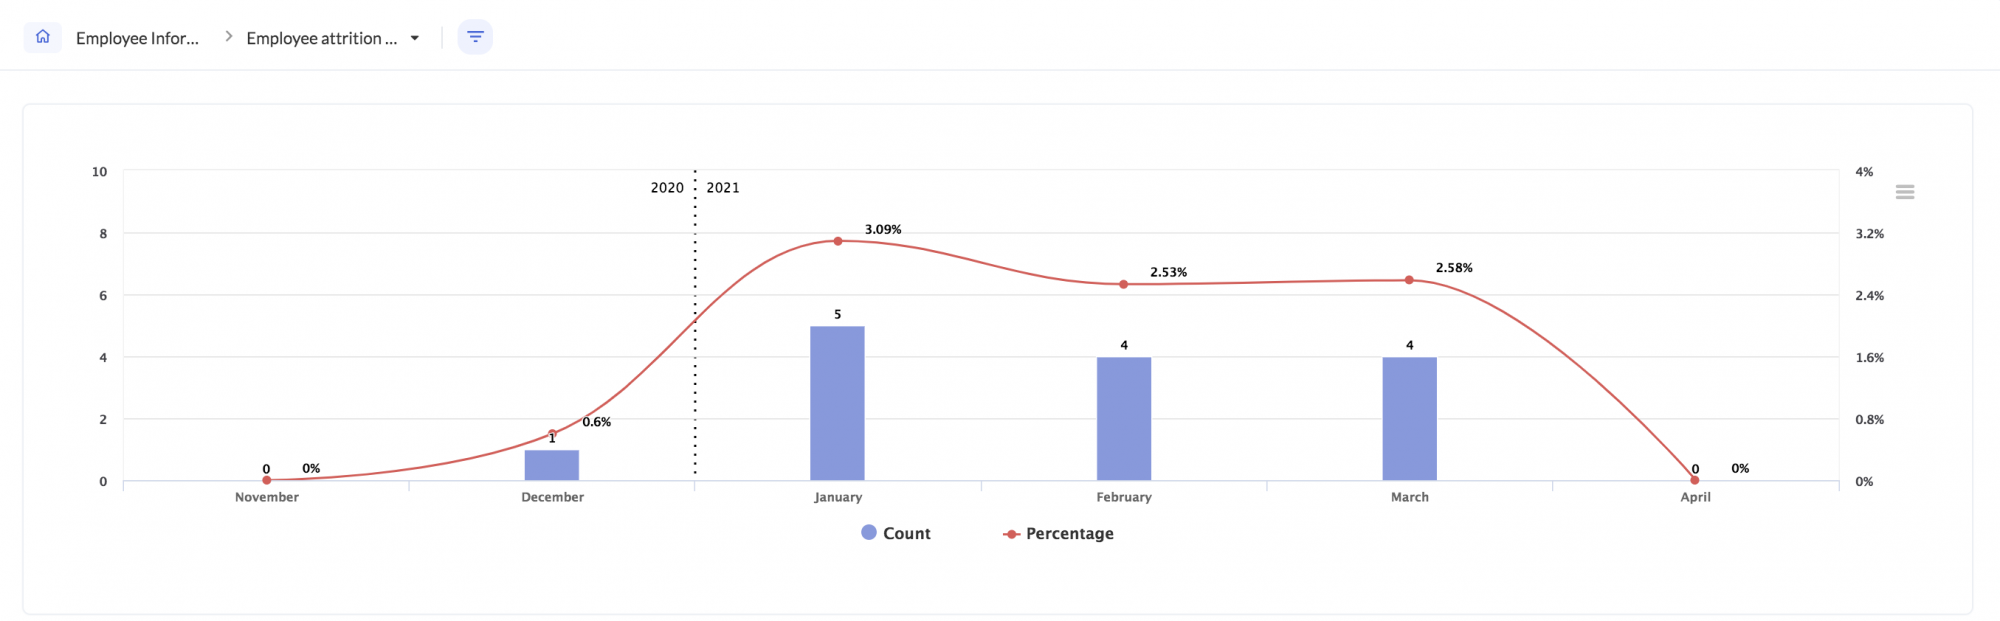
Use the drop-down on the top to change the period displayed. Under Year, Last year and Quarterly data can be filtered and viewed. Under Months, Last three months, Last six months and Last 12 months options can be used.
Diversity
This report displays the diversity and spread of employees in the organization based on the following types - Experience, Age and Gender. Use the drop-down to switch to other types.
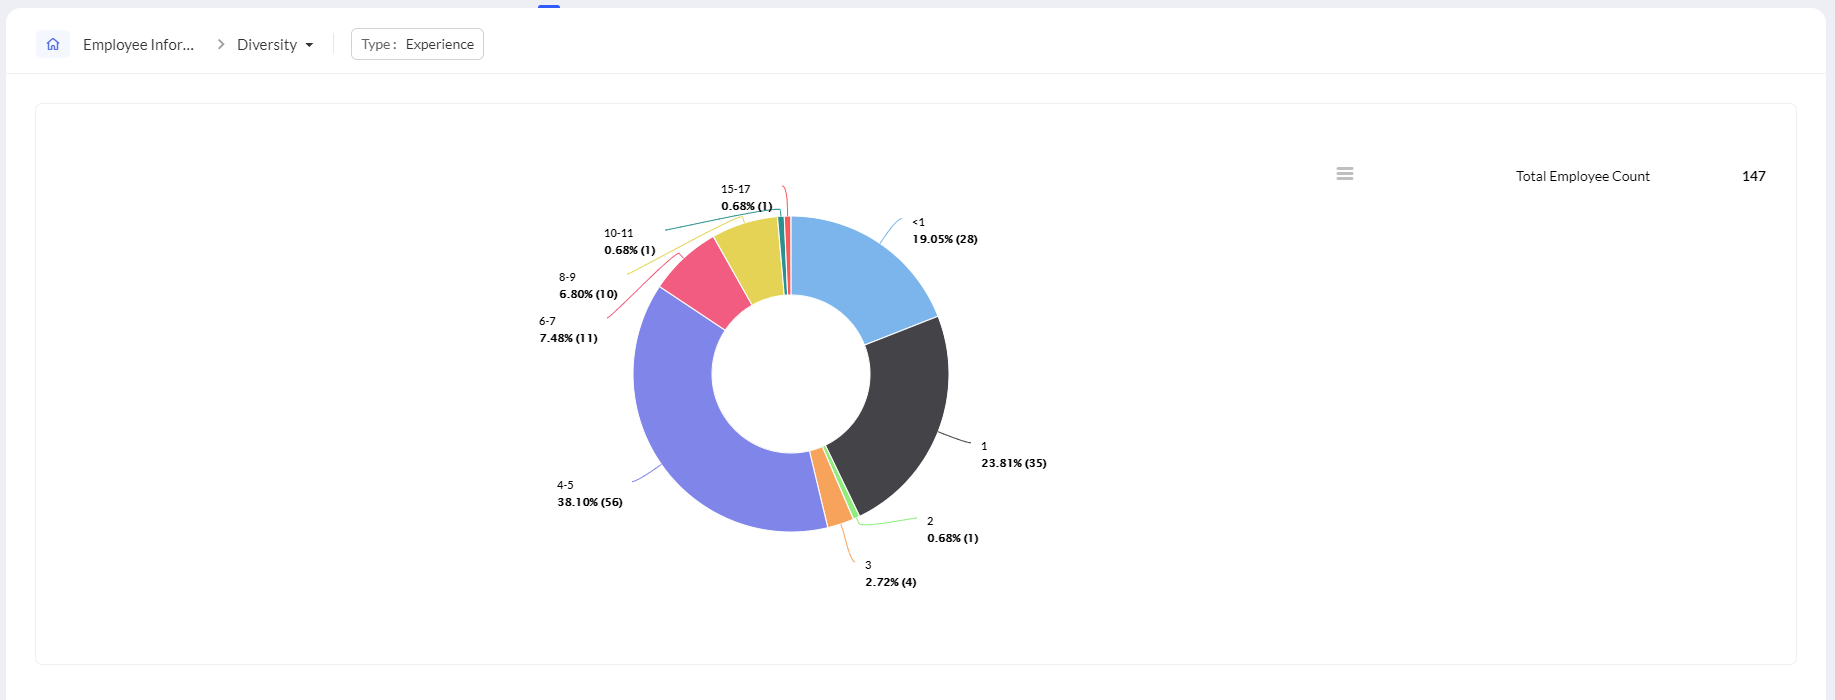
This report can be useful to provide insights on improving the strength of the organization based on diversity and inclusion.
Distribution
This report shows the break-up numbers of employee distribution by - Department, Designation, Streams and Location.
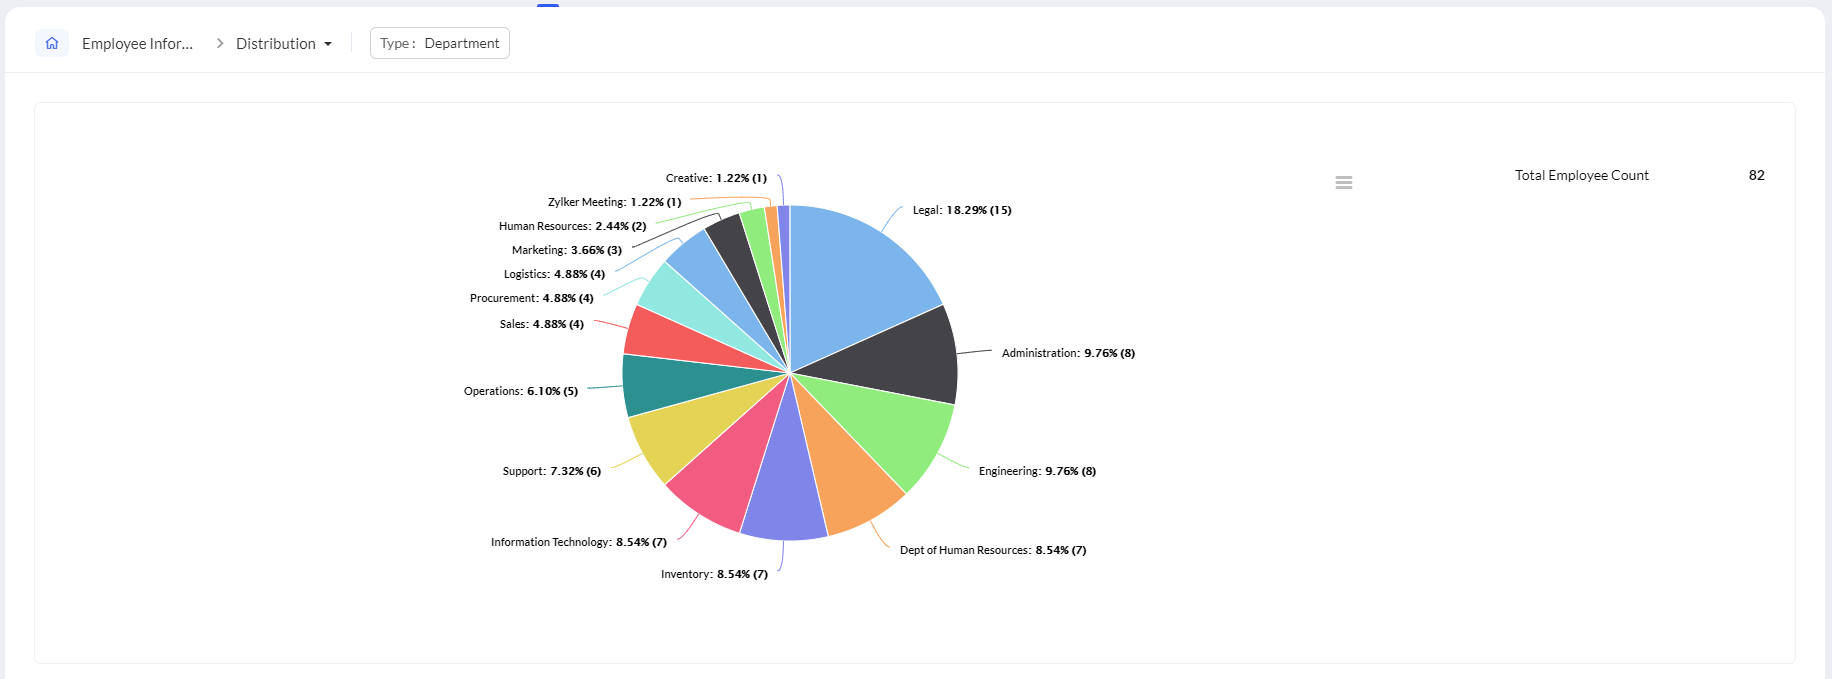
Use the drop-down to switch between distribution types. This report can be useful in analyzing the ratio of employees in the various departments, designations etc.
Experience wise exit
This report represents the number of employees who have exited the organization from an experience based point of view.
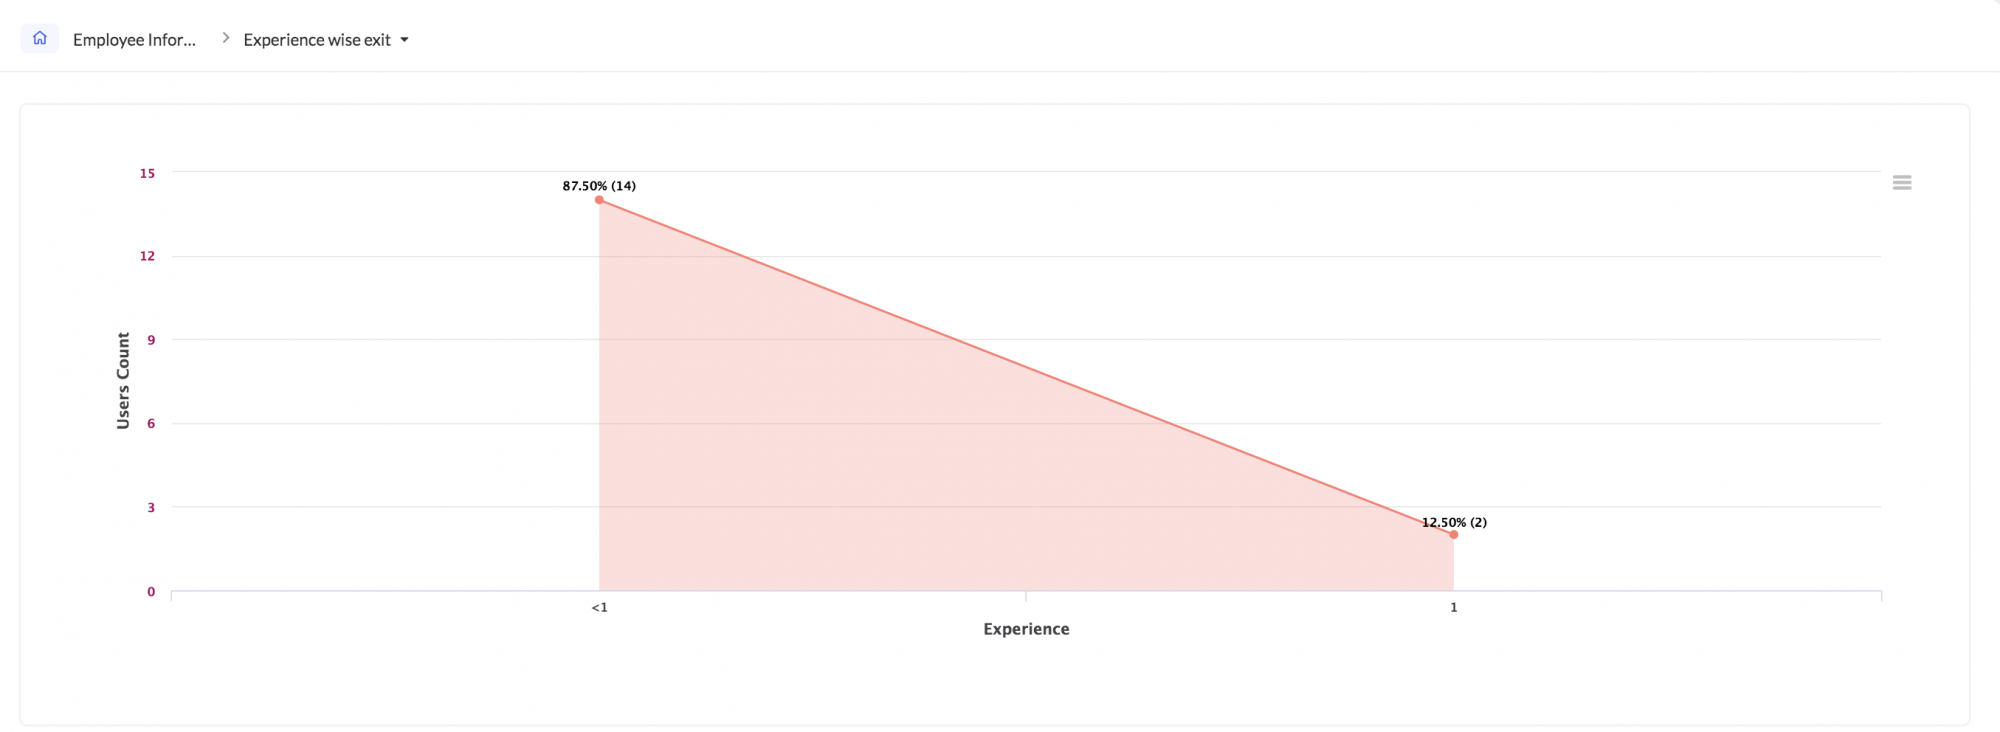
For instance, if it is noted that more employees with lesser than a year of experience are leaving the organization, this can throw light on possible training strategies or compensation packages that may need improvement in order to retain these employees better.
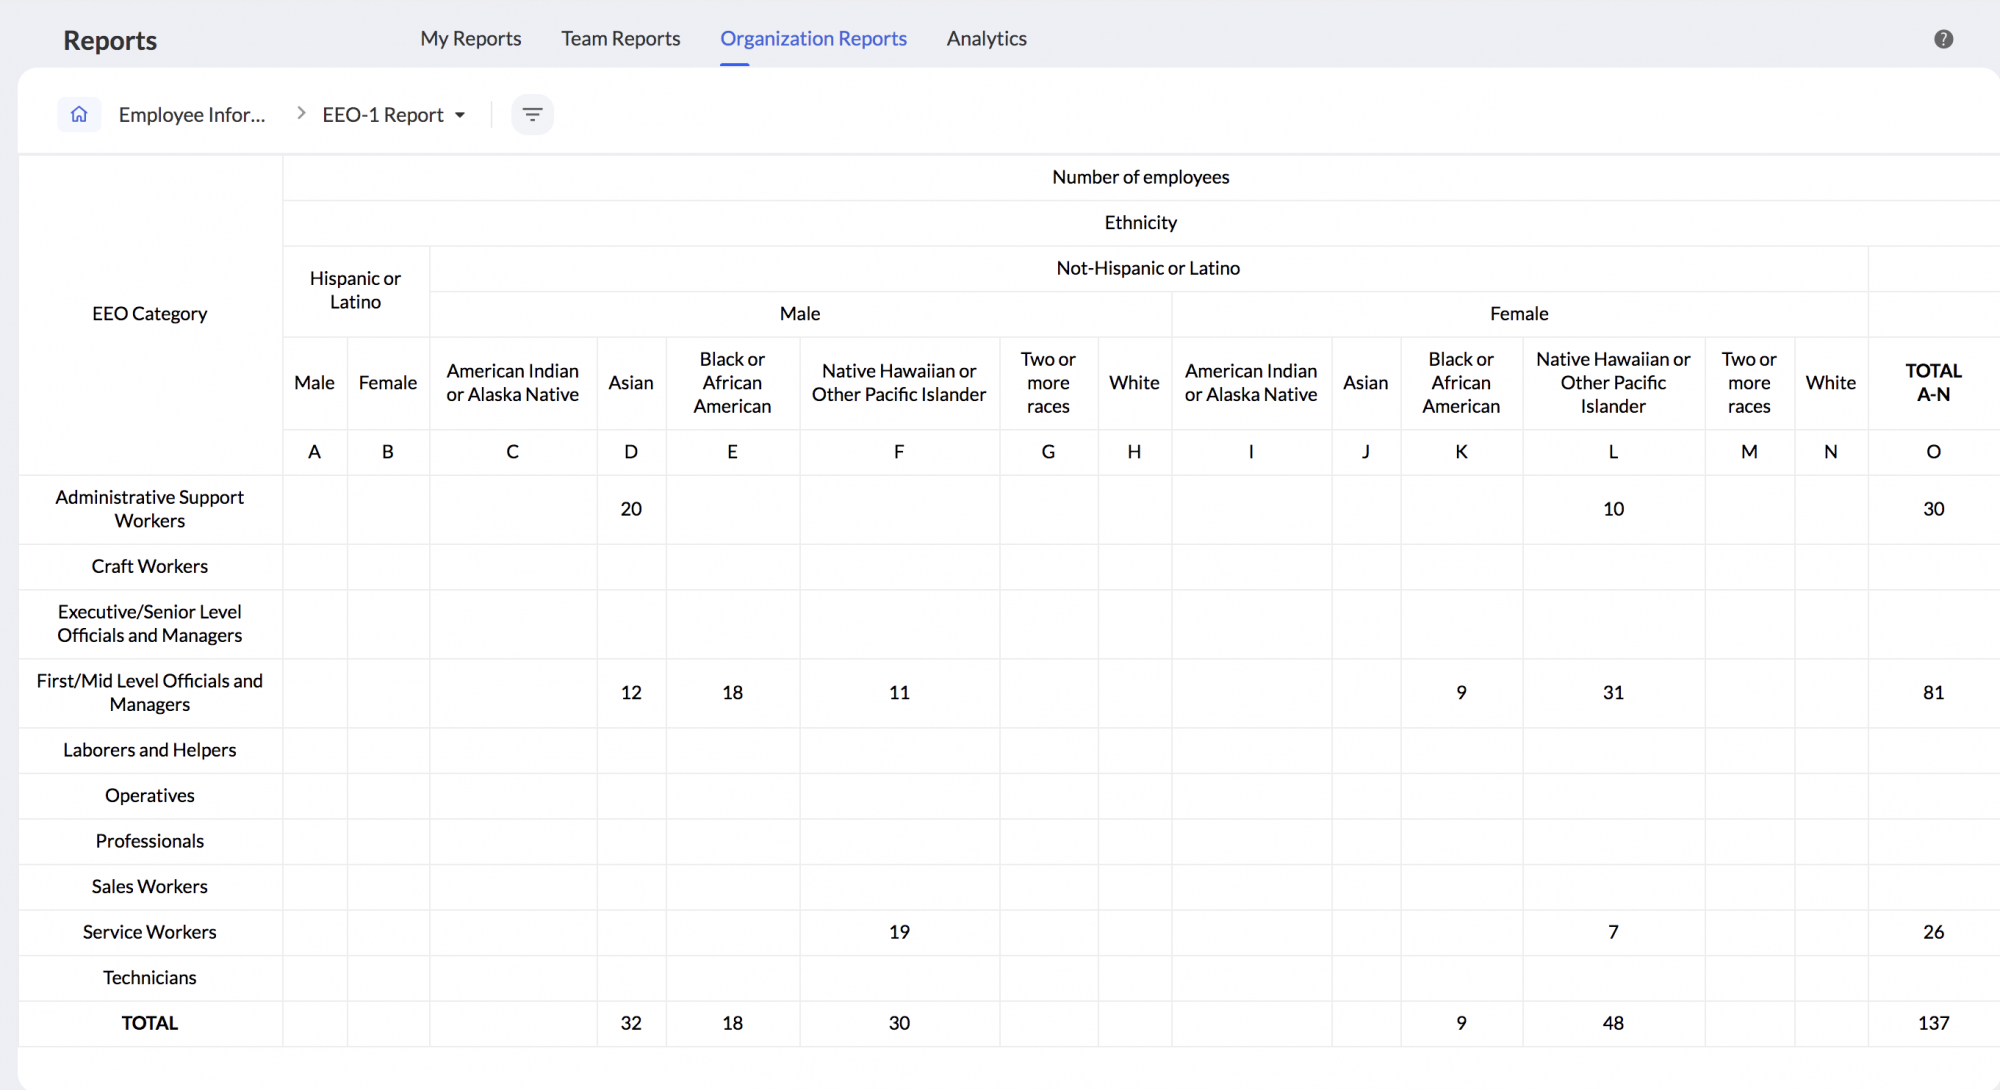
EEO-1 Report
The EEO-1 Report is a mandatory report to be submitted annually by organizations in the private sector with 100 or more employees, and federal contractors with 50 or more employees meeting certain criteria. This report submits demographic data about their employees based on ethnicity, race,sex and job categories. EEO stands for Equal Employment Opportunity and this report is mandatory only for the US region. (This report has been enabled only for US based Zoho People accounts and new sign-ups from US Region, for other regions with US employees please contact support@zohopeople.com if you wish to enable this report)