Everything you get on the free plan
Heatmaps
Click maps, scroll maps, and attention maps—three views in one. See what gets clicked, how far visitors scroll, and where attention drops.
Web & traffic analytics
Traffic sources, device splits, top pages, bounce rate, and trends over time—in readable dashboards, not walls of numbers.
Conversion goals
Define what conversion means for your site— button click, form submit, page visit, or any custom event — and track how many visitors actually hit it.
- Unlimited forms
Form analytics
Field-level drop-off, hesitation time, and re-fill rate for every form on your site. One field is almost always the culprit—this shows you which one.
- 1 funnel on free plan
Funnel analysis
Map your sign-up or checkout flow and see exactly which step bleeds visitors. View drop-off rates by device and traffic source.
- 5,000 recordings
Session recordings
Watch real visitor sessions. Every cursor movement, rage click, and dead-end navigation. Filter by device, country, duration, or goal completion.
What each tool actually tells you
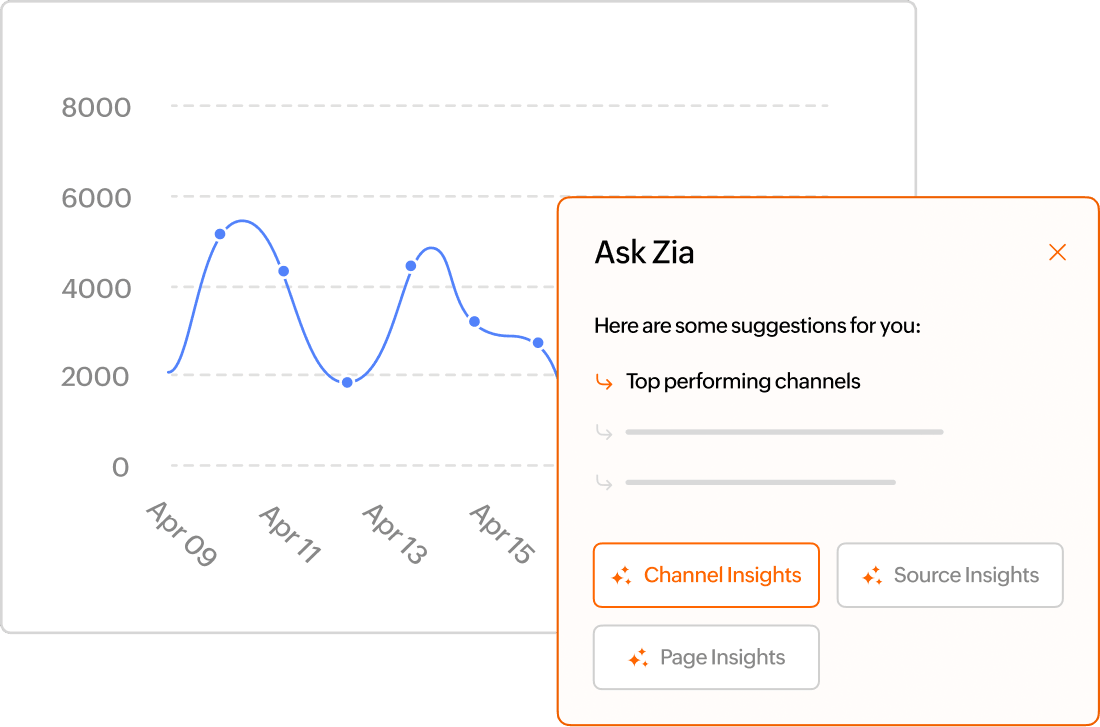
Web Analytics with Zia Insights
PageSense's built-in analytics shows you where traffic comes from, how visitors behave across devices, which pages hold attention, and who is on your site right now. Zia, Zoho's AI assistant, reads across all of this and gives you plain-language summaries — so you spend less time in dashboards and more time acting on what they tell you.
- Which traffic source actually drives conversions, not just visits
- How mobile and desktop visitors behave differently—not just how many there are
- Which pages hold attention and which ones bleed visitors before the CTA
- Visitors active on your site right now, region by region
Heatmaps—click, scroll, and attention
Overlays color on your page to show where visitors click, how far they scroll, and where attention concentrates. Three map types in one: click, scrollmap, and attention map. Most free tools give you just one.
- Which CTAs get clicked vs. ignored
- How far mobile visitors scroll before leaving
- Whether your above-fold content earns attention

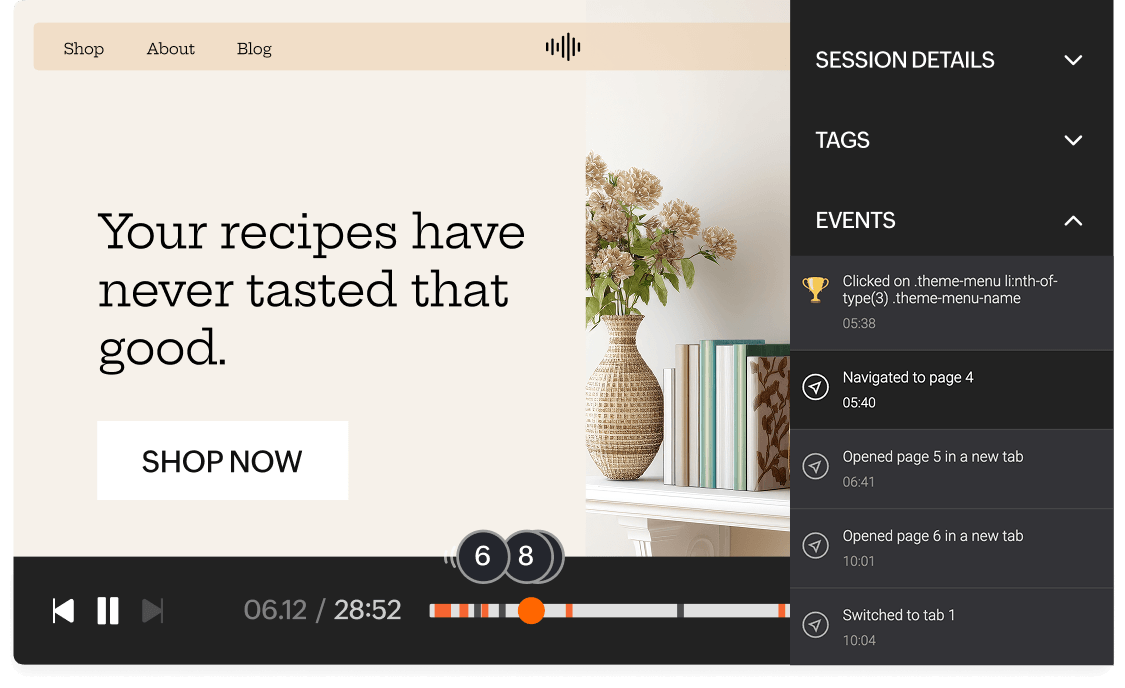
Session recordings
Video replays of individual visitor sessions. You see every cursor movement, click, hesitation, and exit. GDPR-compliant—sensitive fields are automatically masked. Filter by device, goal, duration, or country.
- Where visitors get confused
- Navigation patterns that lead to (or away from) conversion
- Mobile experience issues invisible in aggregate data
Form analytics
Field-level data on how visitors interact with every form on your site. Shows which field has the highest drop-off, how long people hesitate before giving up, and how often they go back to correct a field. Unlimited forms on the free plan.
- Which one field is killing your form completion rate
- Average hesitation time per field
- Abandonment rate and at which step it spikes

Funnel analysis
Map your checkout or sign-up flow and see drop-off rates at every step. One funnel on the free plan—enough for your most important path. Break down by device or traffic source.
- The one step leaking most of your conversions
- Whether mobile or desktop loses visitors first
- Whether a recent change helped or hurt conversion

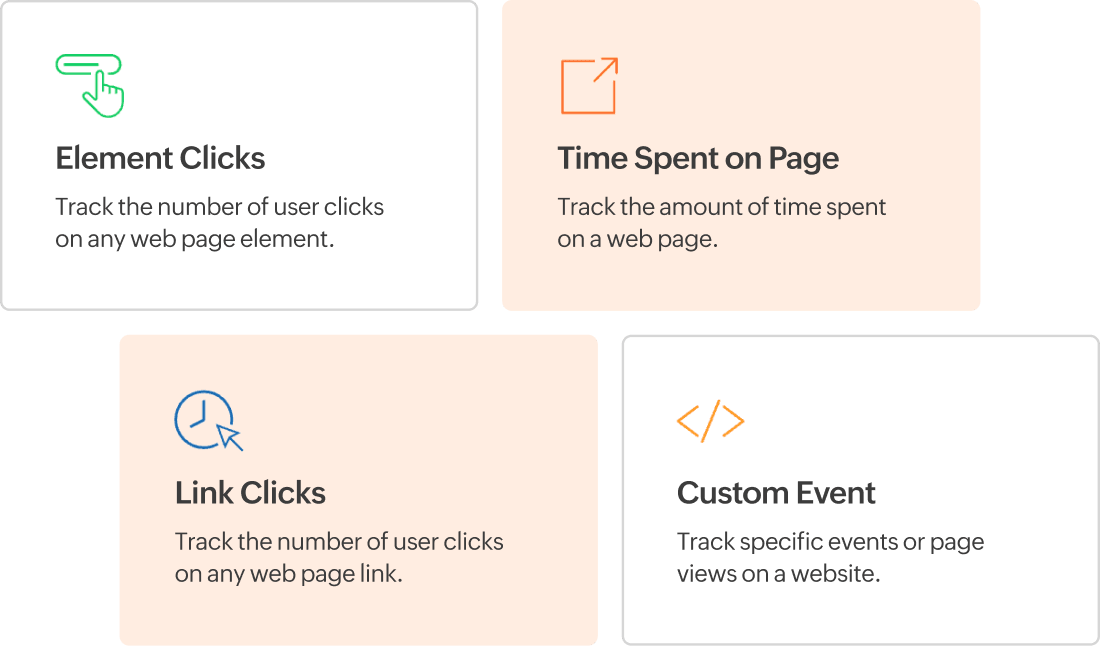
Conversion goals
Tracks the actions that actually matter to your business — form submissions, button clicks, page visits, and revenue — without additional code. Define what success looks like, make a change, and know within days whether it moved the needle.
- Whether your site changes are actually improving conversions
- Which traffic source converts best, not just which sends the most visitors
- How completion rates compare across devices and segments
Frequently Asked Questions
Zoho PageSense is genuinely free as long as you're under 5,000 visitors a month. No trial clock, no expiration date. If your traffic grows past that—which is the whole point—you can upgrade to a paid plan. If it doesn't, you keep the free plan with no pressure from us. The "catch," if you want to call it that, is just the visitor limit. Everything else is real.
A/B testing and split URL testing: You can analyze behavior but not run controlled experiments. That requires the Enterprise plan.
Personalization: Serving different content to different visitor segments is a paid feature.
Polls, push notifications, and pop-ups: Engagement tools are on paid plans only.
Multiple projects: You get 1 project on the free plan. Managing more than one website means upgrading.
Data retention beyond 3 months: Historical data is capped. Paid plans extend to 6–12 months.
Custom dimensions: Available on Professional (30) and Enterprise (50) only.
Installing tracking code is a one-time process. For websites developed from scratch, you might need help from your development team. For the websites created through any CMS platform, you can copy the tracking code and paste it into your website's section, you are done.
The tracking script loads asynchronously—it runs in the background and doesn't block anything your visitor sees. In plain terms, it won't make your pages feel slower. We're pretty obsessive about this because we know page speed is a conversion factor too.
Your historical recordings and heatmap data stay accessible for 30 days after a downgrade, so you have time to export anything you want to keep. We don't delete anything immediately. If you ever want a full data export, just ask support—it's a standard request
GA tells you how many people left. PageSense tells you what they did before they left—where their mouse went, where they clicked, which form field stopped them. They answer different questions. Most teams use both. The free plan is worth adding even if you don't want to replace anything.
The honest reason we're doing this.
We built the free plan because we think that once you actually see where people are dropping off your site, you'll want to fix it. And when you start growing, there's a decent chance you'll want more from PageSense.
But honestly, that's the whole pitch. No hidden data caps that suddenly kick in after 15 days. No features that are technically "included" but quietly limited to be useless. You get the real tools. If you stay on the free plan forever, that's fine. If you need more, we'll be here.
We just think small teams and solo founders shouldn't be priced out of basic conversion data. That's it.
Two minutes to set up.
Weeks of guessing saved.
No sales call. No credit card. No getting locked into something you didn't ask for. Just cleaner data about your actual visitors.
Sign Up — It's Free Free forever under 5,000 visitors/mo