
Home
When you log in to Zoho Books, you will first see the Home page, which clearly shows the financial health of your organisation.
Dashboard Tab
The Dashboard tab in Zoho Books provides a clear view of your finances. You can easily track your income, expenses, bank balances, project time logs, and outstanding amounts. It also includes visual charts that allow you to monitor your business’s financial performance at a glance.
Total Receivables
In Zoho Books, the Total Receivables panel displays the amount your customers owe you. It is divided into two sections:
- Current: The amount yet to be received for invoices that haven’t crossed the payment due date.
- Overdue: The amount yet to be received for invoices that have crossed the payment due date.
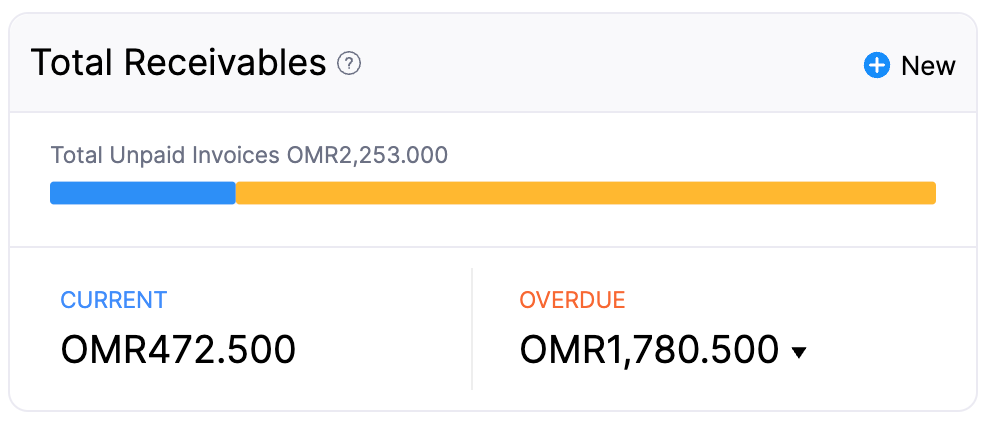
You can click the Current or Overdue amount under Total Receivables to view the AR Aging Details By Invoice Due Date report.
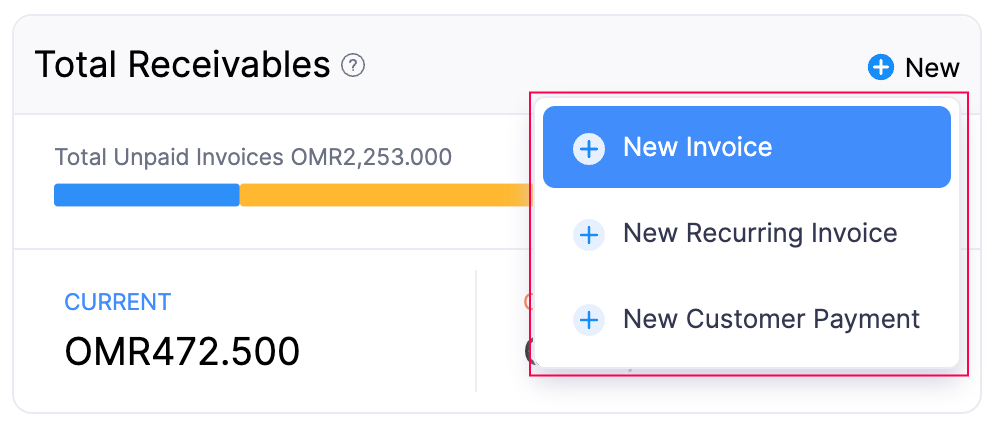
To create new transactions within this tab:
- Click + New in the top right corner of the panel.
- In the dropdown, you can create the following transactions:
- Invoice
- Recurring Invoice
- Customer Payment
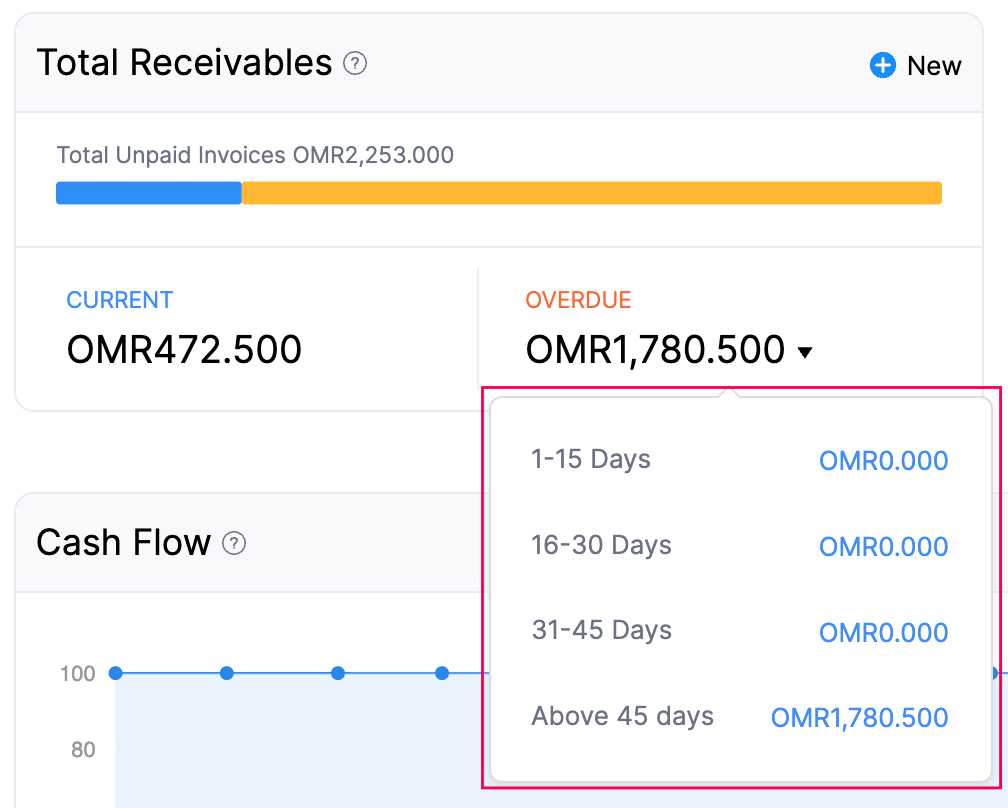
Additionally, by clicking the drop-down next to the Overdue amount, you can choose the desired time range.
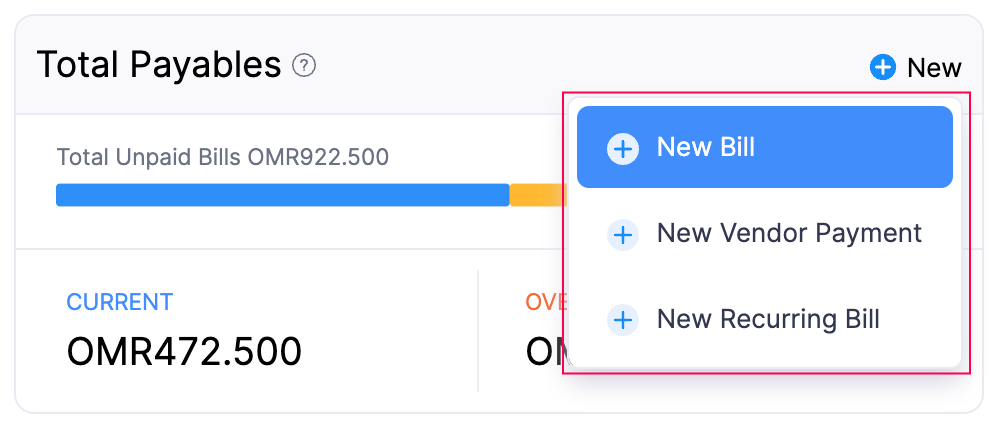
Total Payables
In Zoho Books, the Total Payables panel displays the amount you owe your vendors. It is divided into two sections:
- Current: The amount you have yet to pay for purchase transactions that haven’t crossed the payment due date.
- Overdue: The amount you have yet to pay for purchase transactions that have crossed the payment due date.
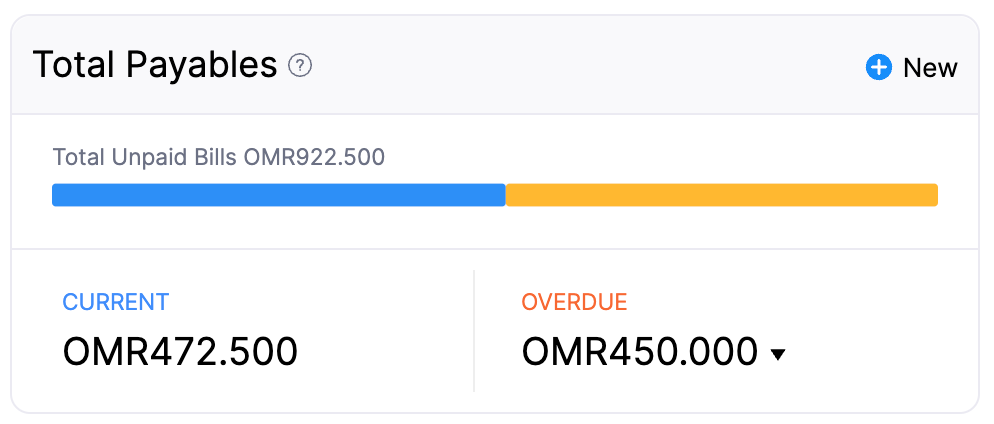
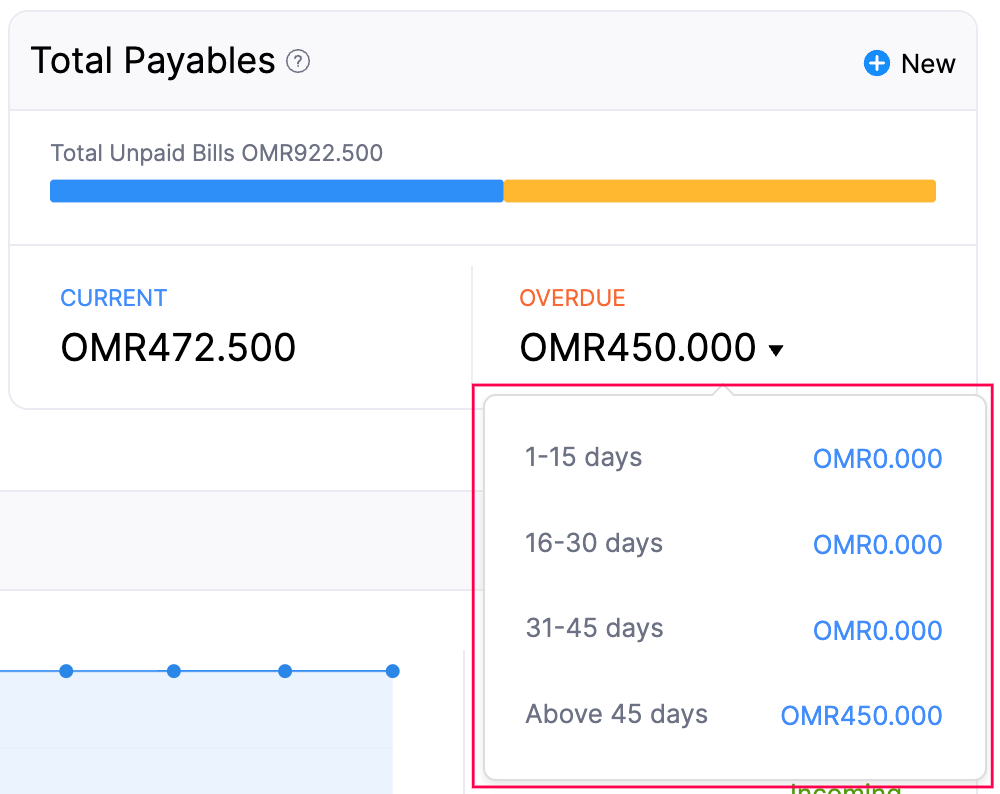
You can click the Current or Overdue amount under Total Payables to view the AP Aging Details By Bill Due Date report.
To create new transactions within this panel:
- Click + New in the top right corner of the panel.
- In the dropdown, you can create the following transactions:
- Bill
- Vendor Payment
- Recurring Bill
Additionally, by clicking the drop-down next to the Overdue amount, you can choose the desired time range.
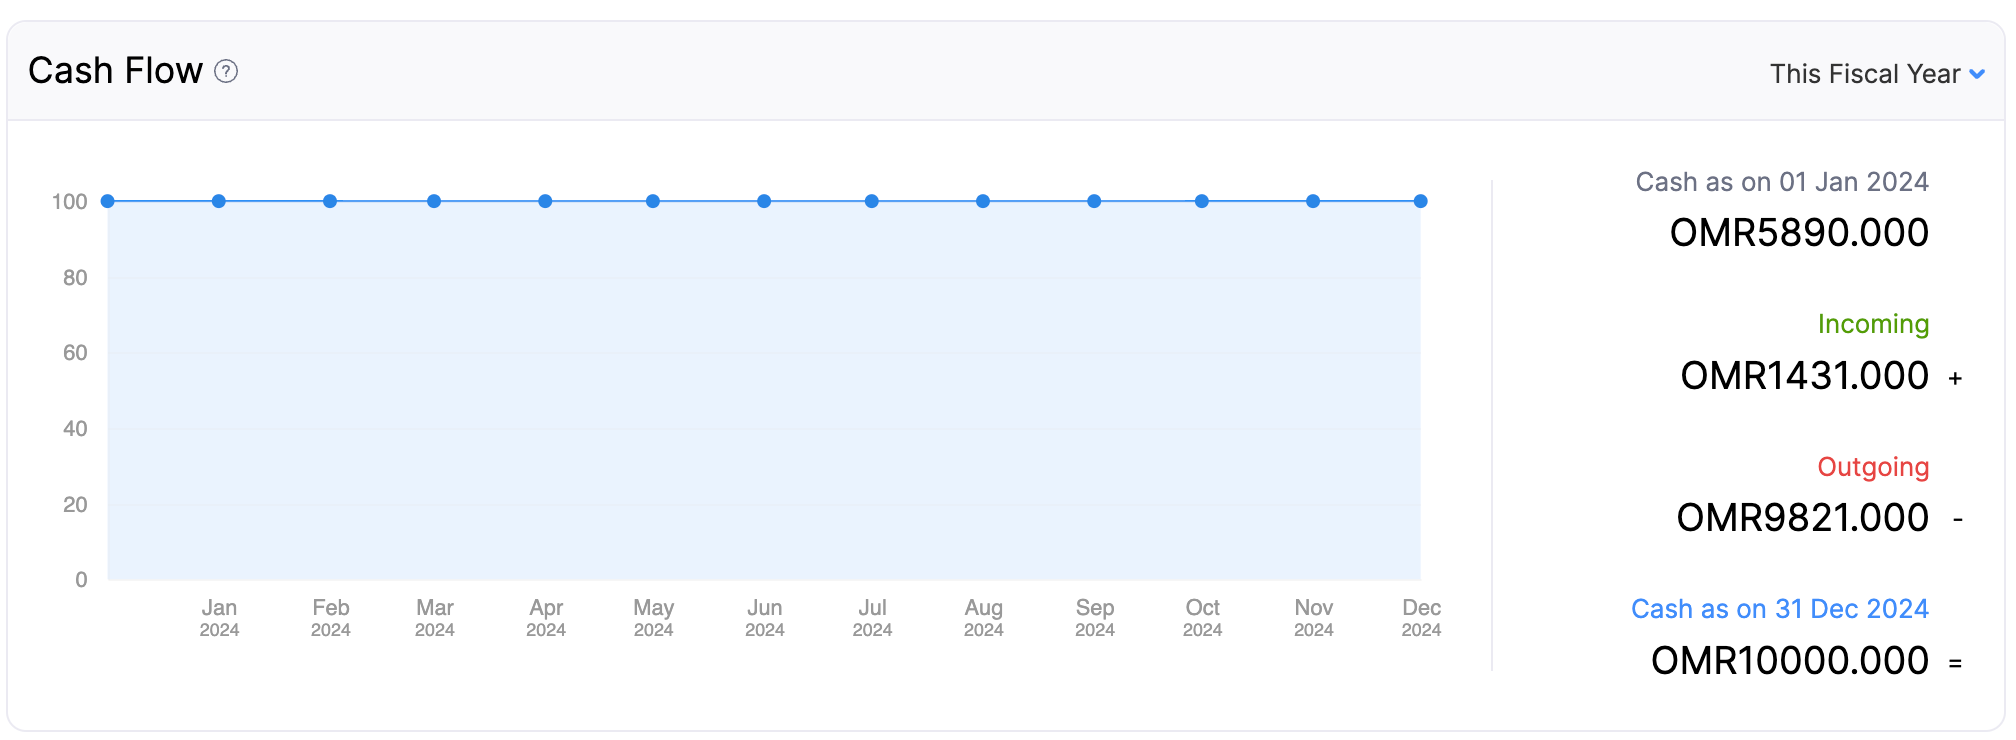
Cash Flow
In Zoho Books, the Cash Flow panel shows the cash flowing in and out of your organisation. The Cash Flow Graph is generated based on your organisation’s cash flow report. This graph is shown based on the following three sections:
- Cash as on “Date”: This displays the cash you had at the beginning and the end of your fiscal year.
- Incoming: The sum of debit entries from banks, cards, cash, and payment clearing accounts.
- Outgoing: The sum of credit entries from banks, cards, cash, and payment clearing accounts.
Insight:The graph is made using the direct method, where you can calculate the difference between the total cash spent and the total cash received by your organisation. The cash flow statement report uses the indirect method, which includes non-cash expenses like depreciation and inventory adjustments. For instance, you can calculate the difference between the net income and a purchase you haven’t paid for.
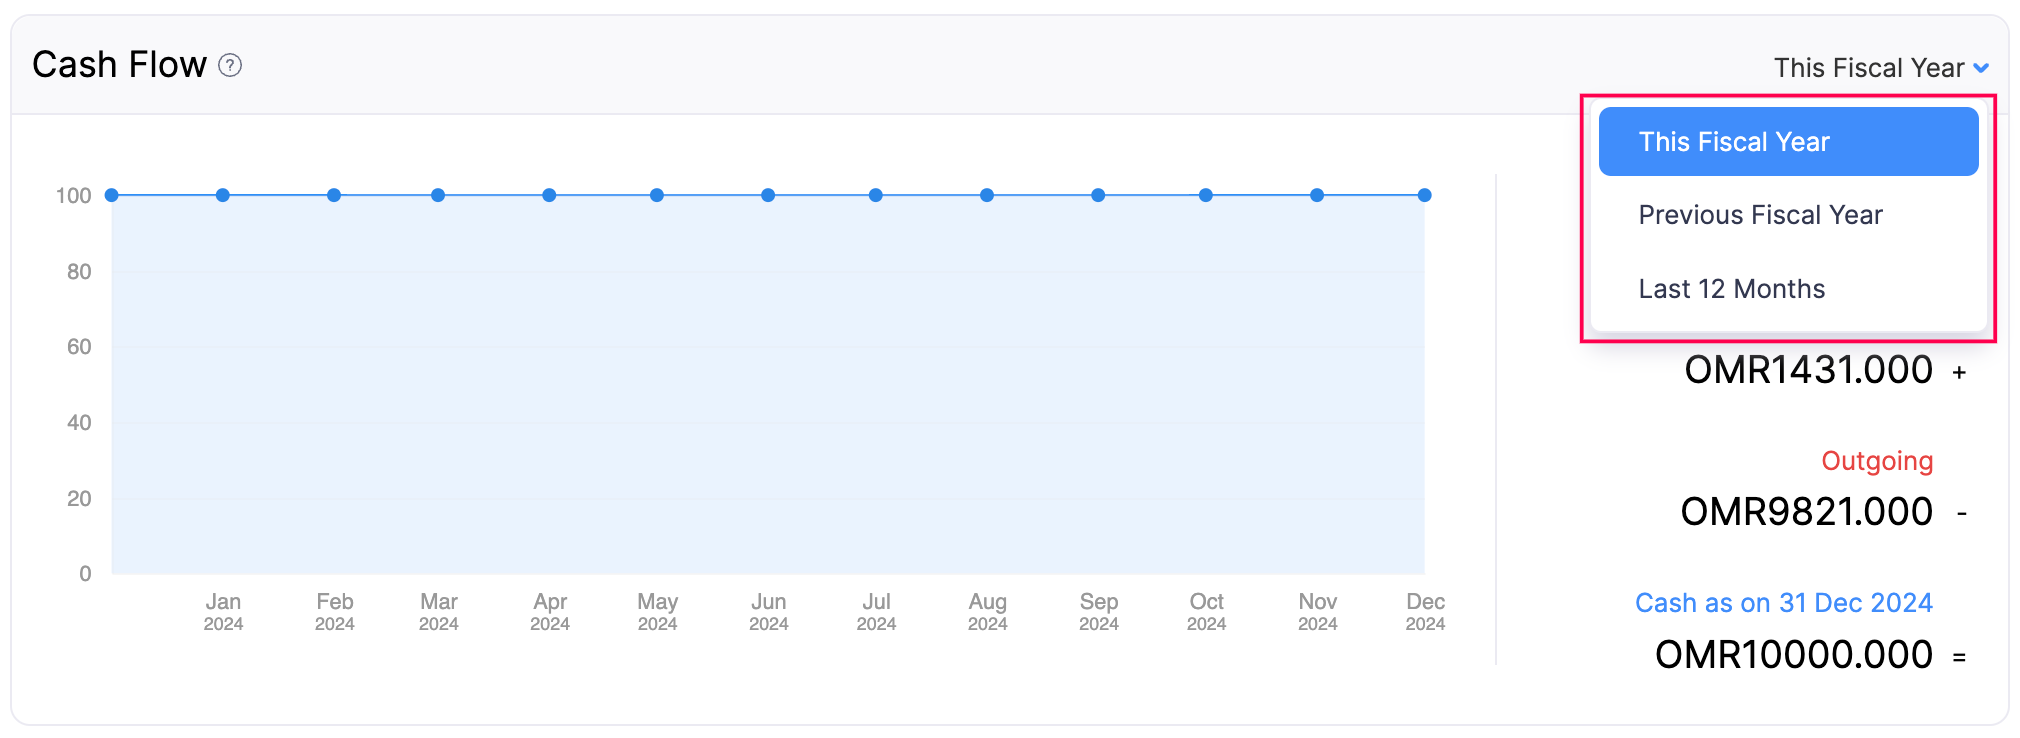
You can customise the cash flow graph based on different time periods:
- Click on This Fiscal Year in the top right corner of the panel.
- Choose the desired timeline from the dropdown.
Income and Expense
In Zoho Books, the Income and Expense panel shows the total income and expenses of your organisation. It is divided into two sections:
- Total Income: Shows the amount received from sales transactions and bank deposits.
- Total Expenses: Shows the amount spent on purchase transactions and bank withdrawals.
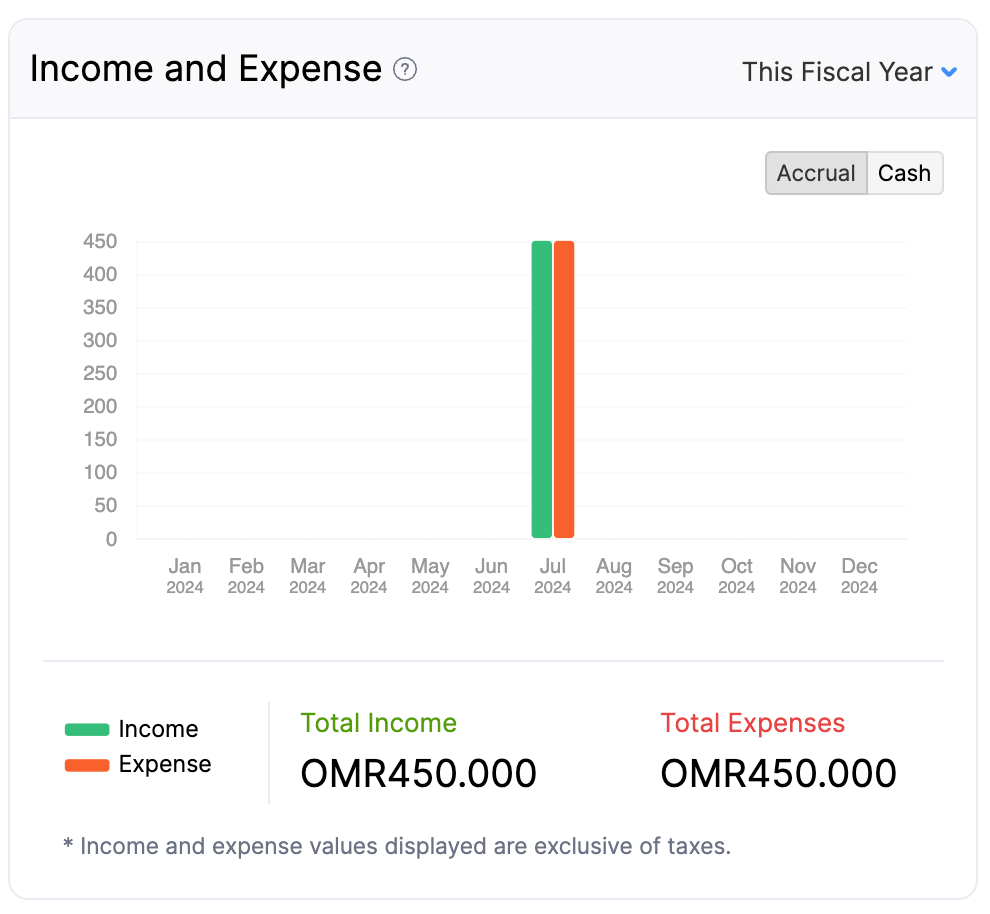
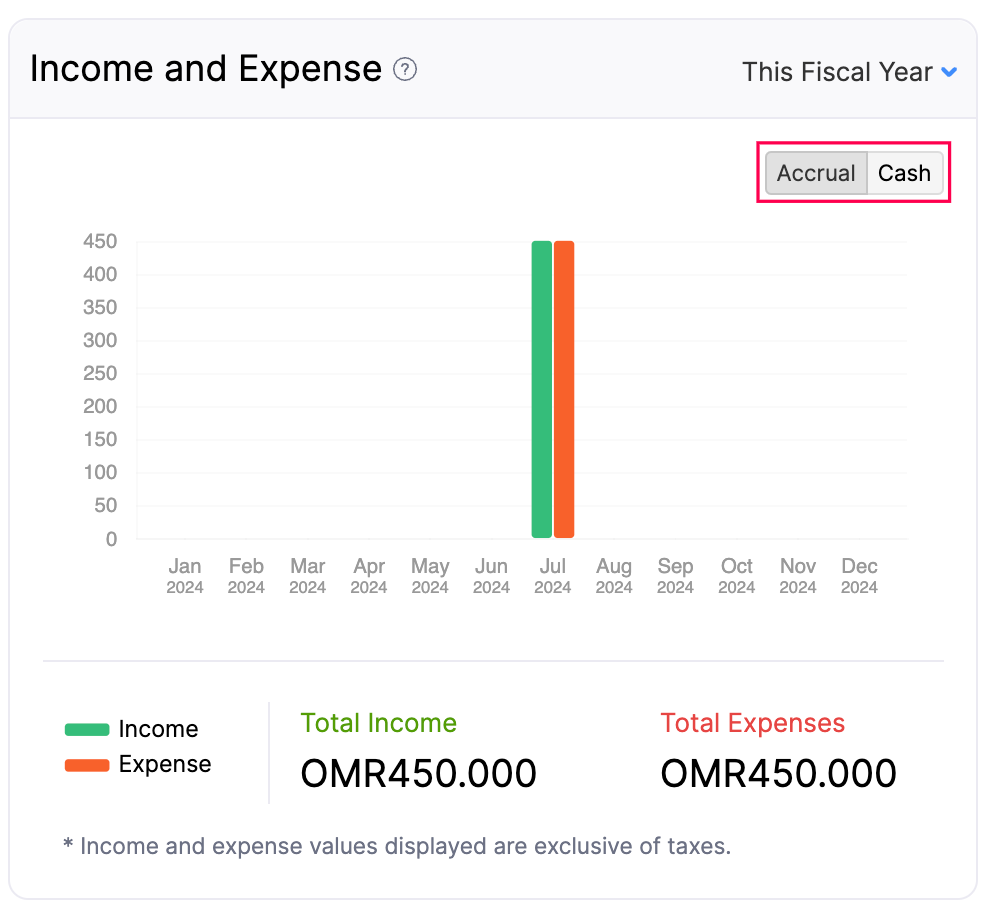
You can view the Profit and Loss report by clicking on the bar graph. To see income and expenses on a cash or accrual basis, click Cash or Accrual in the top right corner of the graph.
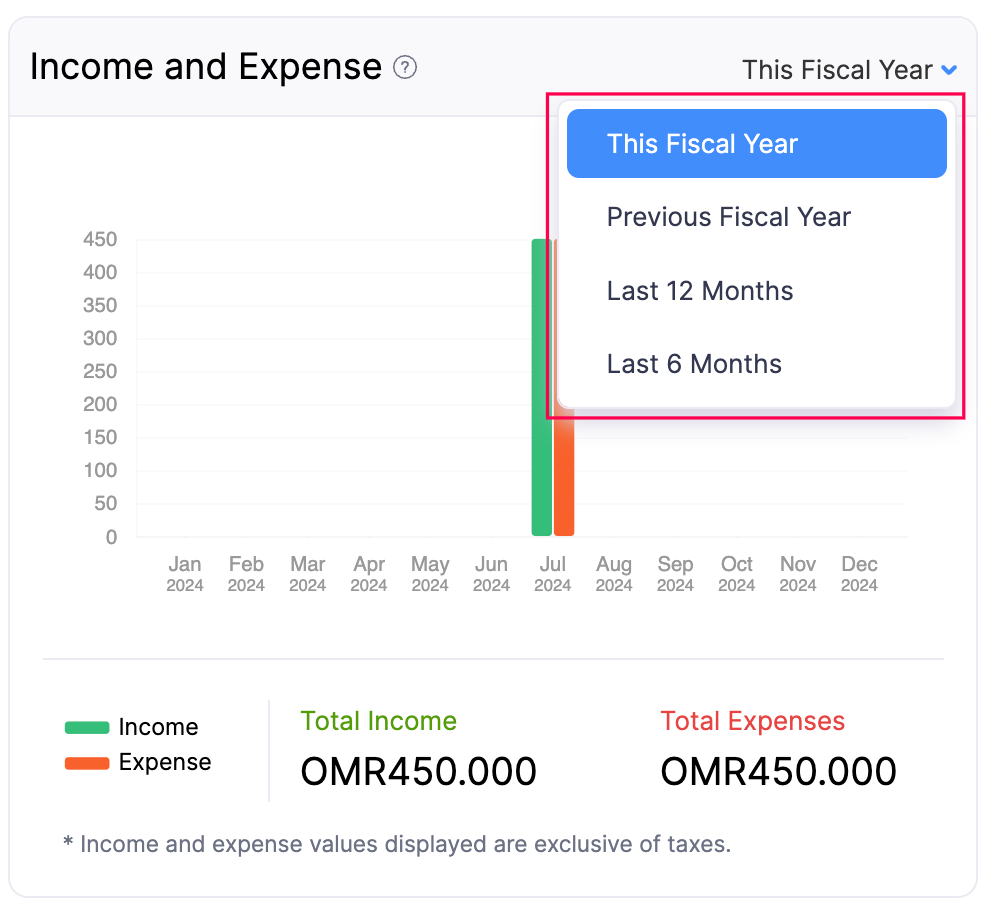
To customise the Income and Expenses graph based on different time periods:
- Click This Fiscal Year in the top right corner of the panel.
- Choose the desired timeline from the dropdown.
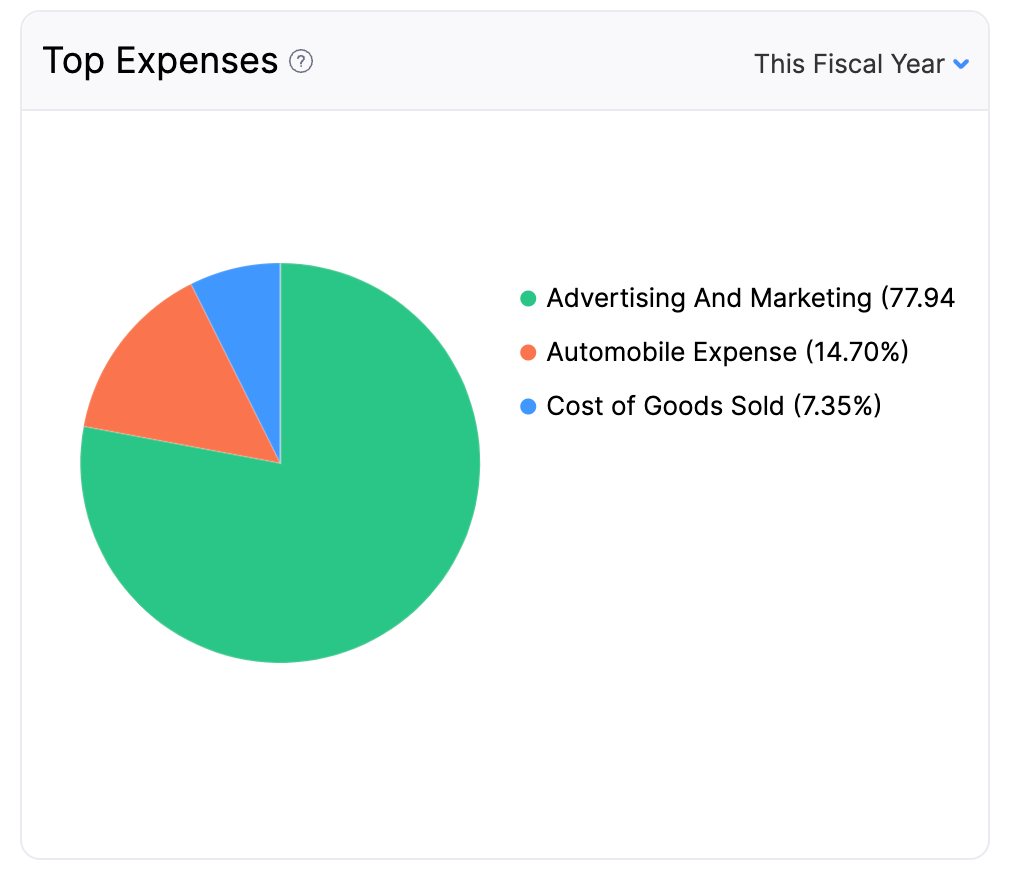
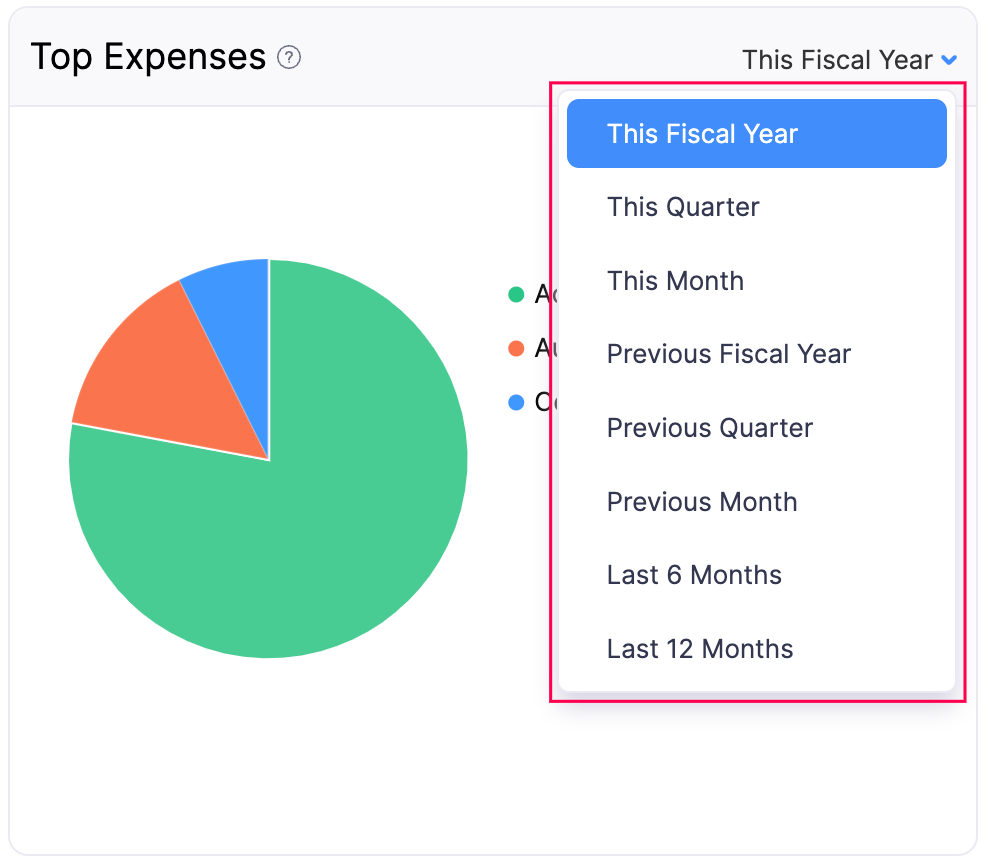
Top Expenses
In the Top Expenses panel, the pie chart shows all the top expenses recorded in Zoho Books. Click on any section of the pie chart to view the corresponding transactions in reports.
To customise your top expenses based on different time periods:
- Click This Fiscal Year in the top right corner of the panel.
- Choose the desired timeline from the dropdown.
Projects
In Zoho Books, the Projects panel displays the project names, client names, unbilled hours, and unbilled expenses, making it easy to track everything in one place.
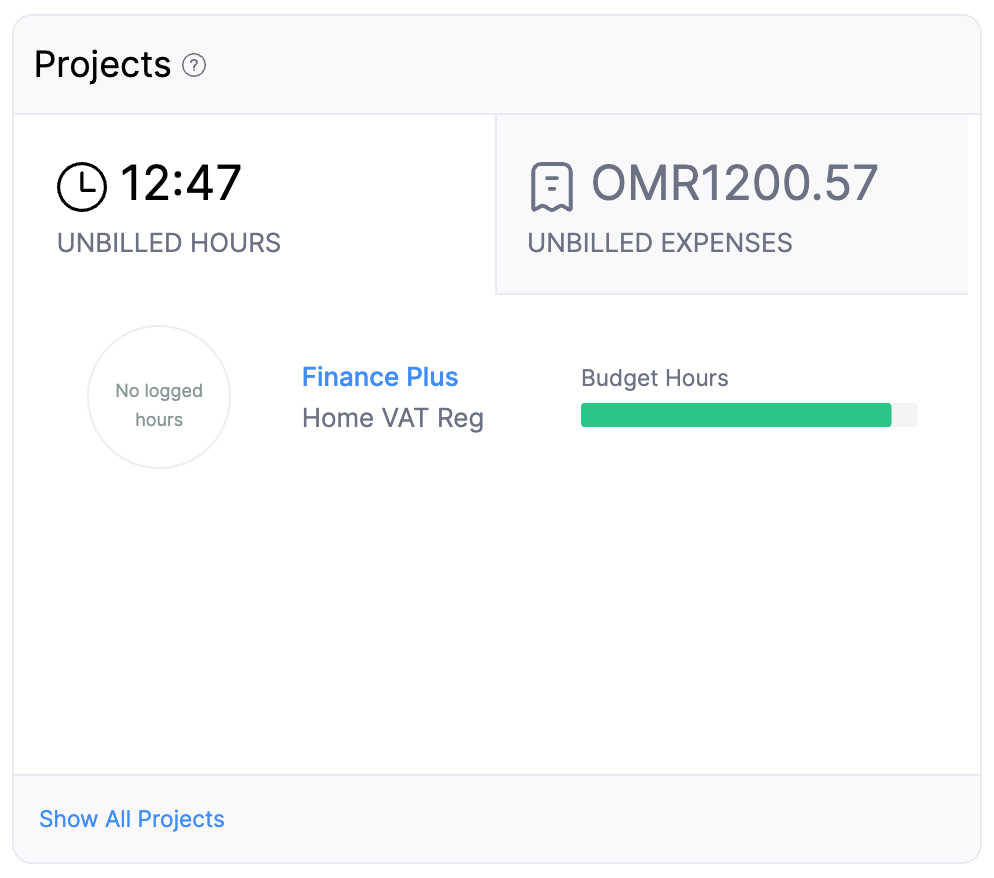
You can view the Project Details page in Timesheets by selecting a project.
Additionally, in this panel, you can view the Unbilled Hours and Unbilled Expenses of the projects in Zoho Books by clicking the Unbilled Expenses or Unbilled Hours tab at the top of the panel.
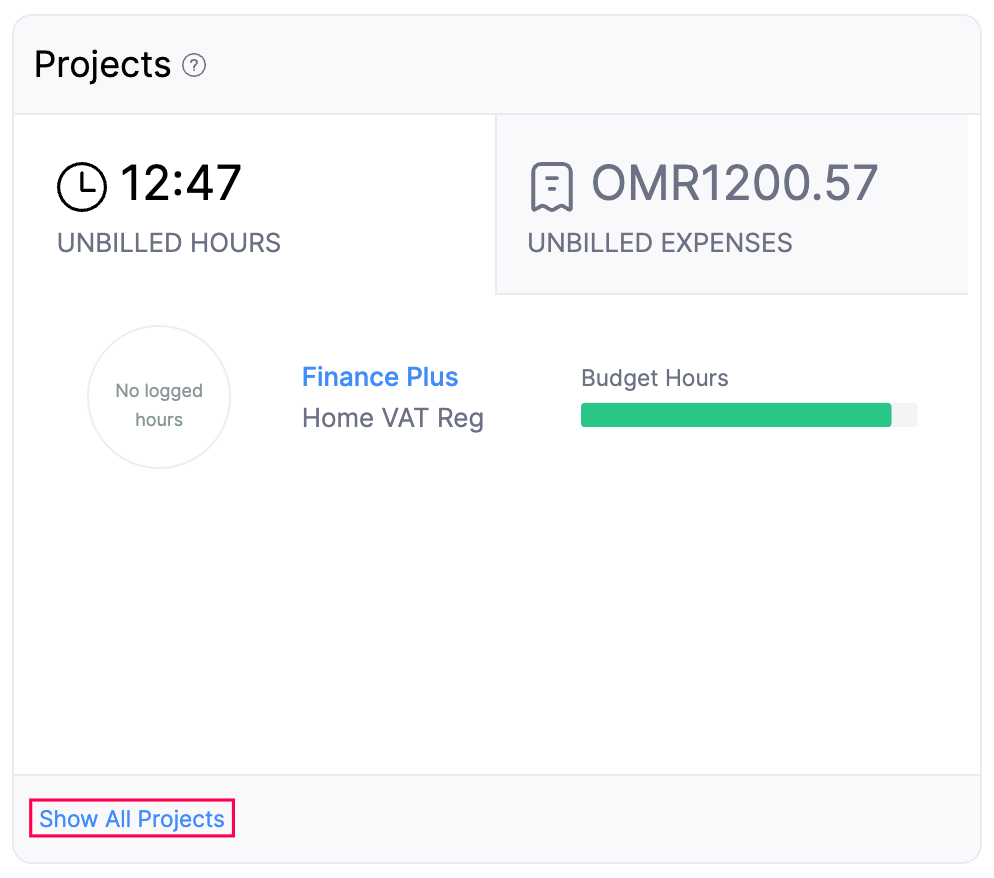
Note:Click Show All Projects at the bottom of the tab to view all the projects in Zoho Books.
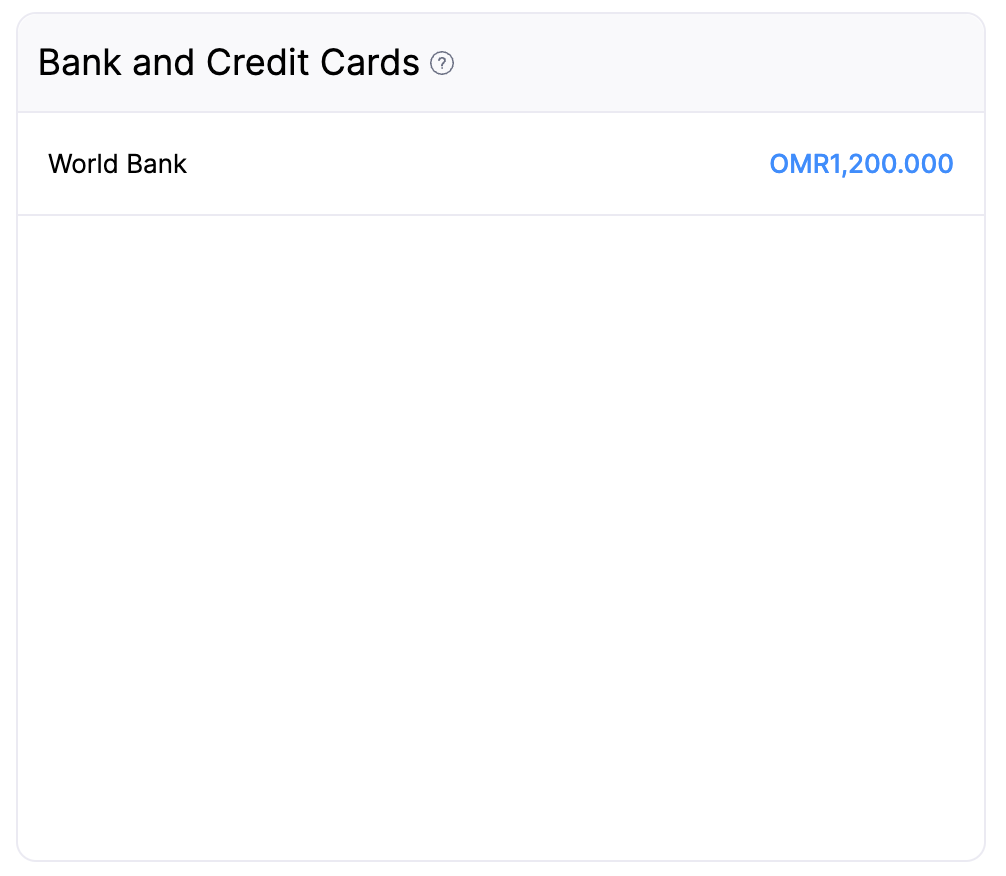
Bank and Credit Cards
In Zoho Books, the Bank and Credit Cards panel shows all your bank accounts and credit cards added in Zoho Books. Select any bank account to view its transactions.
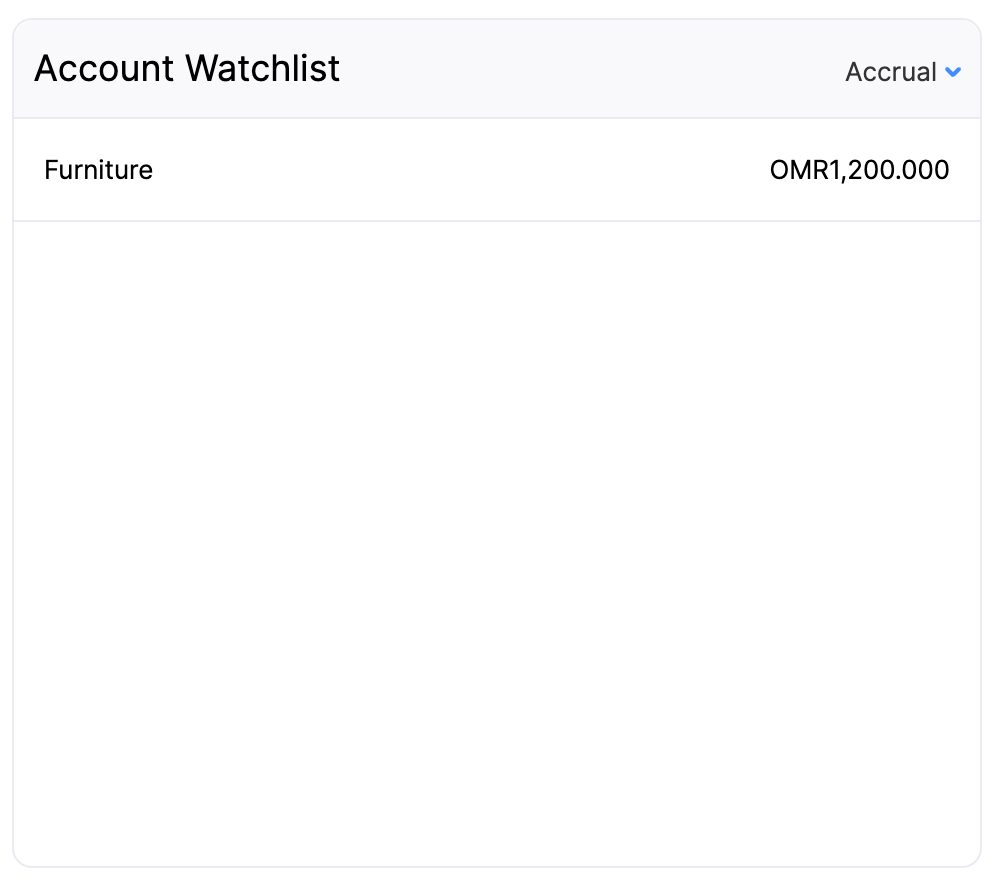
Account Watchlist
In Zoho Books, the Account Watchlist panel lets you monitor the balances of selected accounts in real-time.
To add an account to the account watchlist:
- Go to Accountant in the left sidebar, and select Chart of Accounts.
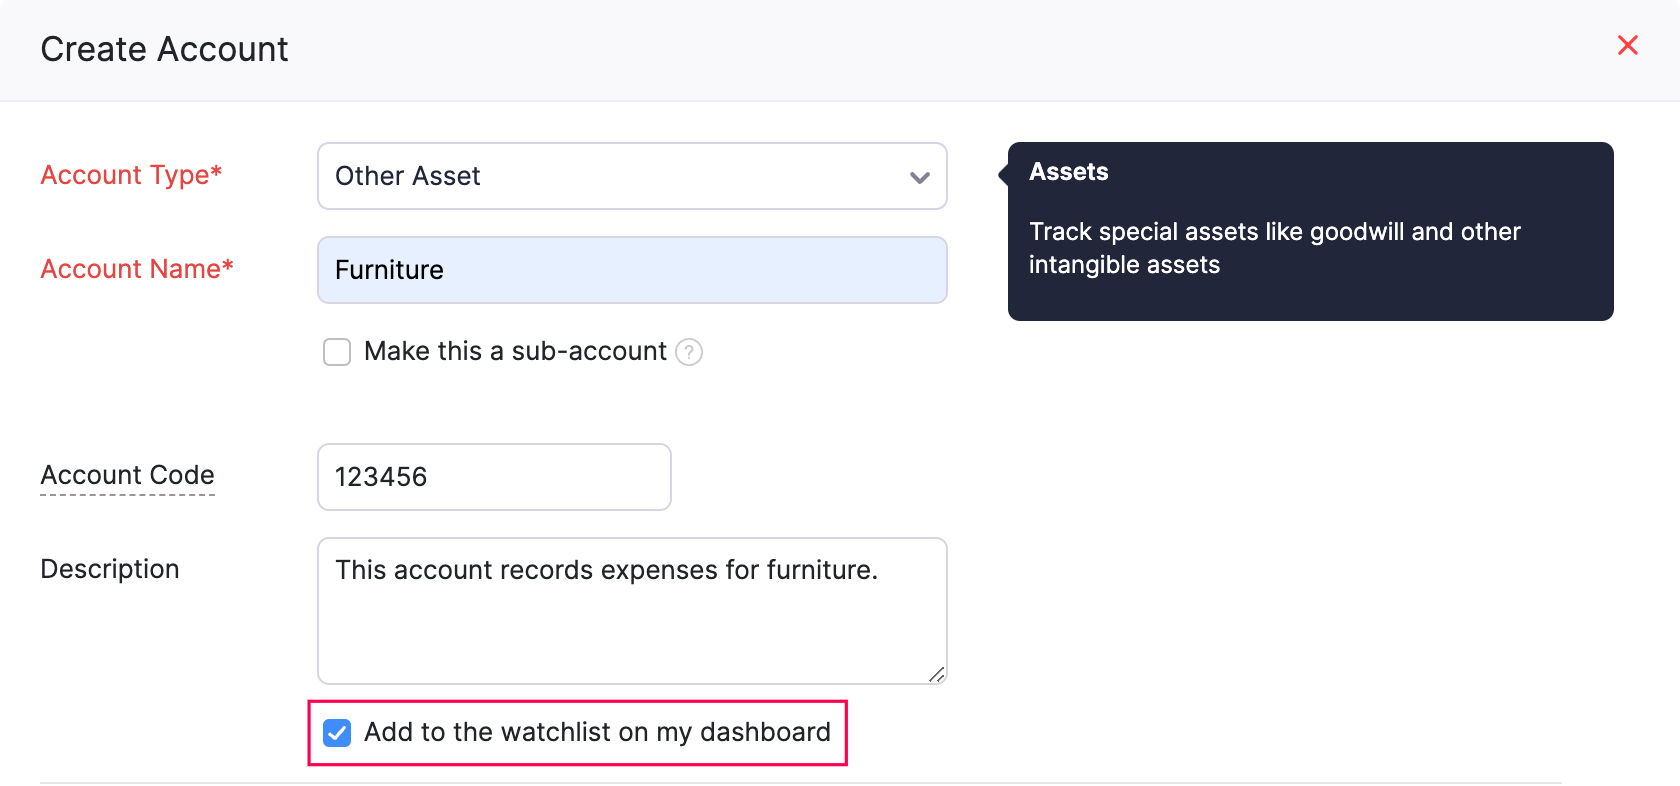
- In this page, hover over and select an existing account and click Edit or click + New Account in the top right corner to create a new one.
- Enter the account details and check Add to the watchlist on my dashboard.
- Click Save.
Now, you can view the account details in this panel of the dashboard.
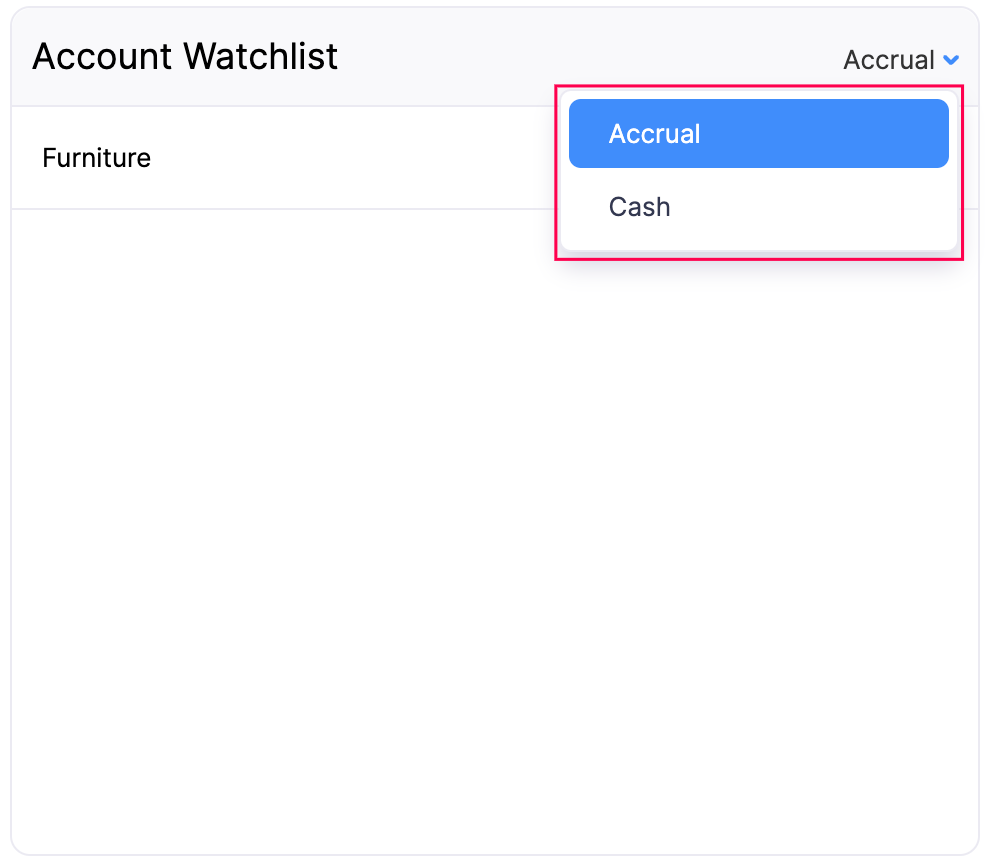
View account balances on a different basis by selecting your preferred option from the Accrual or Cash drop-down menu in the top right corner.
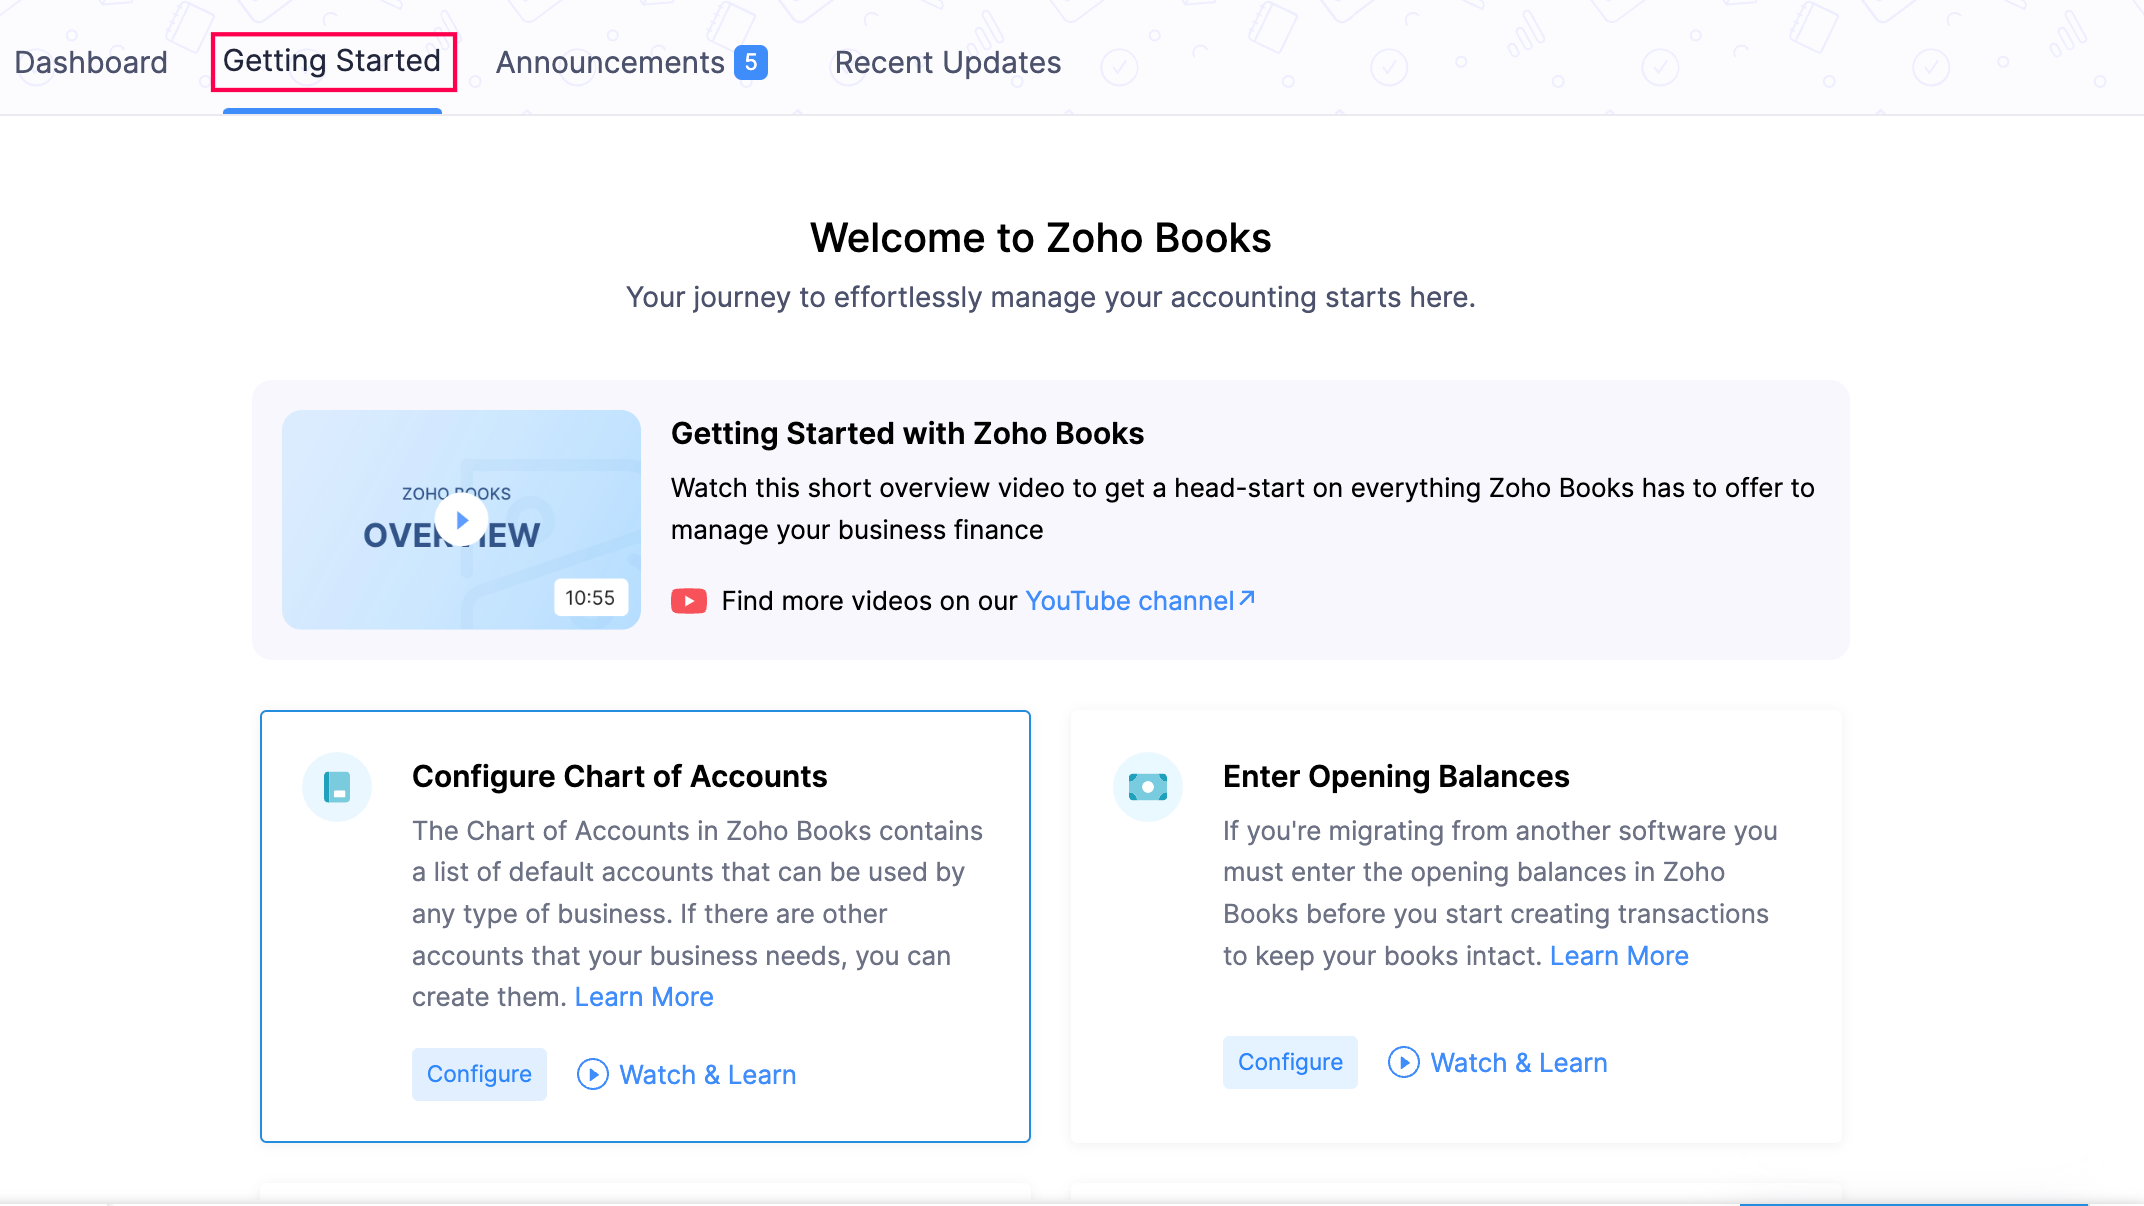
Getting Started Tab
The Getting Started tab in Zoho Books helps you set up your account. You can configure your company profile, add bank accounts, create your first invoice, and set up tax settings.
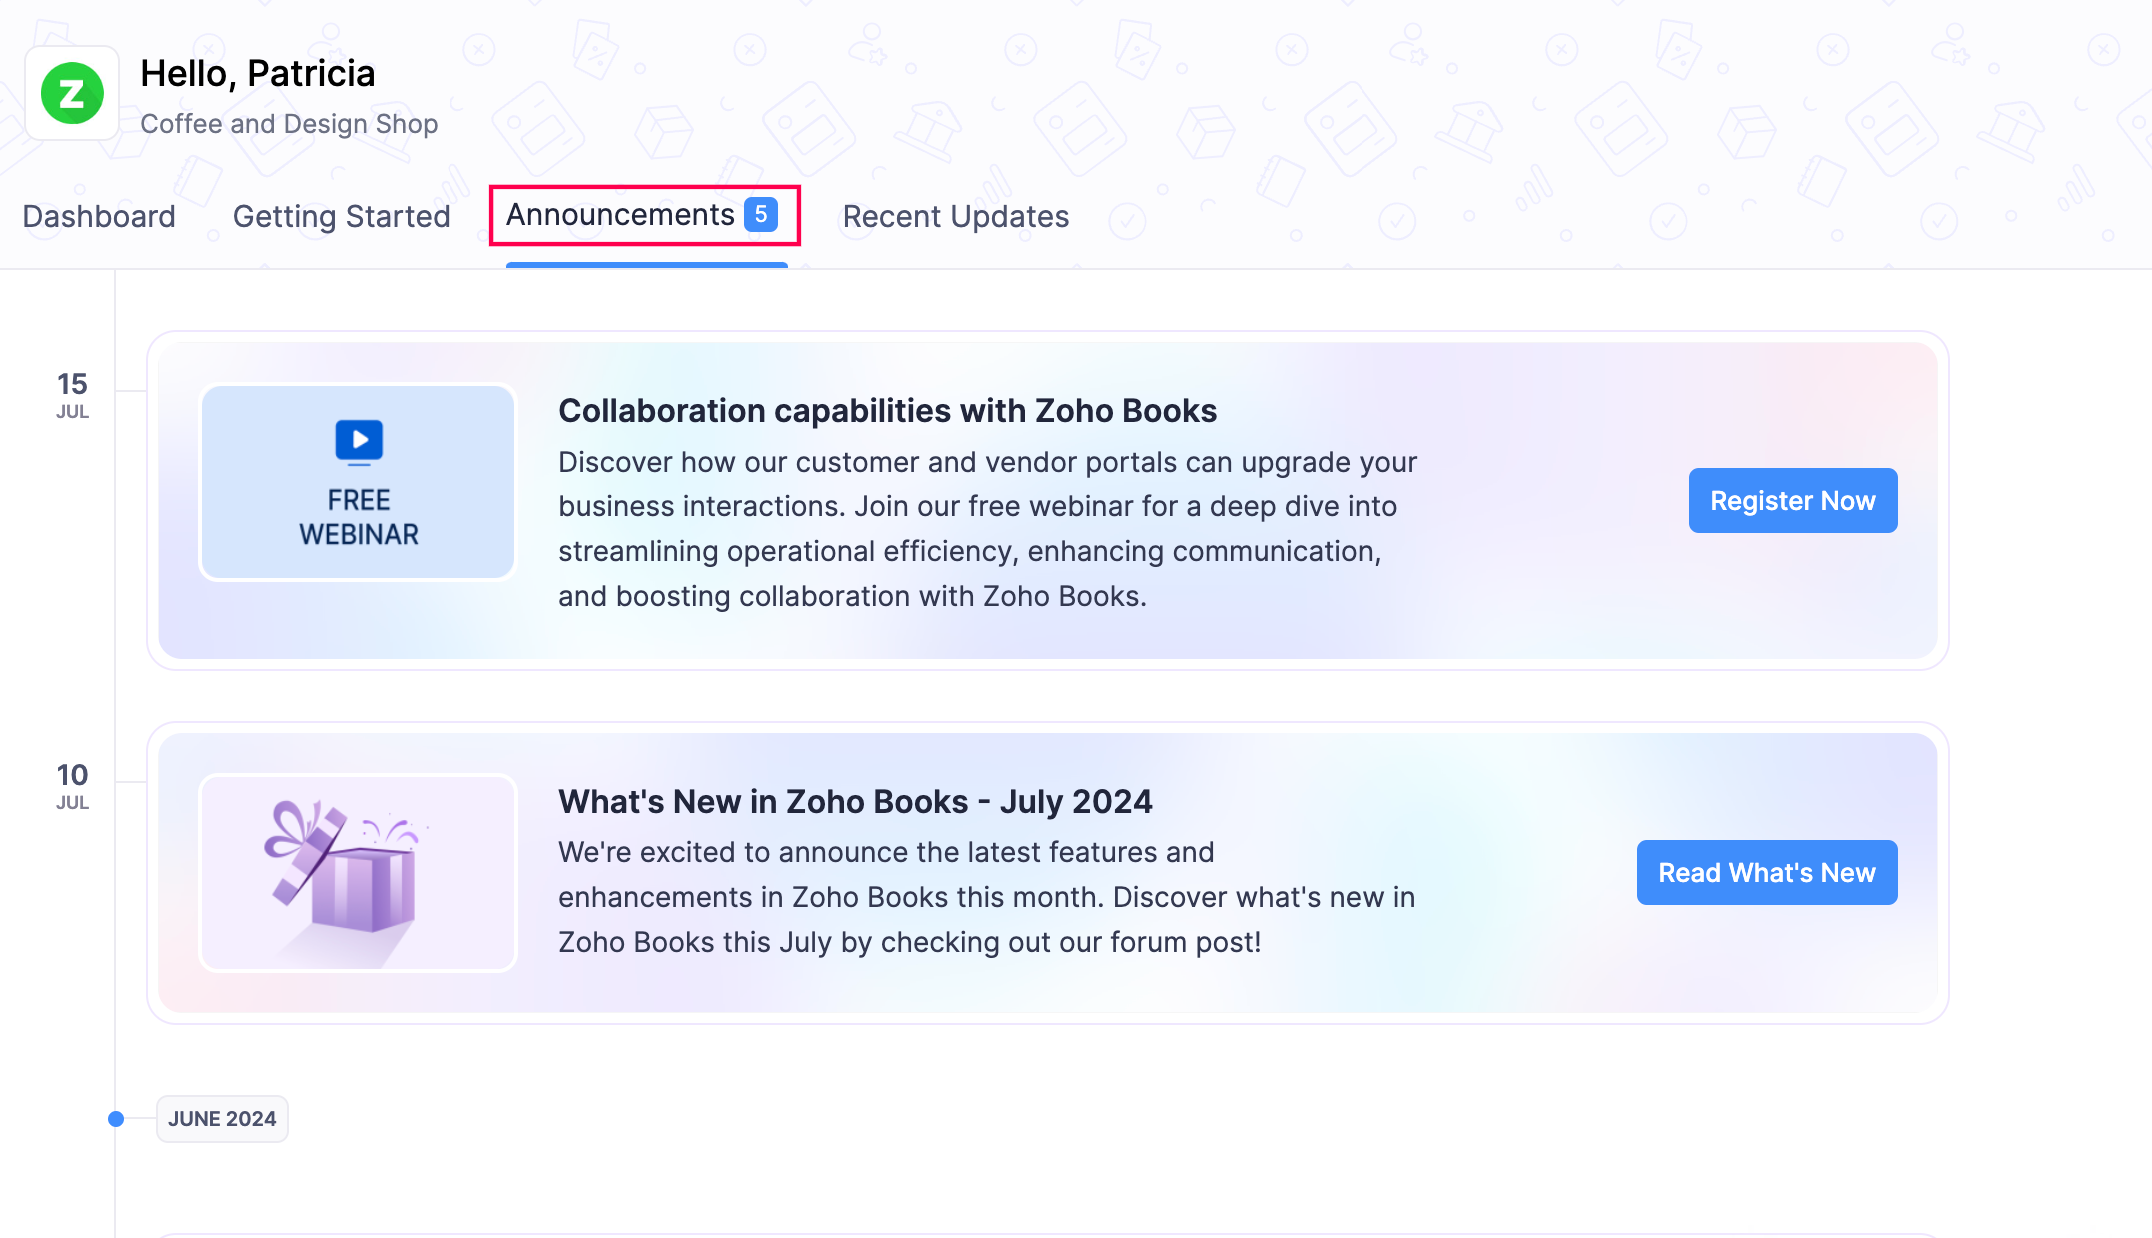
Announcements Tab
The Announcements tab in Zoho Books keeps you updated with the latest news. You can find information on new features, events, webinars, and important updates about Zoho Books.
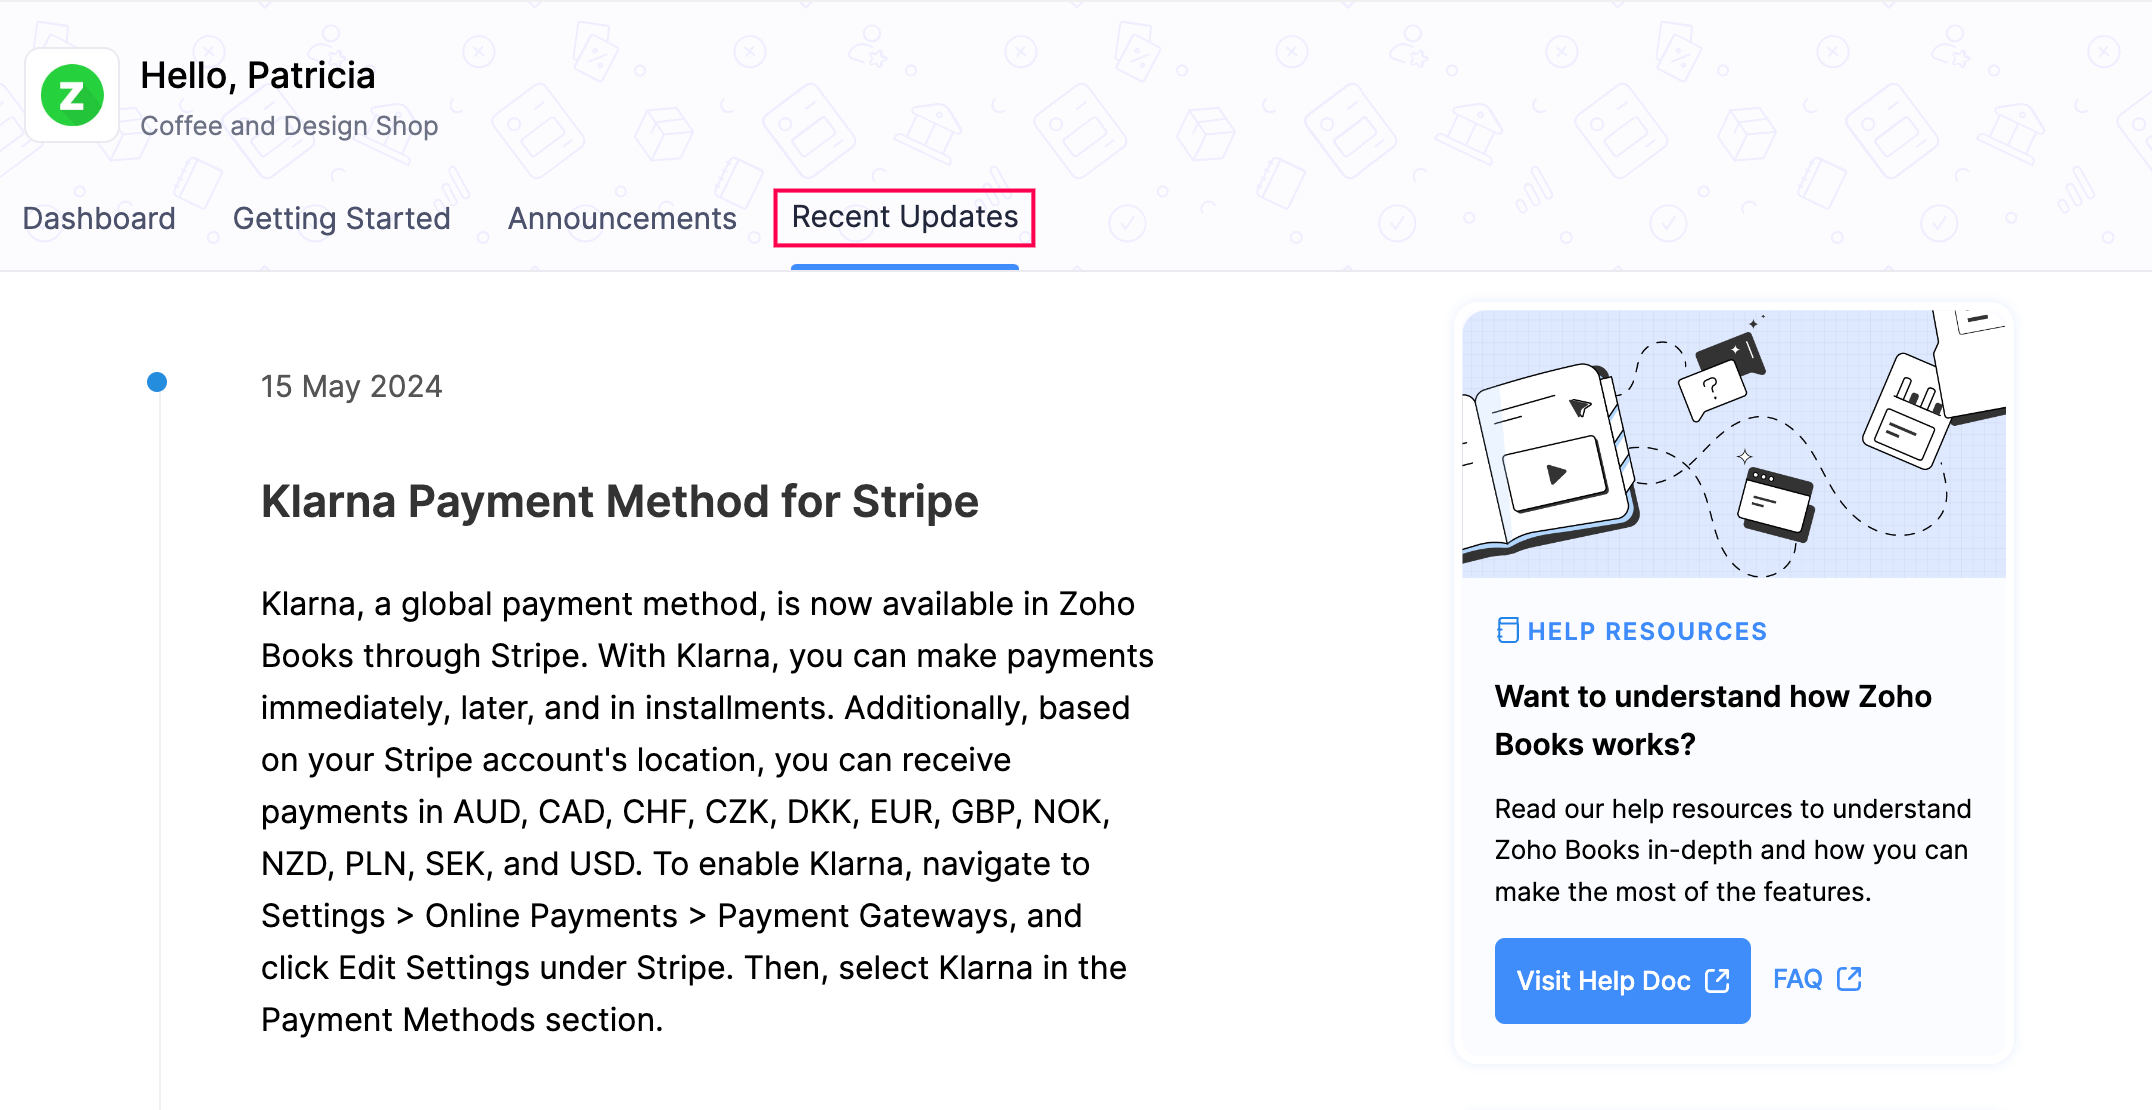
Recent Updates Tab
The Recent Updates tab keeps you updated about the latest changes and enhancements to Zoho Books. You can see details of newly added features, improvements, and bug fixes.
 Yes
No
Yes
No
Thank you for your feedback!