

Dashboard
Dashboard is the first thing you’ll see when you log into your Zoho Invoice account. The dashboard gives you a clear picture of your company’s finances, how much you have to receive and how much you have expended and more details.
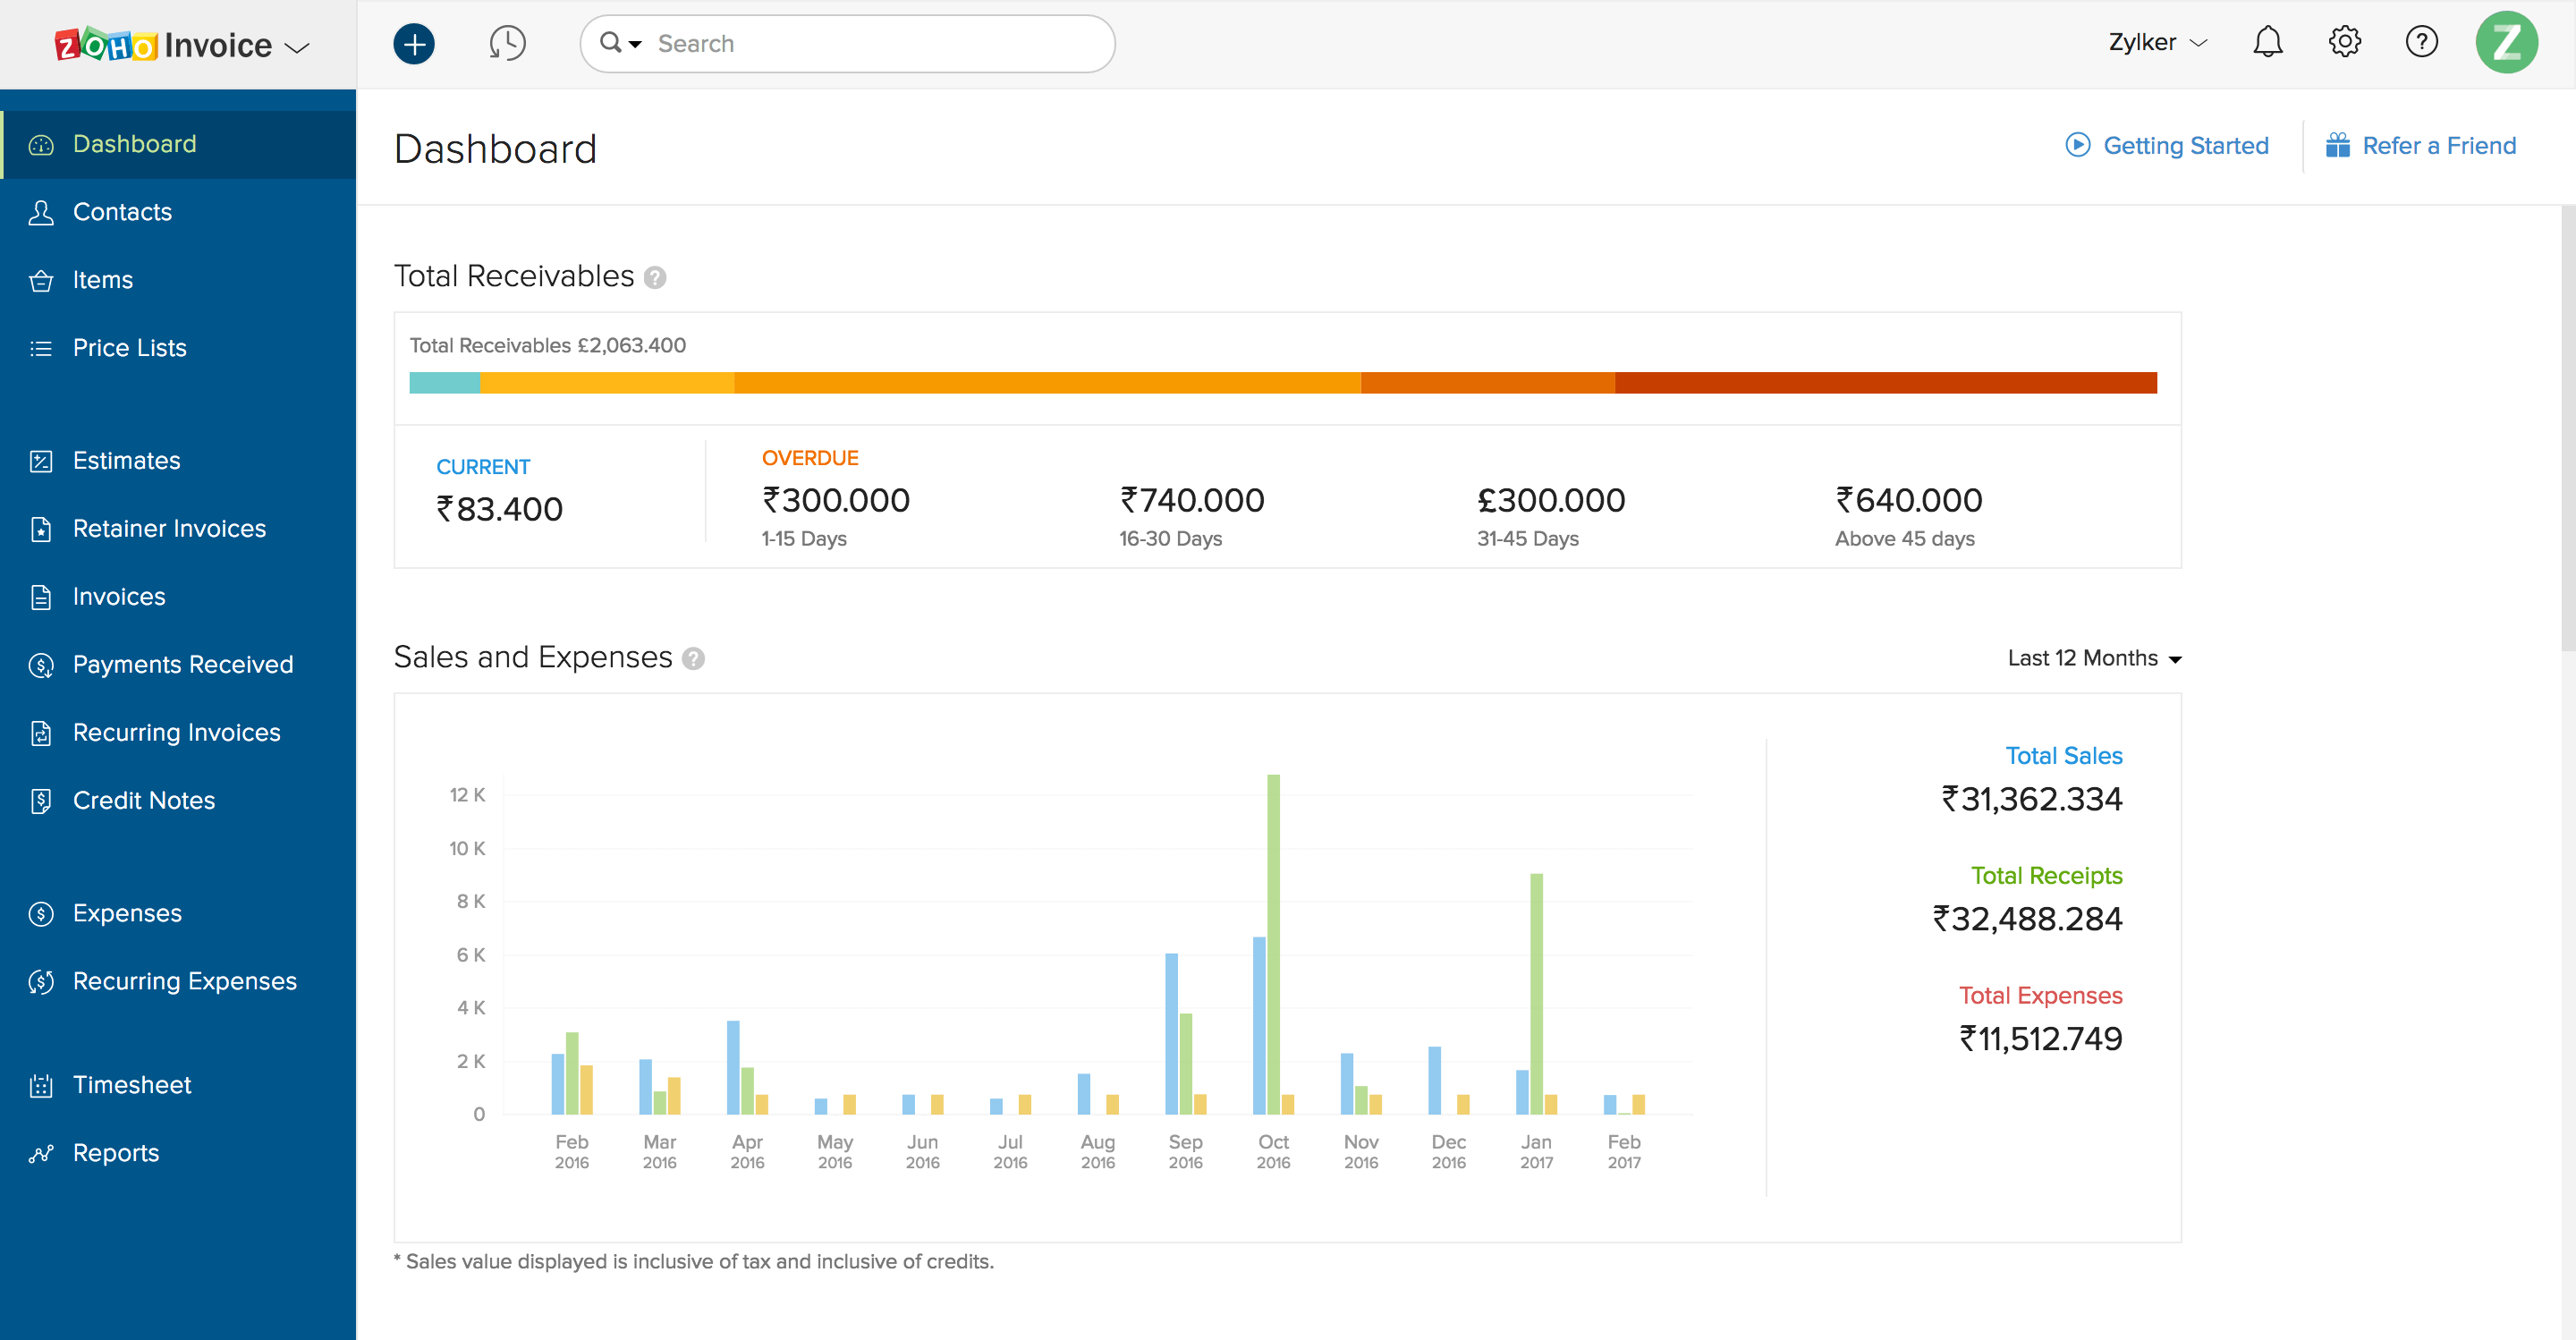
Total Receivables
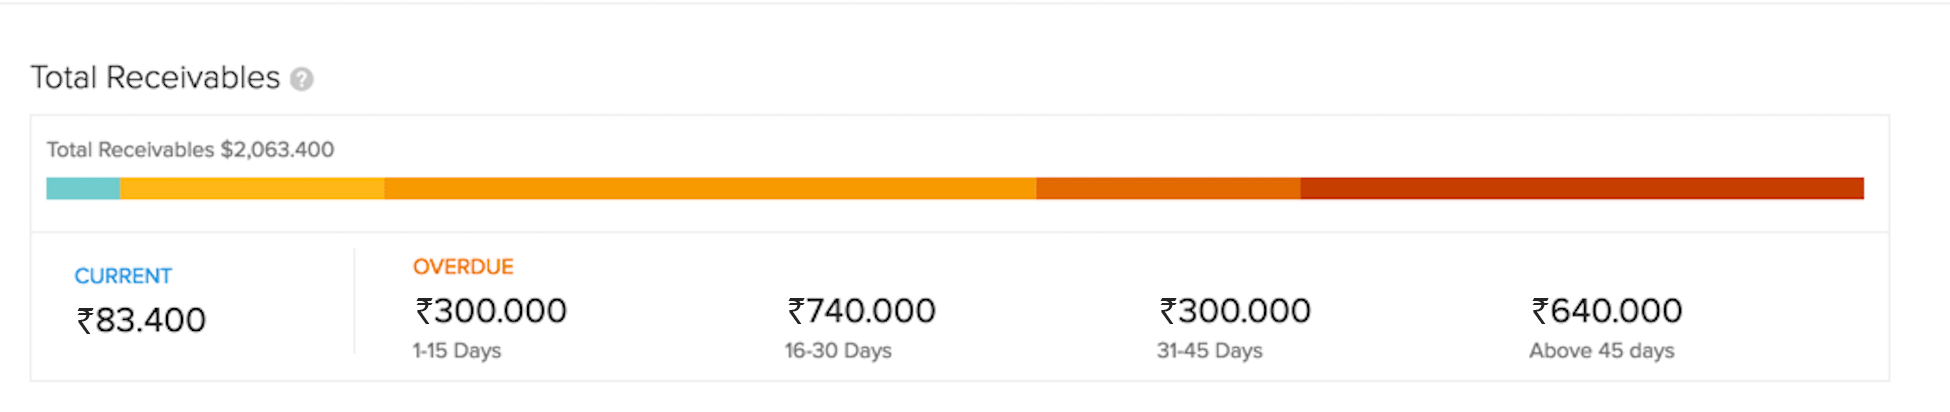
The Total Receivables section displays how much money your customers owe you. This section is divided into two parts:
- Current: The amount that you are yet to receive for invoices that have not crossed the payment due date.
- Overdue: The amount you are yet to receive for invoices that have crossed the due date.
Clicking these numbers will redirect you to the Aging Details report.
The Aging Details report, typically reports the total receivables that are currently due, as well as receivables that are past due.
Sales and Expenses
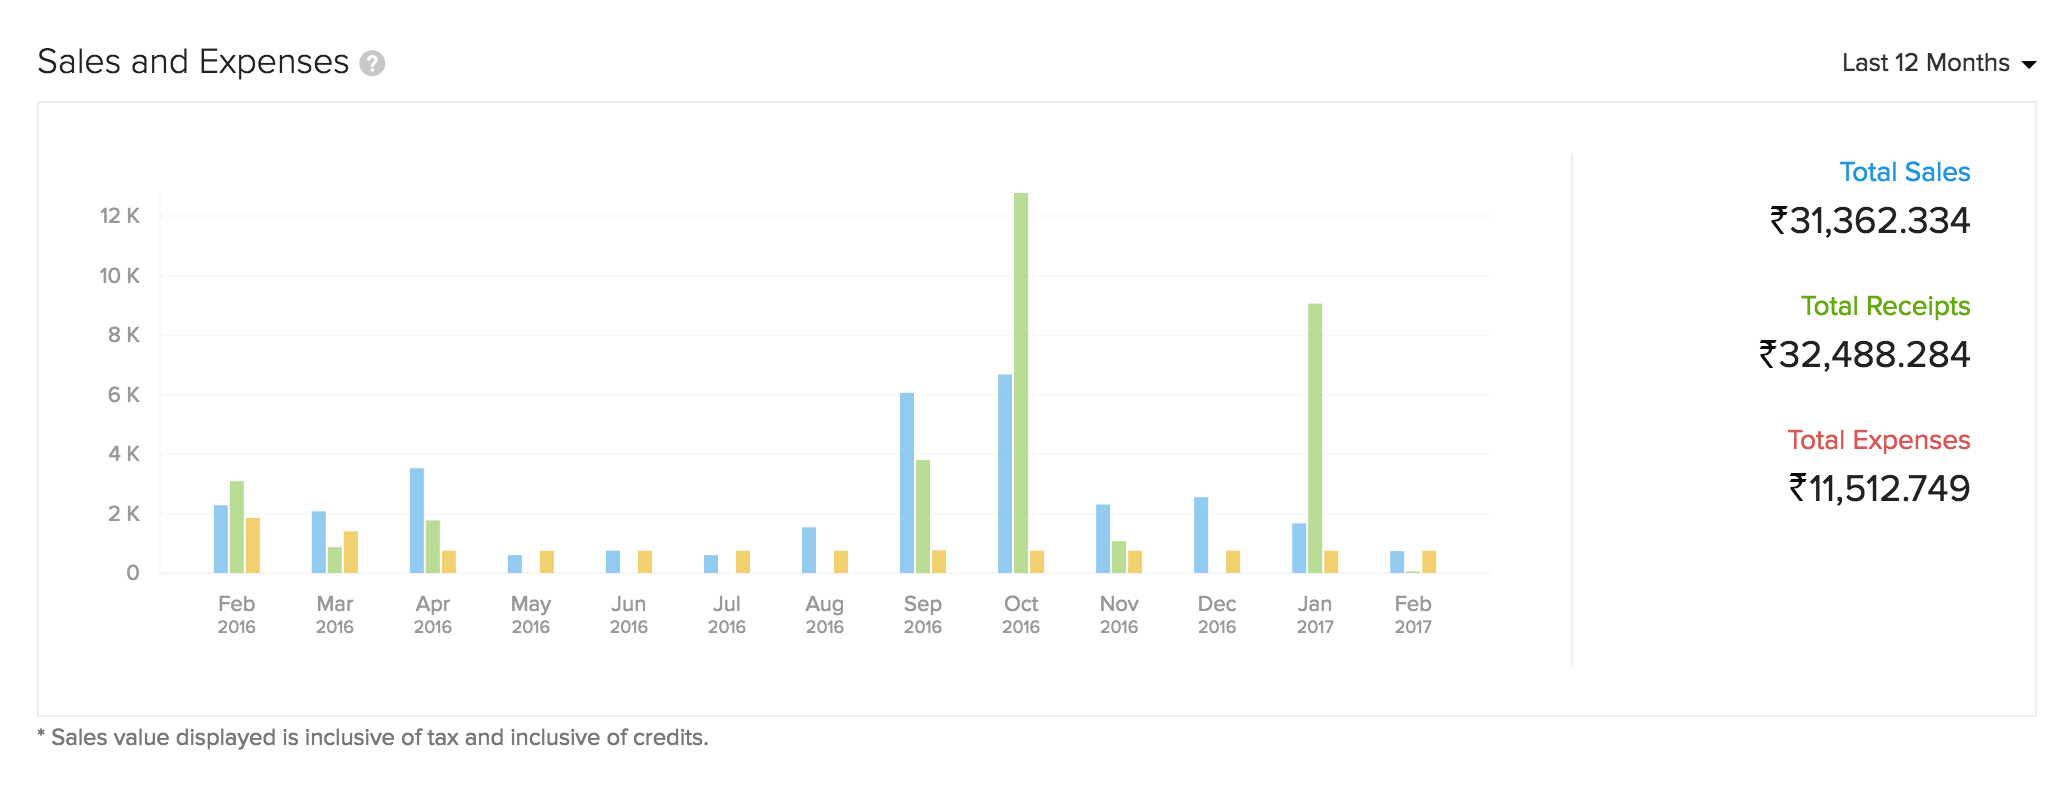
The Sales and Expenses section displays the Total Sales, Total Receipts and Total Expenses of your organization.
- Total Sales: Displays the total sales done till date for the current year. This Sales, includes the total invoice value i.e. it is inclusive of taxes and credits received from the customer. Clicking this will take you to the Sales by Customer report.
- Total Receipts: Displays the amount received from your customers. Clicking this will take you to the Payment Received report.
- Total Expenses: Displays all the costs your business incurred through its operations. Clicking this will redirect you to the Expense Details report.
Projects
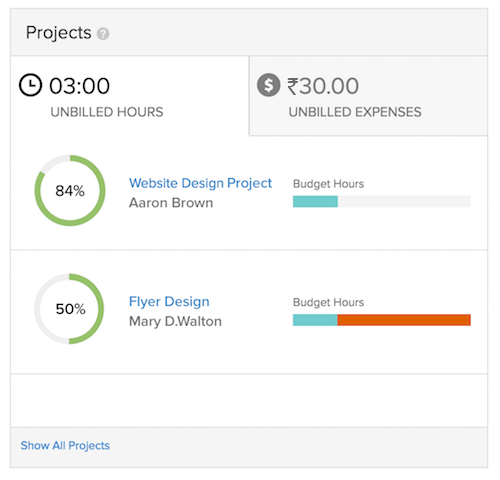
The Projects section displays the following information:
- Project Name
- Client Name
- Number of unbilled hours
- Number of unbilled expenses
Clicking on any one of the projects listed here, will redirect you to the Project Details page in the Timesheet module.
Your Top Expenses
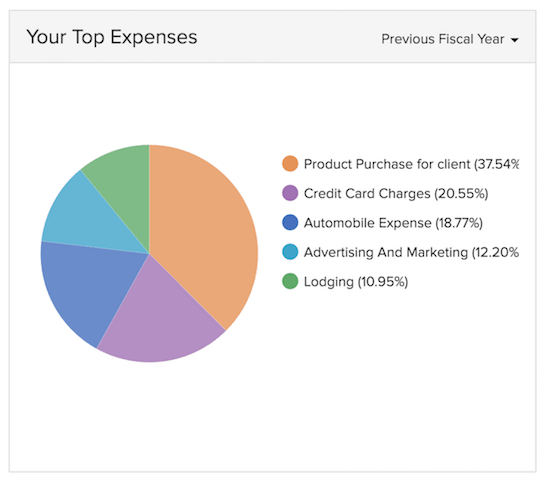
This section displays your top expenses across different categories in the form of a pie chart. This pie chart is auto-generated, based on the Expense by Category report of your organization.
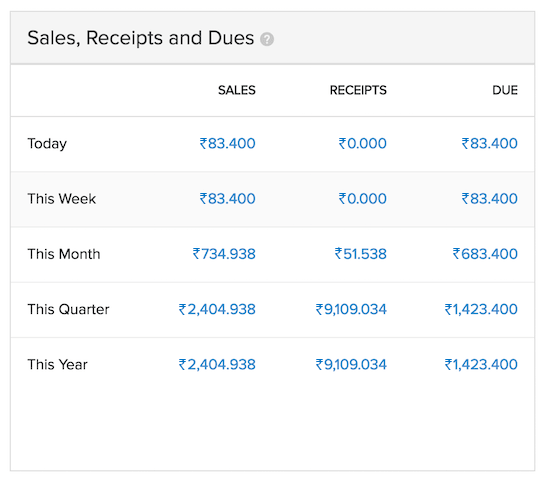
Sales, Receipts, and Dues
This section displays your organization’s sales, receipts, and dues for different time periods.
 Yes
No
Yes
No
Thank you for your feedback!