When Uncle Sam Pays You Back: Tax Refund Statistics for 2015

Infographics| 1 min read
Reading Time: 1 minutes

For some of you, your tax season headache is over for 2014. For those who have received a refund or are expecting one, Uncle Sam is rewarding you for your hard work and dedication.

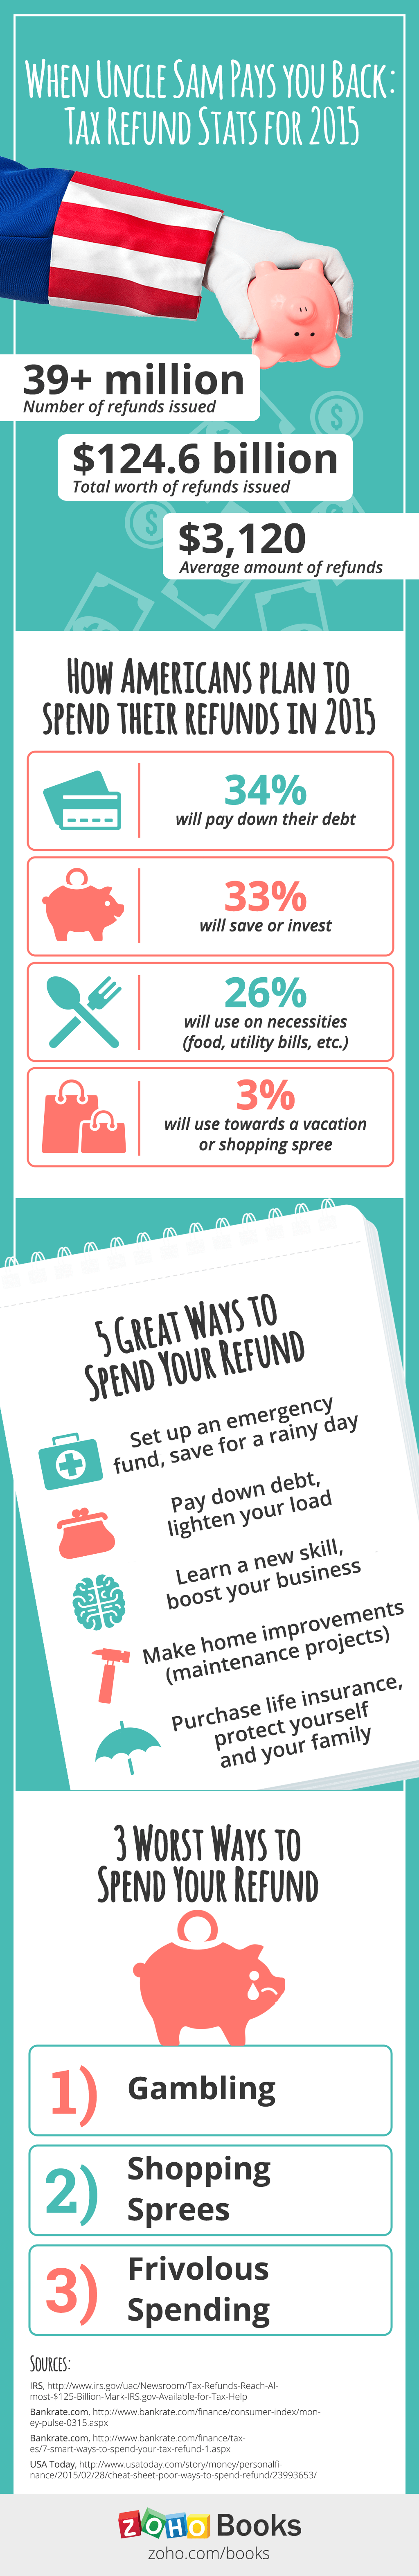
Did you think about what you are going to do with your refund? Are you planning to splurge and take a fancy vacation or simply play it safe by saving and investing?

We’ve put together an infographic of the tax refund statistics of 2015. This infographic covers the total number of refunds issued this year, what Americans plan to do with their refunds and suggests some of the best and worst ways to spend your refund.

When uncle Sam pays you back: Tax refund statistics for 2015 Infographics

Related Posts

None found

This site uses Akismet to reduce spam. Learn how your comment data is processed.

Books

Switch to smart accounting. Try Zoho Books today!

GET STARTED NOW