Working with Reports
How Can I...
You can create reports on any module in Zoho CRM (except Price Books). You can choose what data is included in your report and how it's presented. Once the report is created, it can be manipulated and shared as per your requirements.
Types of Reports
- Tabular Report: In this report, the data from chosen fields in one or more module is represented in columns. Calculation functions can be applied to the data in each column. For example, a report on the number of Leads created in a day.
- Summary Report: In this report, you can group data based on field values in one or more module and also apply calculation functions to column values. For example, a report containing details of Deals won in the current month.
- Matrix Report: In this type of report, you can apply calculation functions to certain field values in your module and see the results both row-wise and column-wise. For example, a report on all the attended, scheduled calls.
Note
The Calculation functions available for use are Sum, Average, Largest Value, and Lowest Value.
Create Reports
Creation of a new report involves the following steps:
- Selection of Module(s)
- Selection of Report Type
- Defining Data & Display options
- Selecting Filter Criteria
- Naming & Saving the Report
Step 1: Selection of Module(s)
Select the main module and the related modules from which the information for the report need to be extracted.
- Click the Reports tab in your application.
- Click Create Report.
- Under Module Information section, do the following:
- Select the main module from the dropdown list.
- Select the affiliated modules from the Related Modules list box.
You can use the fields from the Related Modules list in defining filter criteria, in adding columns in your report, and in selecting columns to apply calculation functions.
- Click Continue.
Step 2: Selection of Report Type
Select the report type you want to work with: Tabular, Summary, or Matrix.
- Under the Report Type section, select one of the following report types:
- Tabular Report
- Summary Report
- Matrix Report
Step 3: Defining Data & Display options
Select the field values in modules that you want to include in your report, the fields based on which grouping of data will be performed, the calculation functions, and more. The options will differ based on the report type chosen (refer the table given below).
- Do the following to select the field value(s) in module(s) to be displayed in your report. From under the Report Representation section, click the Columns tab, then:
- Select the field values from the Available Columns list box. The system will display the column names only for the modules that you have selected.
- Click Add.
- The field value(s) will be added to the Selected Columns list box.
- Use the Up and Down arrow keys to sort the display order of the columns.
- Select the column name and click
 to delete the selected column.
- Click the Groupings tab. Here, you can choose field values in modules based on which you can group information in your report.
- Select the values from the Summarize information by dropdown lists.
- Select Ascending or Descending from the corresponding Sort Order dropdown lists.
- Click the Columns to Total tab.
- Select the required calculation functions (Sum, Average, Lowest Value, Largest Value) for the desired columns.
| Report Type | Column Selection | Groupings | Columns to Total |
| Tabular | Available | Available | |
| Summary | Available | Available | Available |
| Matrix | Available | Available |
Step 4: Selecting Filter Criteria
Choose the conditions based on which you want to fetch data from the module(s).
- From under the Filters section, select the filter criteria for the report. Refer section Use Filter Criteria for more details.
Note
- You can also use a record's Created By and Modified By fields to define criteria.
- You can specify a maximum of 25 criteria in a report.
Step 5: Naming & Saving the Report
Before saving and executing the report, provide a name and description for the report and select a folder to place the report in.
- Under the Basic Information section, do the following:
- Select a folder from the dropdown that you want to save the report in. You can also create a new folder.
- Provide a name and description for the report.
- Click Run or Save.
- When you click Run, a preview of the report will be generated. Until the report is saved, the changes will not be persistent.
- Click Save to store the report in the chosen folder.
Use Filter Criteria
Using the Advanced Filters of Filters section (in both Create and Edit Report), you can define sophisticated filters using logical operators AND/OR.
Example
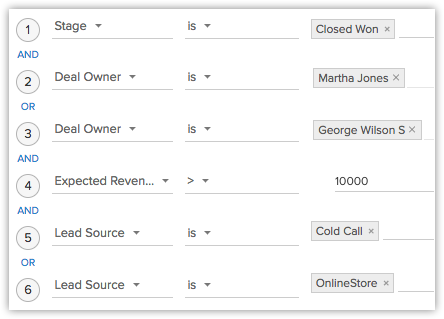
You would like to create a report that lists the potentials based on the following criteria:
Stage is 'Closed Won', and Potential Owner is 'Martha Jones or George Wilson', and Expected Revenue is greater than '$10000 USD', and Lead Source is 'Cold Call or OnlineStore'.
This can be be accomplished using the criteria option, as shown below:
The criteria pattern will be automatically set as:
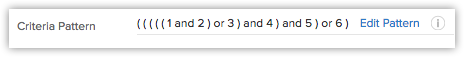
Since the criteria pattern does not match the requirement, you can edit it as:

You can use the following characters in Criteria Pattern:
- Parentheses ()
- and / or operators
- Criteria Row Number
Important Notes
- The operator precedence will not be taken into account if you do not specify brackets. For example, if you specify the criteria as 1 or 2 and 3, it will be considered as ((1 or 2) and 3)
- You can change the and or or of the criteria rows; they will be updated upon saving.
- You can change the and or or condition in the pattern; they will be updated upon saving.
- If you specify 1 and 2 and save it, upon editing the report the pattern will be shown as (1 and 2). For (1 and 2) or 3 the pattern will be shown as ( (1 and 2) or 3 )
- If you add more rows and delete one, there will be additional brackets displayed in the pattern. For example if there are 4 rows added and you delete the 3rd row, the criteria pattern will be as ( ( ( ( 1 and 2 ) ) ) or 3 ). If the first row is deleted then it will be shown as ( ( ( ( 1 ) ) ) or 2 ). However, on saving the criteria, it will change as ( 1 or 2 ).
- Make sure that you do not use the following as they are invalid: (), (and), (or)
- If the brackets do not match, it will be treated as invalid.
- If the number of rows does not match numbers given in the pattern, you will receive an error message. This will also occur if there are any missed numbers in the specified pattern.
- In case the final brackets are missing, there will be a difference in the Criteria Pattern when it is edited and when it is viewed.
Use Last Activity Time in Criteria
All changes made to records are recorded with a timestamp under Last Activity Time. The information in this field can be used in reports Filters, to filter out records that had no activity for a specific period of time or those records that had recent activities.
Note
- 'Last Activity Time' is only supported in the Leads, Accounts, Contacts, and Potentials modules.
- These modules must be selected as either the Main module or one of the Related modules.
- While Last Activity Time captures all updates made to a record, the Last Modified Time will only capture changes made to the fields and does not include changes made to the Notes, Tasks, or Email sections.
- This criteria can be used in all types of reports.
The following activities and updates will be recorded as Last Activity time:
- Editing fields in a record.
- Adding and updating activities, i.e. Tasks, Events, Calls.
- Sending emails to Leads and Contacts.
- Adding and editing Notes.
- Adding Potentials and Contacts under an Account.
- Changing the owner of the record.
- Adding and deleting a record (this does not include deleting a record associated to the parent record).
- Closing a task(not used for Events as they are automatically moved under Closed Activities after the End DateTime)
- Deleting and restoring the records (individually or in bulk).
- Mass operations such as Mass Update, Mass Transfer etc (except for the Mass Delete option).
The following activities and updates will NOT be recorded as Last Activity time:
- Editing contacts or potentials under an account will not be listed under the Account.
- Deleting related lists under a record.
Edit Reports
To make edits to your report:
- In the Reports Home page, hover over the name of a report. Click on the ellipsis (...) sign that appears.
- Choose Edit from the menu.
- Make any desired changes.
- Click Save.
View Reports
To view your report:
- In the Reports Home page, click the report folder link in the left pane.
- Click the required report's link.
- In the Report's View, you can do any of the following:
- Export: Use this option to export and save the report in Excel, PDF, or CSV format.
- Send Email: You can email your reports to internal and external users.
- Edit: You can make changes to the format and contents of the report.
- Duplicate: A copy of the report is created which can be customized as per your needs.
- Create Chart: This feature enables you to create charts (such as Bar diagrams, Pie charts, Line charts) based on the selected report details.
- Hide Details / Show Details: Click Hide Details to hide the details of the report and click Show Details to see the hidden details of the report.
Note
- A maximum of 2000 records will be listed in a page. You can use the navigate options to view others pages.
- You will be able to export up to 2000 records per page in each export.
Delete Reports
To delete reports:
- In the Reports Home page, hover over the name of a report. Click on the ellipsis (...) sign that appears.
- Choose Edit from the menu.
- Click the Delete button. The deleted reports will be available under Recently Deleted.
Note
You can only delete reports that you created.
Add Reports to Dashboard
- Click the Dashboards tab.
- Create a new dashboard or click on an existing dashboard.
- Click Add Component.
- Click Get From Report.
- Select a report.
- Select a chart type and provide a name for the component.
- Click Done.
When you share a report that you have created with other users in your organization, note that all fields in the report will be visible to them, even though some users may not have the permission to view some fields.