Dashboard
The dashboard for Functions helps you view the usage statistics of all your functions.
You can view the total number of function calls you have made and credits consumed by the functions that were executed in the selected time duration.
Note:
Zoho CRM retains the function logs and analytics data for 30 days. Data beyond 30 days are deleted, and hence you can view the analytics data for a maximum of 30 days.
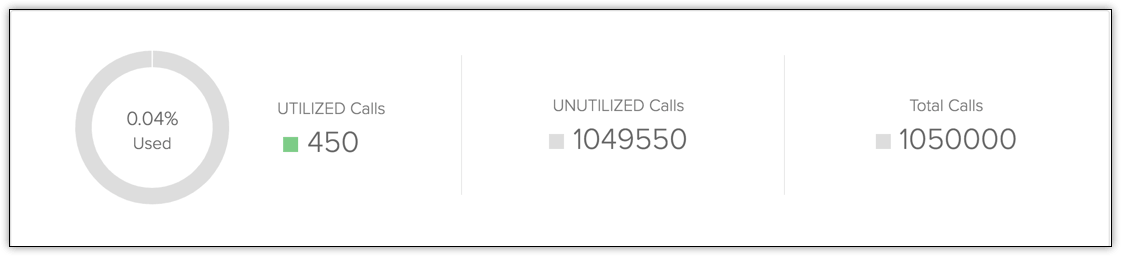
The image below shows the total, utilized, and unutilized calls for your CRM edition. This gives you a snapshot of how much of your credit is being used at any given time, and it aids you in determining your future credit needs.
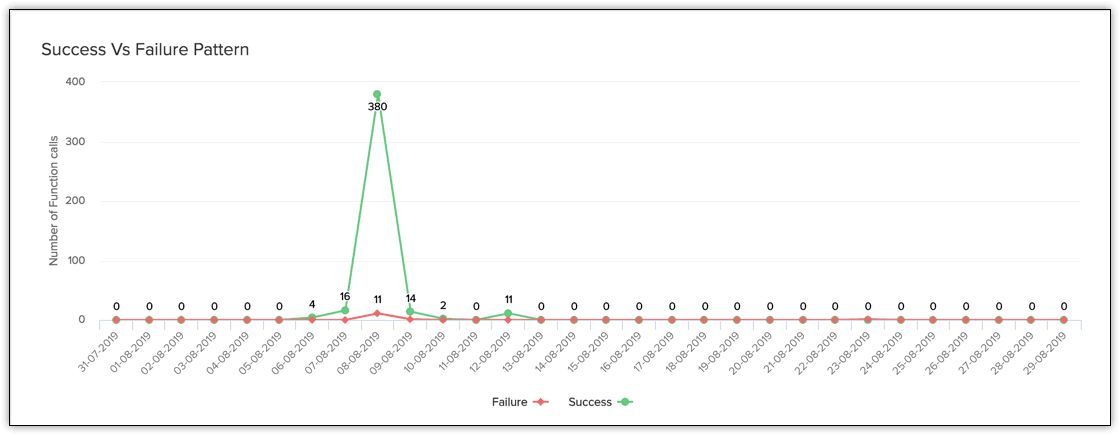
You can also compare the success and failure pattern. This graph displays the number of failed and successful function calls over the specified time period. This, in turn, can aid in function failure analysis and efficiency improvements.
What can you see on the Dashboard?
Function Calls by Language
The number of function calls made by various languages is depicted in this donut chart. For functions, Zoho CRM currently supports three languages: Deluge, Java, and NodeJS. With the help of this chart, you get insights into the most used and least used languages. With this information, one can investigate the least-explored languages and assess the benefits and drawbacks of using them more frequently.

If the additional calls filter is selected from the drop down, the chart will show the function calls made using extra purchased credits by different languages. The credit consumption of function is dependent on the language used. This graph helps you in determining whether exploring your least used languages can help you consume fewer credits.

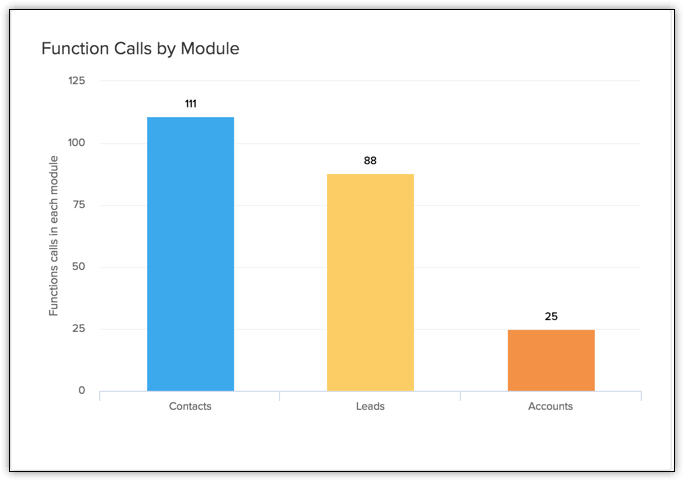
Function Calls by Module
This bar graph depicts the number of function calls made from every module. With this information, you know which modules has the most number of functions associated with them.
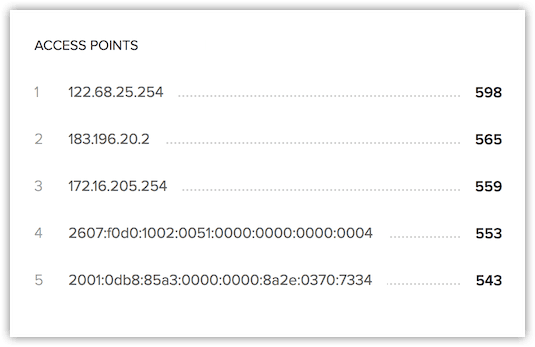
IP Address Based
You can find the statistics based on the User's IP address on the Graph view page. In other words, the stats are displayed based on the Access points of the users. The top five IP Addresses classified based on number of API calls made from them will be displayed.
Overall Success vs Failure
This pie chart depicts the overall success vs failure statistics for the selected time frame. Along with the analytics data and logs, the success-failure pattern aids in failure analysis and, as a result, increases efficiency.

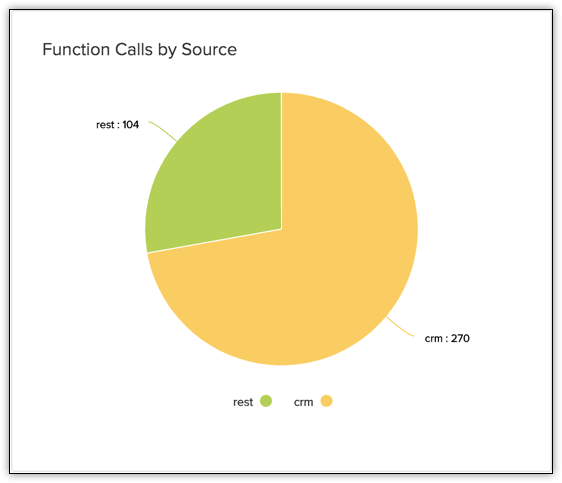
Function Calls by Source
This chart depicts the number of functions executed based on the source of call such as CRM and REST API. The function source is CRM when the function calls are made from CRM associations such as workflows, related lists or buttons. When a customer integrates CRM with another application, the functions are called externally via REST APIs. This provides a complete overview of what significant proportion of function calls come from an external source via REST APIs.
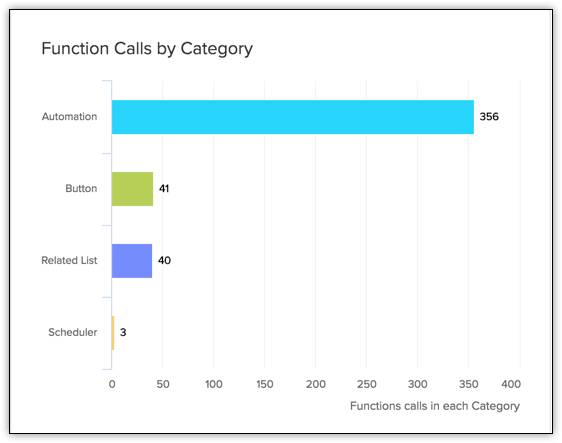
Function Calls by Category
This bar graph depicts the number of function calls made from different categories such as button, automation, REST API, signals, release process, approval process, blueprint and schedules. With insights from the graph, one can explore the less used categories for implementing functions.
Most Executed Functions
This pie chart depicts the frequency of execution of different functions for the selected time frame.

Most Credits Consumed Functions
This pie chart depicts the credit consumed by different functions executed during the selected time frame. Combining this information with the individual function analytics, one can peruse ways for lesser credit consumption.

Most Billed Functions
This pie chart depicts the billed amount for the executed functions during the selected time frame. These are function calls made using additionally purchased credits. The individual function analytics for the functions depicted in this graph gives more insights.