API Dashboard
The new API dashboard features an all new interface to view your usage statistics. The interface is made up of a graph view and a table view. You can classify the stats based on modules, IP address from which the call was made, method, user or time. This dashboard supports the previous version of the API as well as the new version.
The New API Usage statistics:
The first section on the Dashboard tab is API Credits Usage. This section gives you the utilized and unutilized credits in a certain time period, and the number of calls you make on an average every day.

Integration Tasks Consume API Credits
The stats shown on the API Dashboard also include the number of credits consumed by the integration tasks in functions, as well. For more details, refer to this announcement.
The last 24 hours tracking method is practised only from the version 2 APIs.
There would be a 15-minute delay in refreshing the statistics. However, the number of API calls used are updated immediately.
Statistics of API Usage older than 30 days will be deleted periodically.
The usage statistics helps you keep track of the number of API calls that you have made in order to plan how to use the CRM in the most effective way. The statistics for the V3 APIs are classified in the following ways.
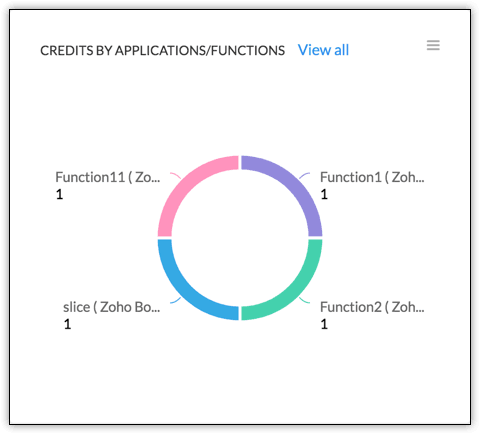
Application based:
The new API relies on making API calls from specific applications. Hence, the classification based on what application the call was made from would make more sense than classifying them based on the method of the API call.
Graph view:
A doughnut chart is used to represent the top 5 applications for which APIs were called. This chart also displays the function names that have used integration tasks, and the number of credits these integration tasks have consumed.
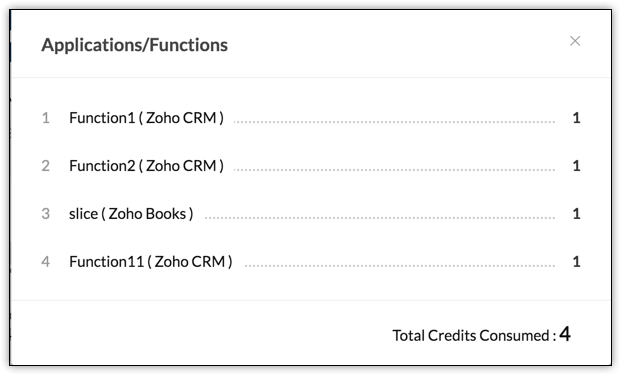
Click any of the application name to open the statistics for that application in Table view.
When you click a function's name on the chart, it opens the stats in table view such as the number of integration tasks used in that function, the module the API calls are made to, and the number of credits consumed.
You can also click the List view icon to view the five most used applications in the list format.
Table view:
The applications column is set as the default column and the rest of the information are arranged accordingly.

Module based:
You can view usage statistics based on API calls from modules.
Graph view:
Only the top 5 modules are displayed in the Graph view. Click on any of the module's name to open the stats in table view with the default column as "Module".
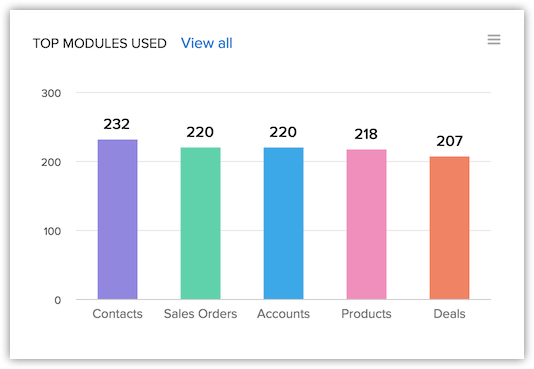
Click the list view button to view, the top 5 methods from which the API calls are made, can be viewed as a list.

Click View all to view the statistics of all the modules.
Table view:
The table view is even more precise as it displays all the information regarding the module in one go.
Click Sort order to sort the table in the required view.
Hover the pointer to the information and you can see the connection between the records.
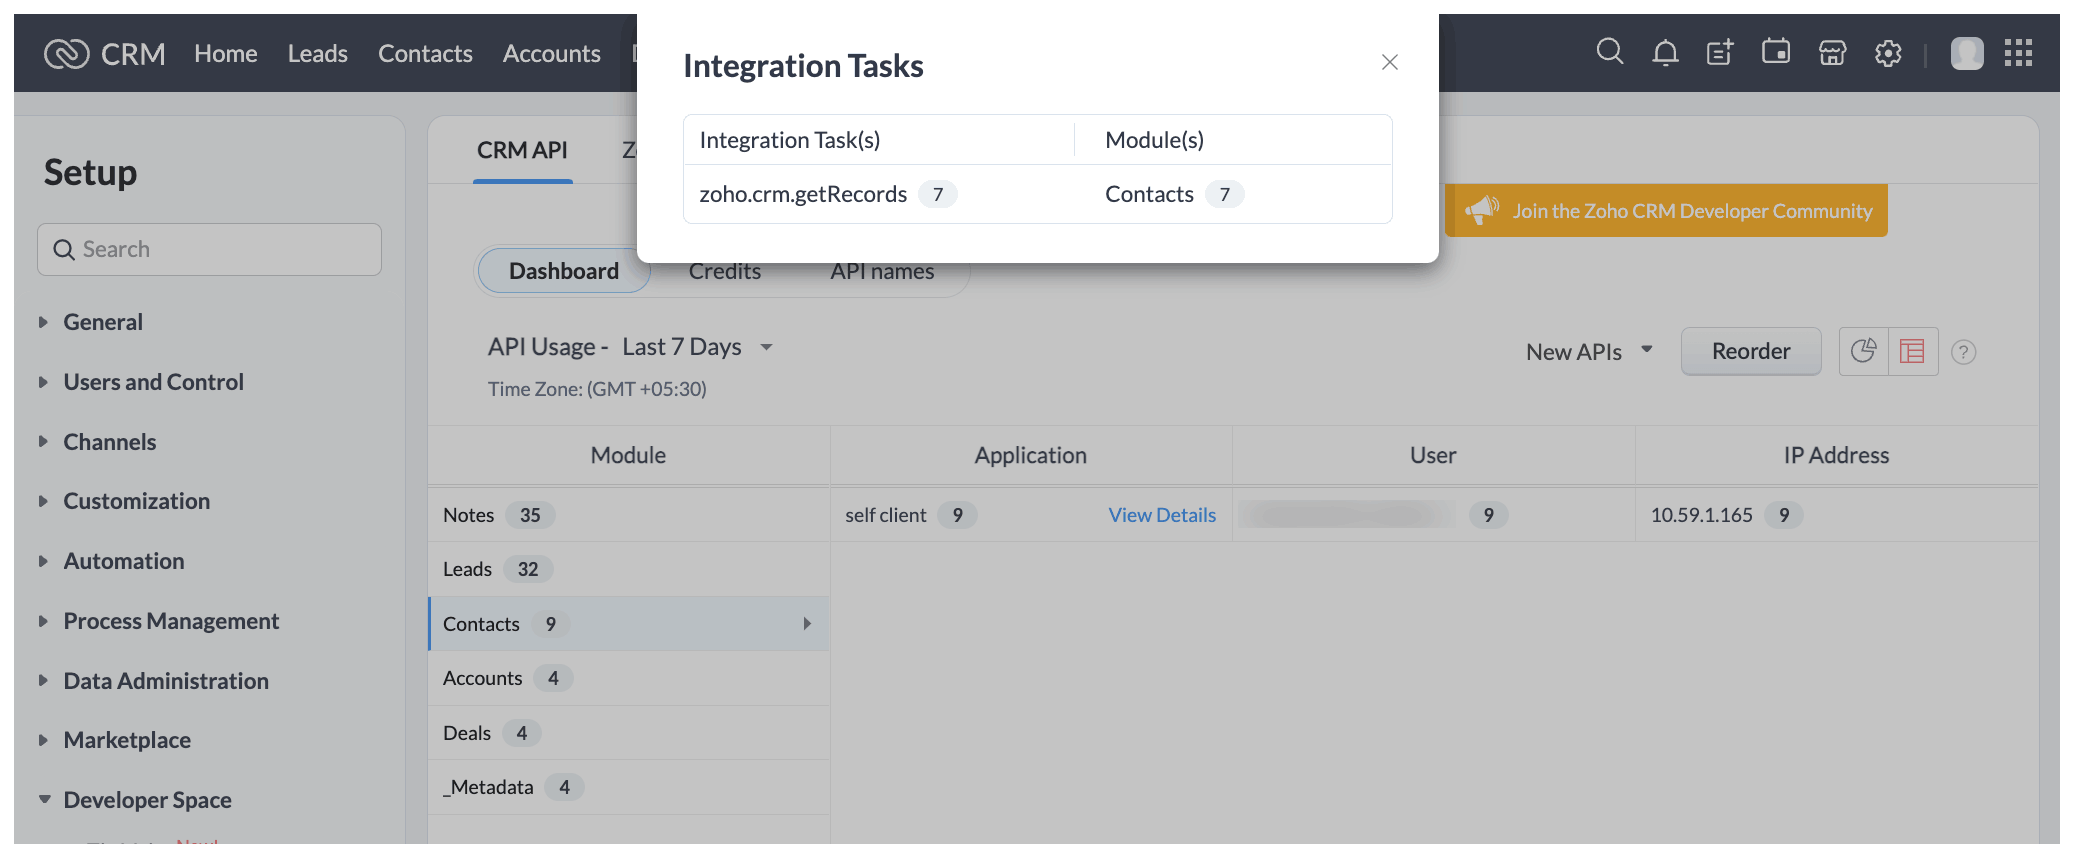
When you click View Details, a pop-up displays the credits consumed by the integration tasks in that module.
IP Address based:
List view:
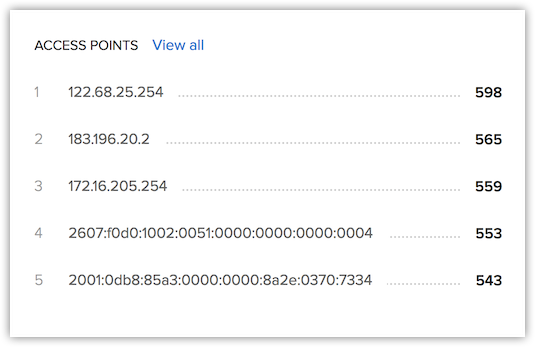
You can find the statistics based on the User's IP address in the Graph view page. In other words, the stats are displayed based on the Access points of the Users. The Top 5 IP Addresses classified based on number of API calls made from them, will be displayed. To view all of the User IP addresses, click View all.
Click any of the IP addresses to open the Table view with IP address as the default column.
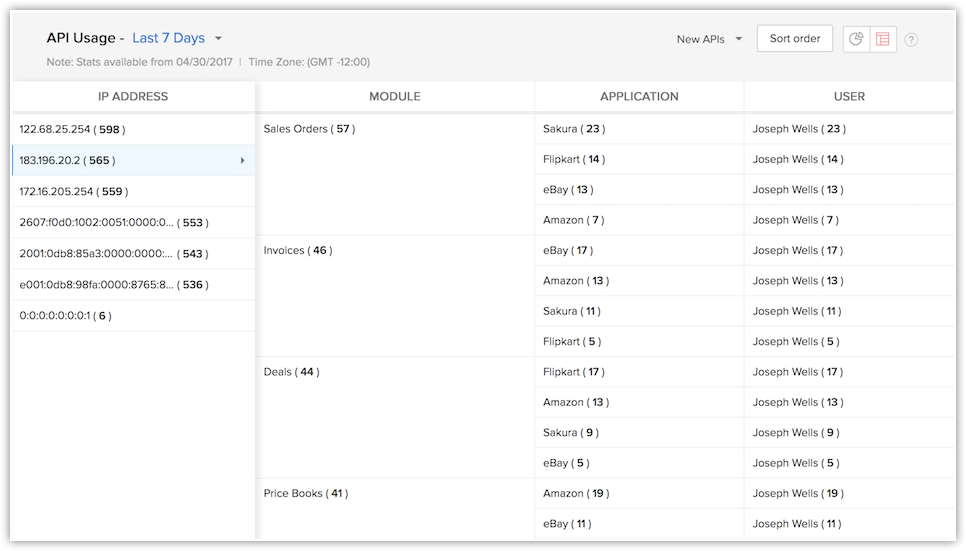
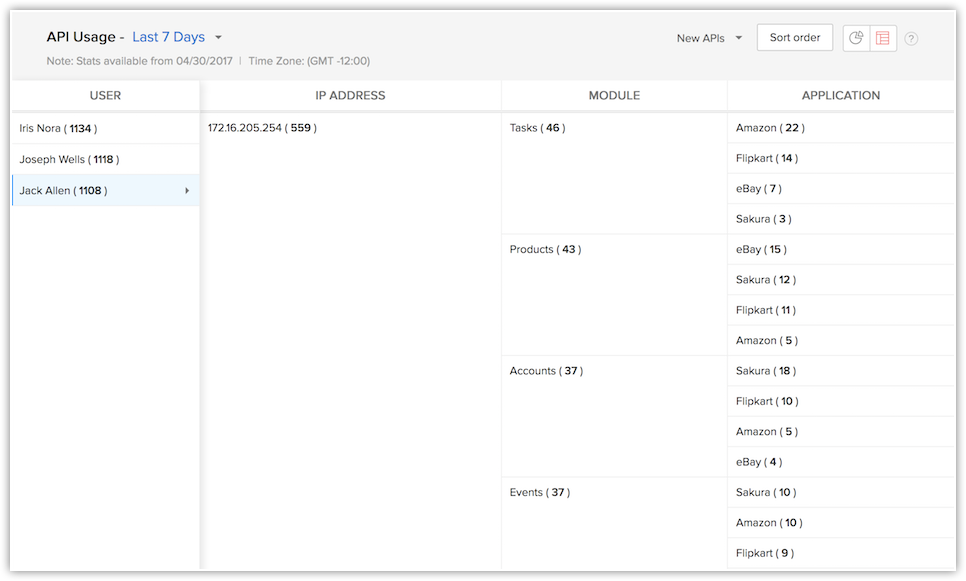
Table view:
In the table view, the IP address column is set as default and the rest of the information is arranged based on it.
User based:
You can view the usage based on who made the API calls in the Prolific API Users section.
Graph view:
The top three users who made the most API calls are listed in this section.
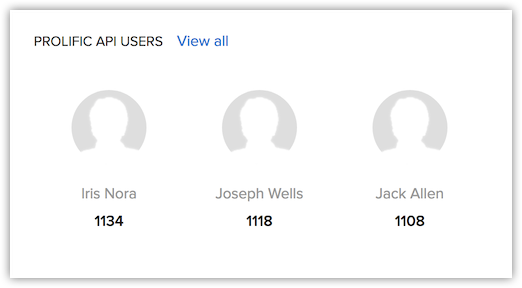
Click View all, to view the number of API calls made by all individual users.
Table view:
The IP address, method and the module used by a User can be viewed by setting the User column as the default column in the Table view. However, refreshing the page resets the view.
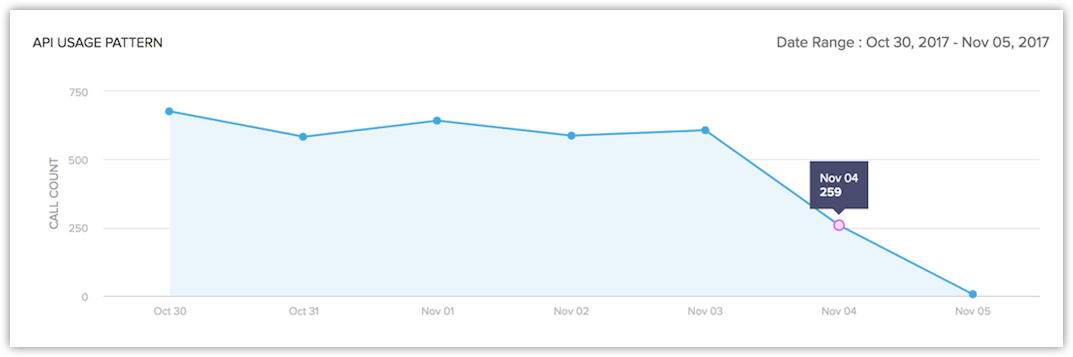
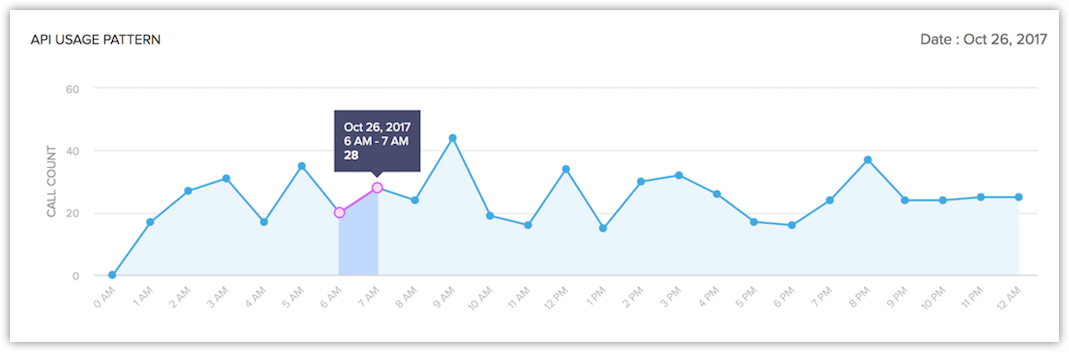
Time based:
One of the easier ways to know your usage and limits would be to take account of the time in which the API calls are made. This is available only in the graph view.
The graph displaying stats in a single day:
The graph displaying stats for a range of dates: