Optimize your store based on where your visitors touch

Boost your online store's performance with the Zoho Commerce and Zoho PageSense integration. Understand visitor behavior, run experiments, and personalize experiences from one unified platform.

Zoho Commerce and Zoho PageSense integration dashboard

Why integrate
Zoho Commerce with PageSense?

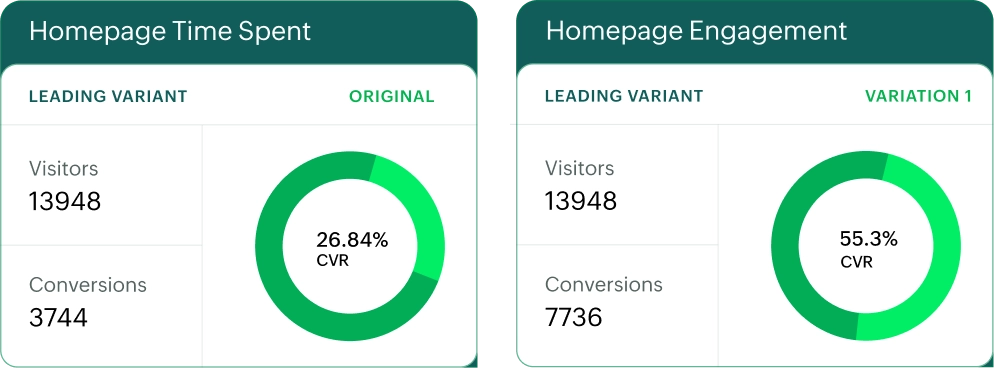
A/B testing for data-driven decisions

Challenge

Making website changes based on assumptions can lead to ineffective updates and missed opportunities to truly understand what resonates with your audience.

Solution

The integration allows for seamless A/B testing directly on your Zoho Commerce store, enabling your business to scientifically test variations and gather concrete data on audience behavior to make informed decisions.

A/B testing insights with Zoho PageSense

Personalized website experiences

Challenge

Delivering a generic experience to all visitors often fails to capture individual preferences, resulting in lower engagement and conversions.

Solution

Create personalized website variations that dynamically adapt to different audience segments, ensuring visitors see the most relevant content and offers, thereby enhancing engagement and conversion rates.

Personalized website experiences in PageSense

Optimize with heat maps

Challenge

It's difficult to get a complete picture of how visitors interact with different elements on a page, including where they click, hover, or focus their attention.

Solution

Use heatmap analytics to visualize user interaction patterns across your pages. Heat maps highlight areas of high and low engagement, showing clicks, movement, and attention zones, so you can optimize button placement, improve link visibility, and enhance overall user experience.

Heat map analytics in Zoho PageSense

Funnel drop-off analysis

Challenge

Losing potential customers during the buying process without understanding the exact points of abandonment can be a significant barrier to sales growth.

Solution

Create and analyze funnel experiments to pinpoint precisely where visitors are dropping off in their journey. This clarity allows businesses to identify friction points and implement targeted improvements to enhance conversion paths.

Funnel drop-off analysis in PageSense

Scroll map visualizations

Challenge

It can be difficult to clearly understand how far visitors scroll and which sections of a page actually capture their attention, especially across longer product pages and storefronts.

Solution

Leverage scroll map analytics to track how far users scroll and where engagement drops off. It provides a visual representation of scroll depth, helping identify which sections are most viewed and which are often missed, so you can optimize content placement and improve overall page performance.

Scroll map visualizations in PageSense

Frequently asked questions

  • It helps you understand visitor behavior, run experiments, and personalize experiences, all in one platform to improve conversions.
  • A/B testing lets you compare different page versions to see what works best, so you can make data-driven decisions that boost performance.
  • A scroll map tracks how far users scroll on a page and highlights which sections are viewed most. This helps you place important content where it's more likely to be seen.
  • Heat maps show where users click, scroll, and focus, helping you optimize layouts, buttons, and key content areas.
  • It identifies where visitors drop off in the buying journey, allowing you to fix issues and improve your conversion flow.