Canvas for Zoho CRM
Implementation for Zylker Diagnostics
Zylker Diagnostics Ltd is an IVD company based in India.
- Requirement
- Solution
- Instructions
The Context
Zylker Diagnostics Ltd is an IVD company based in India. They use Zoho CRM to maintain a database of the various equipment models, their customers and suppliers. While they can easily keep a tab on key details such as contact information about their customers, the products they are interested in, budget etc., through the contact detail page, they still face the following challenges:
Difficulty in getting the complete picture AKA 360 degree view
Zylker Diagnostics being a manufacturer of healthcare equipment, their agents are trained to identify a product quickly by looking at it. When the default design does list associated products, it is not quite easy for the agent to understand which product by looking at the Model number. They tend to navigate to the product page to catch the product image to gain an understanding of which exact product the customers are interested in. This navigation back and forth is tiring and gets increasingly difficult for the Zylker agents.
Scanning for important information— a time consuming errand
The default contact detail page has a rigid and conventional design. While it does present all fields and sections, sometimes key details are hidden away in the maze of rows and columns, that it becomes difficult to obtain them when they are most needed. For instance, the deal amount, the name of the agent overseeing the deal, the product models— these need to be quick takeaways from the page.
Also, specifically for users of Zylker Diagnostics, they need to immediately identify the enquiry status of the customer. If the date of enquiry falls within the current month, it means it's a hot lead and they should start pursuing it. If enquiry date falls on a date anytime before the current month, say the previous month, then it's considered a cold lead and may be taken up later. The Zylker agents are having a tough time finding the enquiry date and assessing and updating the lead is warm or cold.
Data organization and conditional styling via Canvas
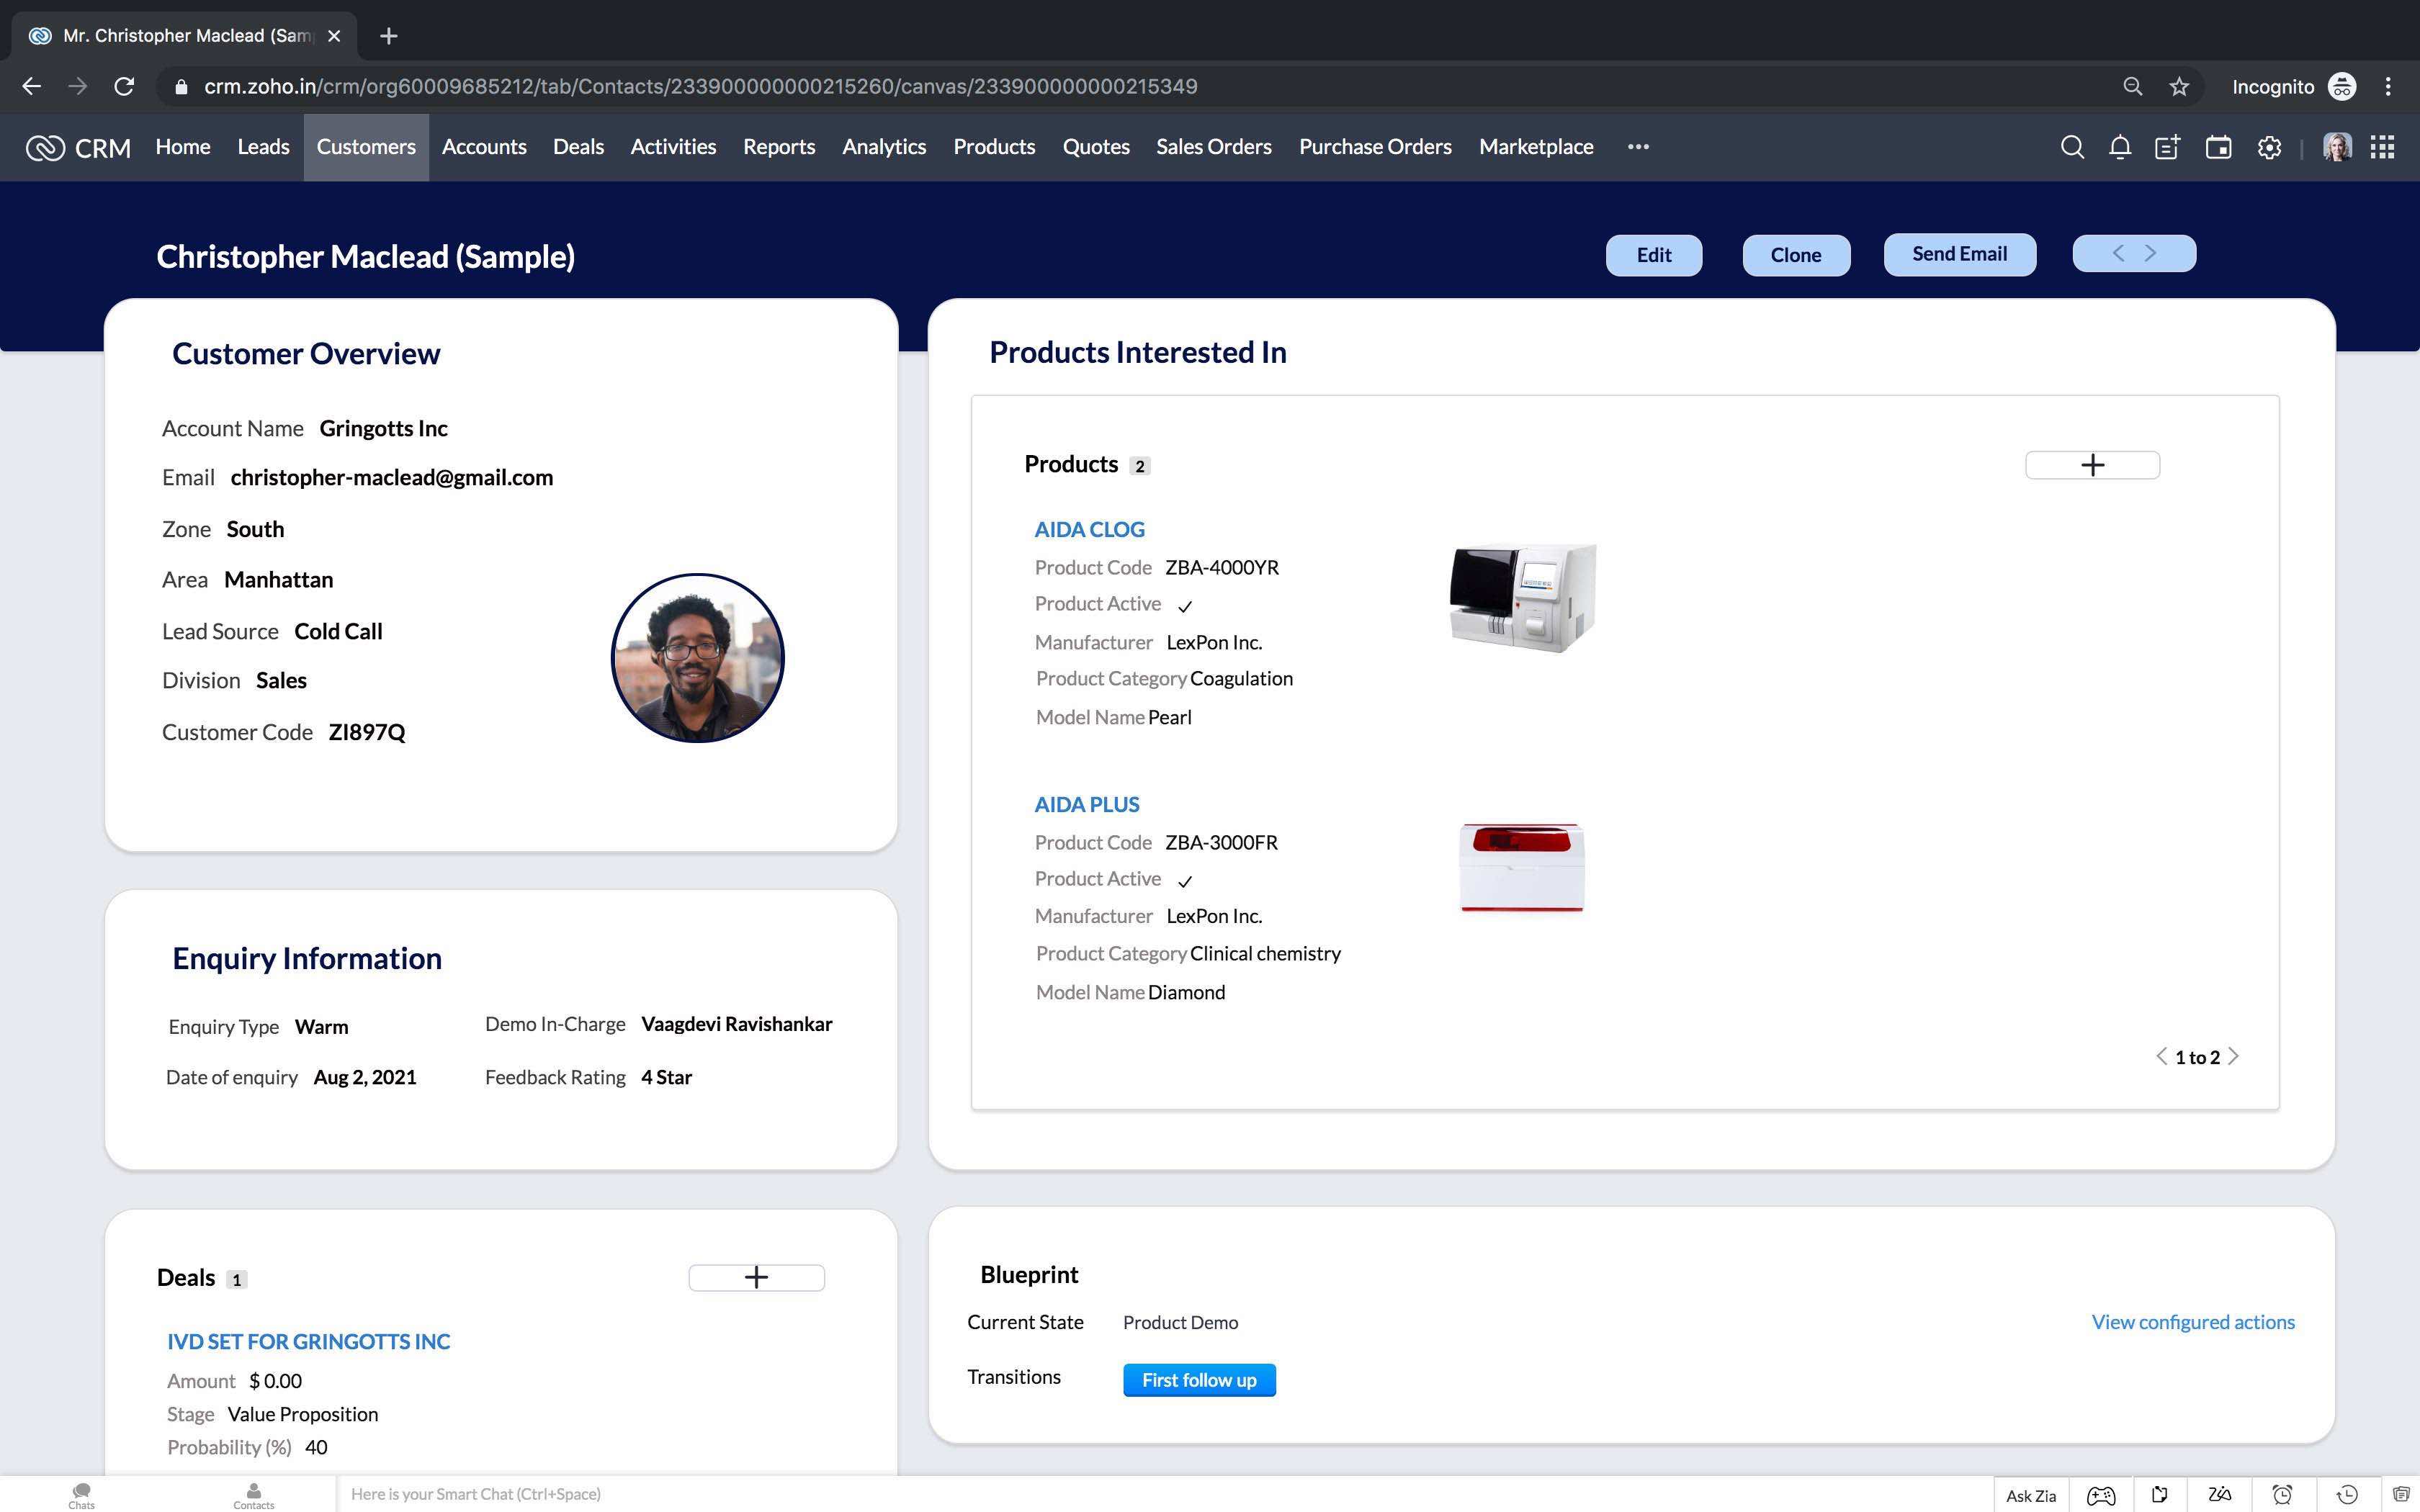
Zylker Diagnostics could utilize the power of Canvas to redesign the user interface of the customer record in such a way that they get a complete 360 degree view of the customer's contact details, requirements, products interested etc. Following are important results achieved via the Canvas view.
- Product images are contextually added so that agents do not have to navigate to multiple pages in CRM.
- Data components have been reorganized to draw focus on key information such as deal amount, staff responsible, product details.
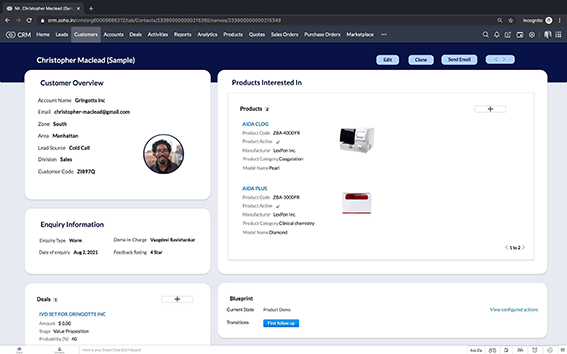
- In addition to this, dynamic styling has been applied, in which the color of the Enquiry Status changes depending on the date of enquiry.
360 degree view of customer data and conditional styling with Canvas
As a solution to the challenges of Zylker Diagnostics, Canvas can be used to achieve a 360 degree view of customer data as well as conditional styling to identify and prioritize key information.
1) Achieving 360 degree view of customer data using Canvas
To create a Canvas layout,
- Go to Setup > Customization > Canvas Builder.
- Click Create Record Detail Page.
- Select the desired module and layout.
In this case, the Clients module and Standard layout, respectively. - Click Create.
- In the Select a template from the gallery popup, choose Blank Template. The empty Canvas Builder opens up where you can create your page from scratch.
For this Canvas Layout, the design plan is for the page to be separated into five major parts:
- Part #1 — Customer Overview section on the left
- Part #2 — Enquiry Information right below the customer overview.
- Part #3 — Products Related List on the right, along with applicable Action Buttons on the header.
- Part #4 — Deals and Blueprint components below these sections.
- Part #5 — Related Lists and All Fields as Tabs.
Part 1 — Customer Overview section on the left
- First, drag and drop a section.
- Resize it to form a rectangular header across the width of the page and fill it with a background color: (HEX #061347).
- Drag and drop another section and resize it to appear like a square.
- This is the Customer Overview section.
- Drag and drop the following fields into this section and position them in a desired manner.
- Customer Name
- Account Name
- Zone Area
- Lead Source
- Division
- Customer Code
- Client image
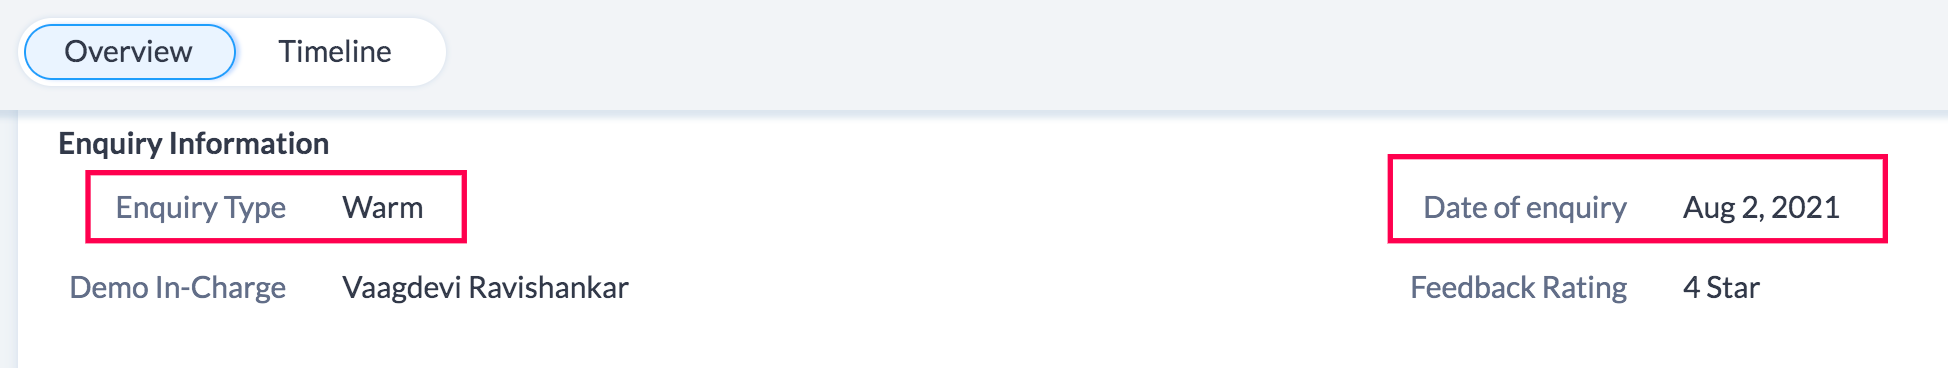
Part 2 - Enquiry Information
- Drag and drop a section and resize it to fit right below the Overview section.
- This is the Enquiry section.
- Drag and drop the following fields into this section and position them in a desired manner.
- Enquiry type. In this example the enquiry type has been designed using the text components and not fields — to achieve a stylized look.
- Date of enquiry
- Feedback rating
Part 3 -Products Related List
- Drag and drop the Products related list on to the right of the Customer Overview and resize it to fit the page well.
- To customize the related list, start by clicking inside the RL component. This will bring up Products-based data on the left panel.
- Now drag and drop the following fields and align them on the page as seen fit.
- Product Name
- Product Code
- Product Active (Checkbox)
- Manufacturer
- Product Category
- Model Name
Part 4 - Deals and Blueprint components
- Drag and drop the Deals related list right below the Enquiry Information section.
- Drag and drop the Blueprint component and position it to the right of the Deals section.
Part 5 — Related Lists and All Fields as Tabs.
As the final component, drag and drop the Tab element. Add all other related lists such as Notes, Attachments, Activities, Quotes, Sales Orders, Emails, Timeline, All Fields and other sections as applicable.
Apply styling options for each component as seen fit, to change the color, background, padding, shadow and other settings.
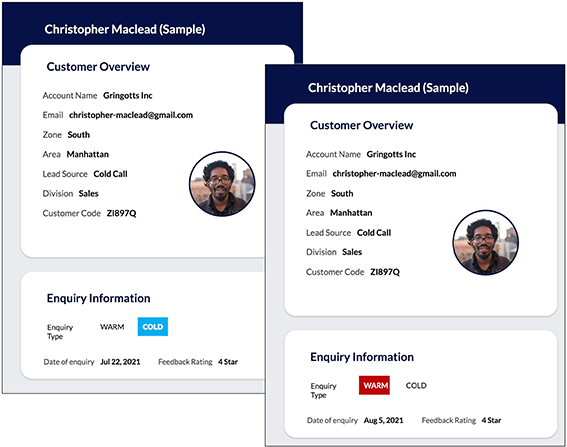
2) Achieving conditional styling of components using Canvas
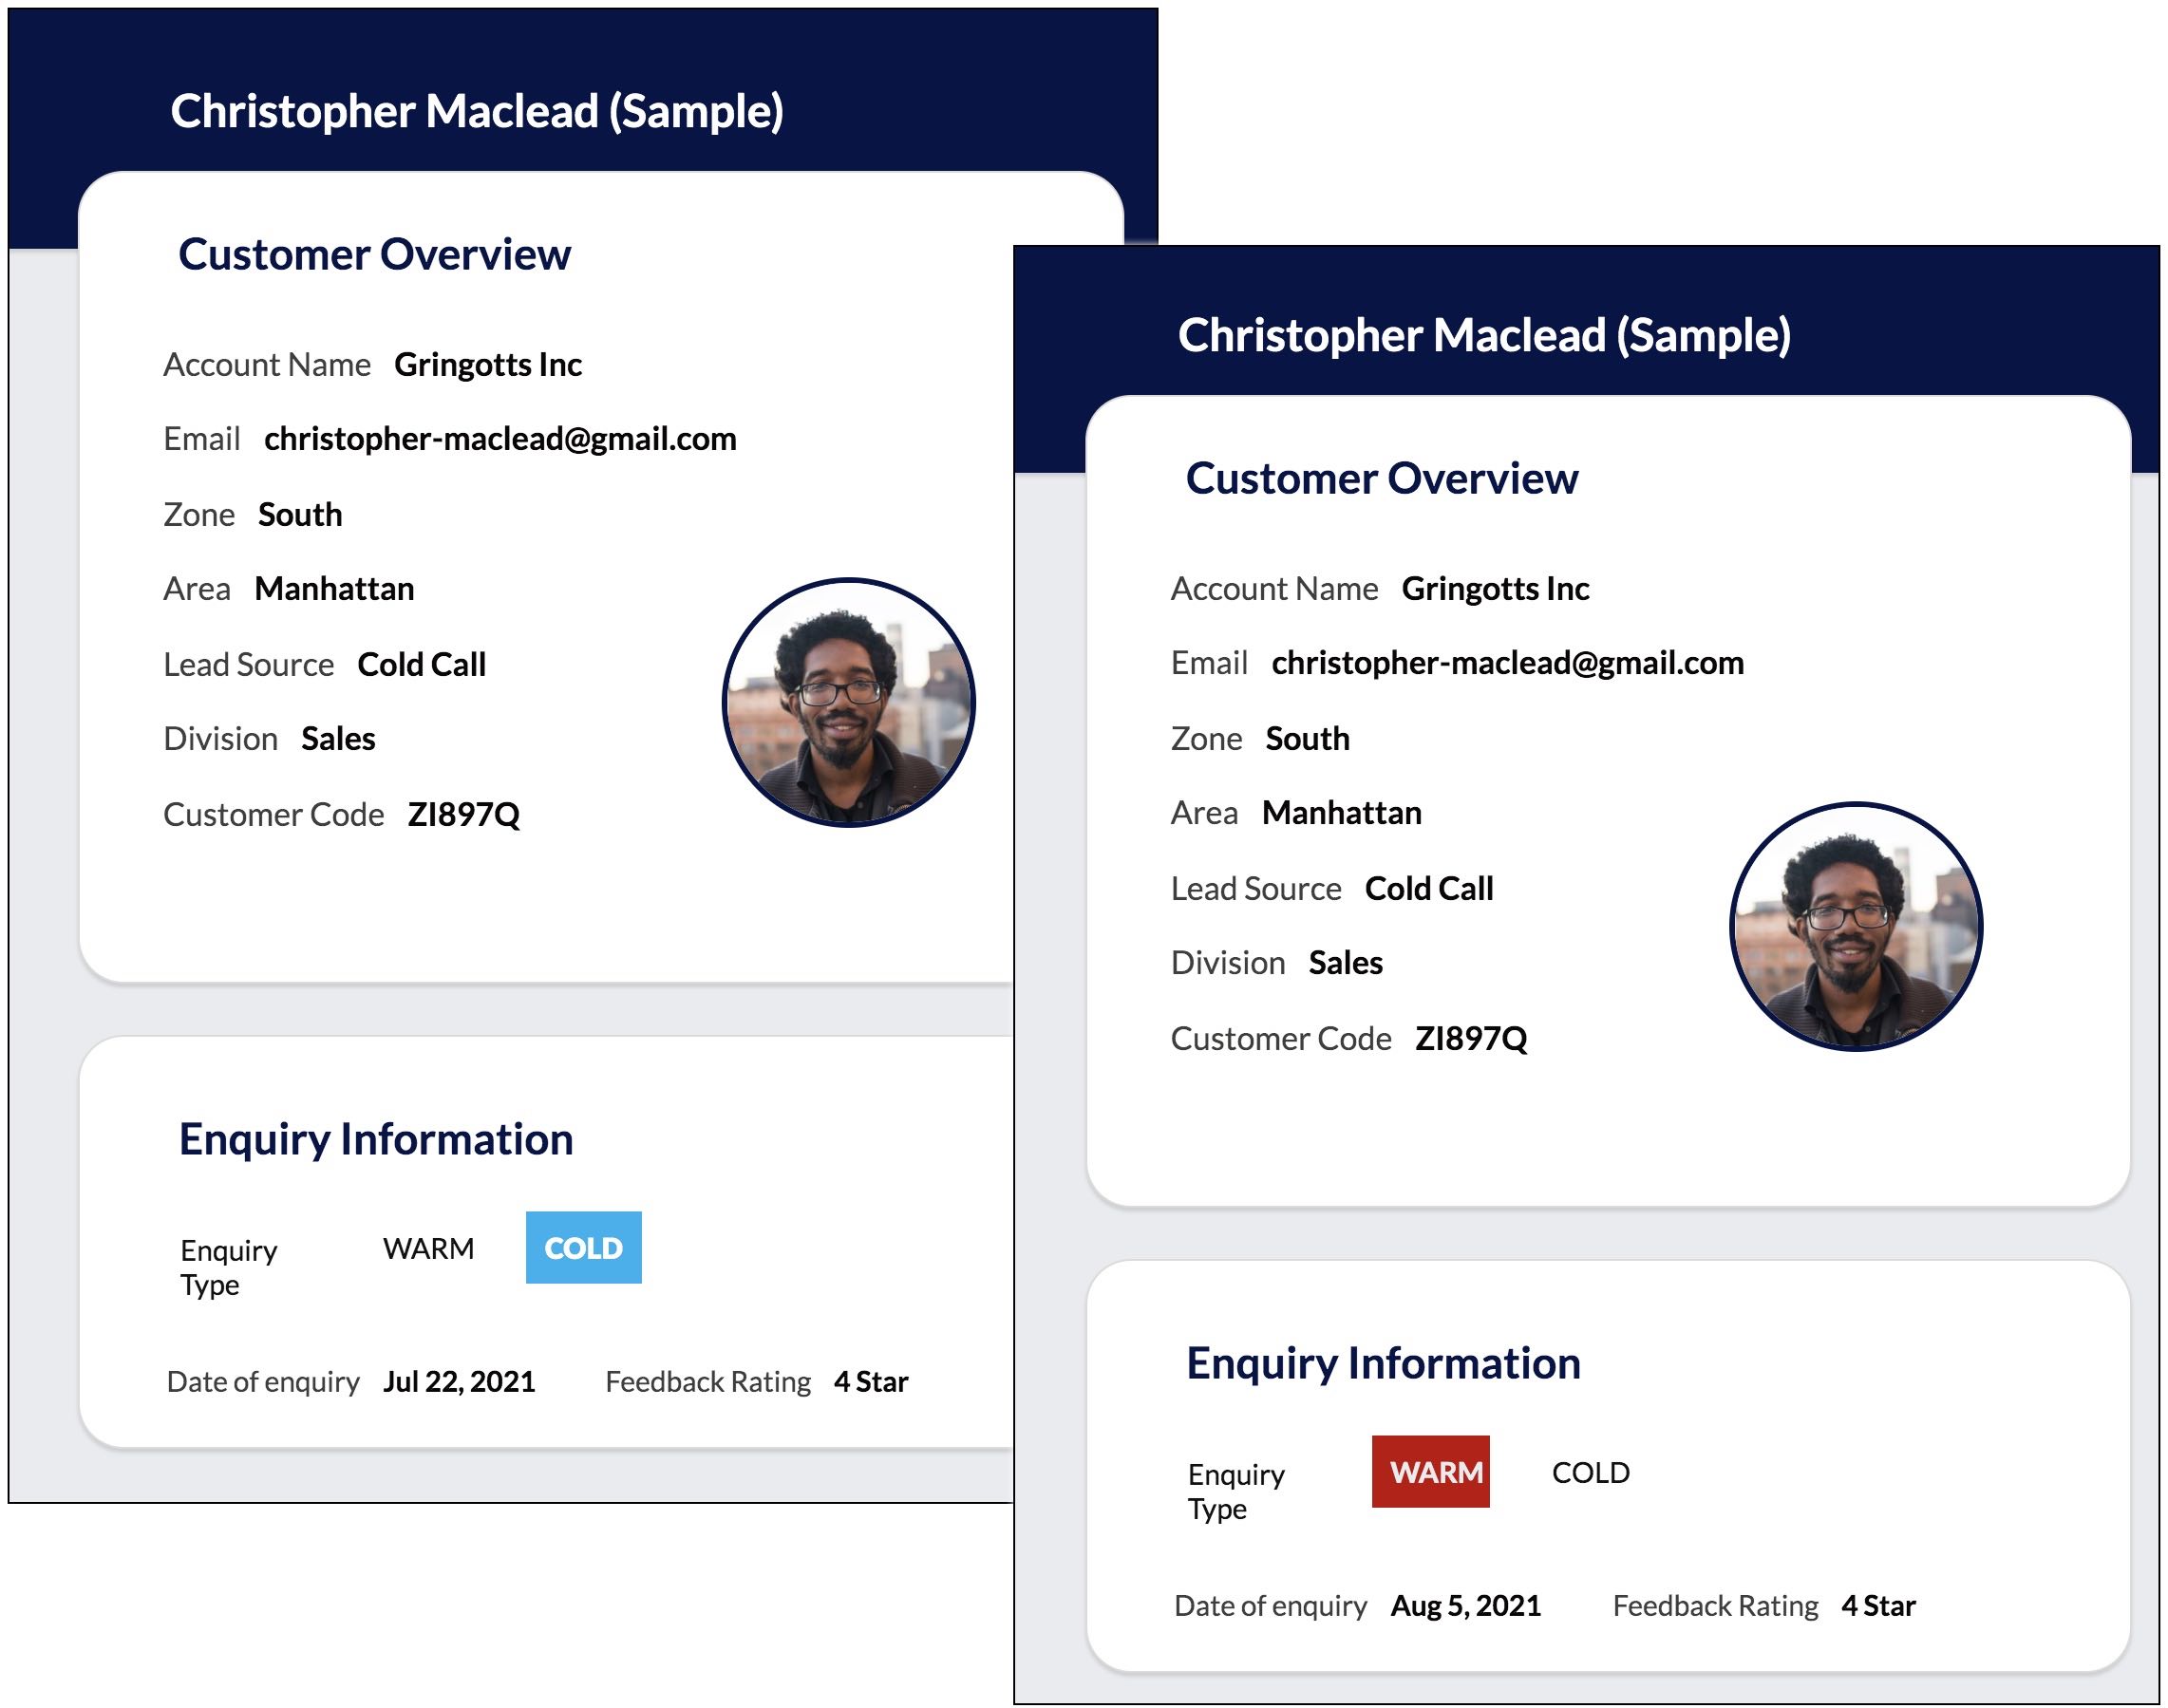
In the Zylker Diagnostics context, the challenge with data-heavy pages for the teams is to identify warm leads.
Consider this scenario. Typically, if the "Date of enquiry" of a lead falls within the ongoing month, it is considered a "Warm lead" and is given top priority. It's time consuming for the teams to browse through the sections to find the date and decide whether the lead is warm or cold. Using conditional styling in Canvas, the styling of the component "Warm" can be changed based on the date of enquiry. A red highlight over it can be applied when date of enquiry falls within the ongoing month. If not, there's no styling.This way, the system will automatically highlight warm leads for Zylker to make things easier for them.
To add conditional styling settings:
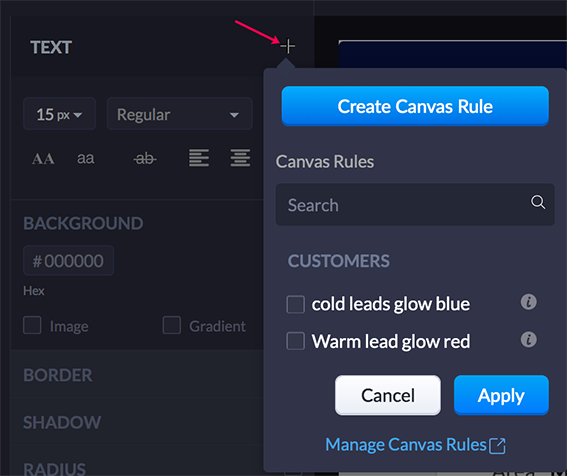
- Click on the required data component for which the style should be changed.
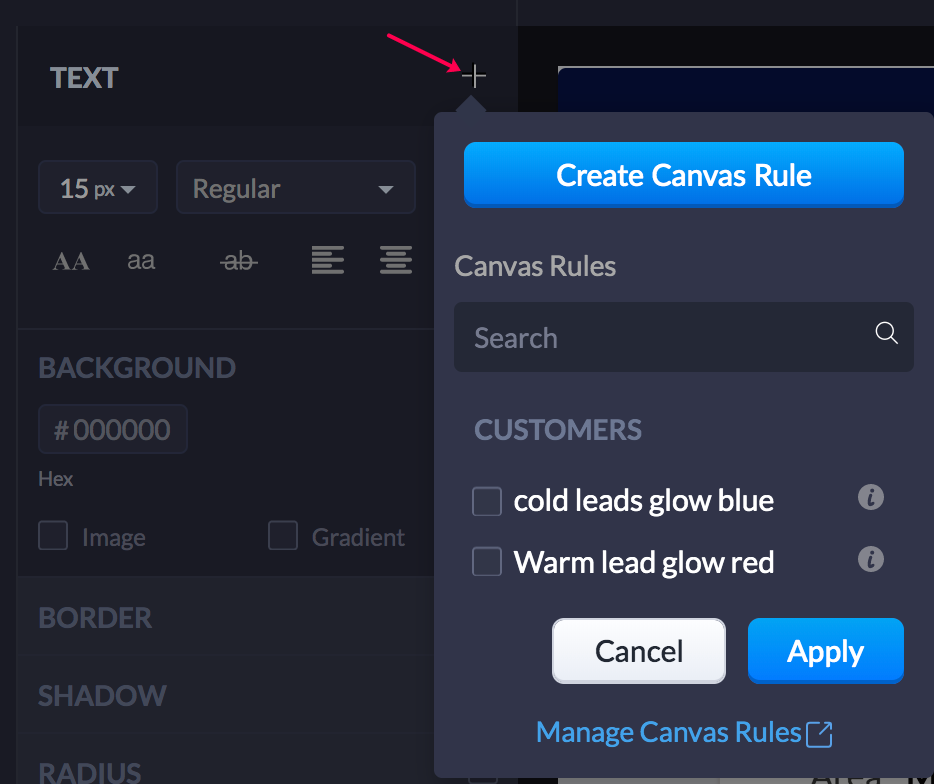
- Click the + icon adjacent to the corresponding component name on the left panel.
In this case, TEXT. - Click Create Canvas Rule.
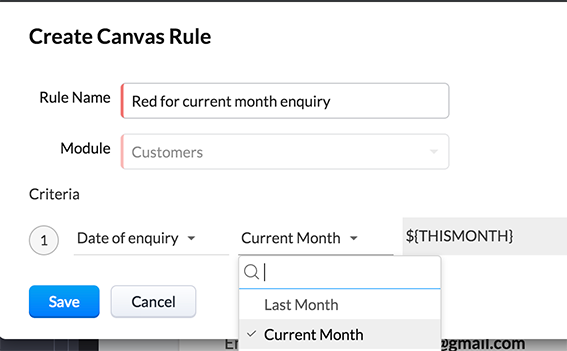
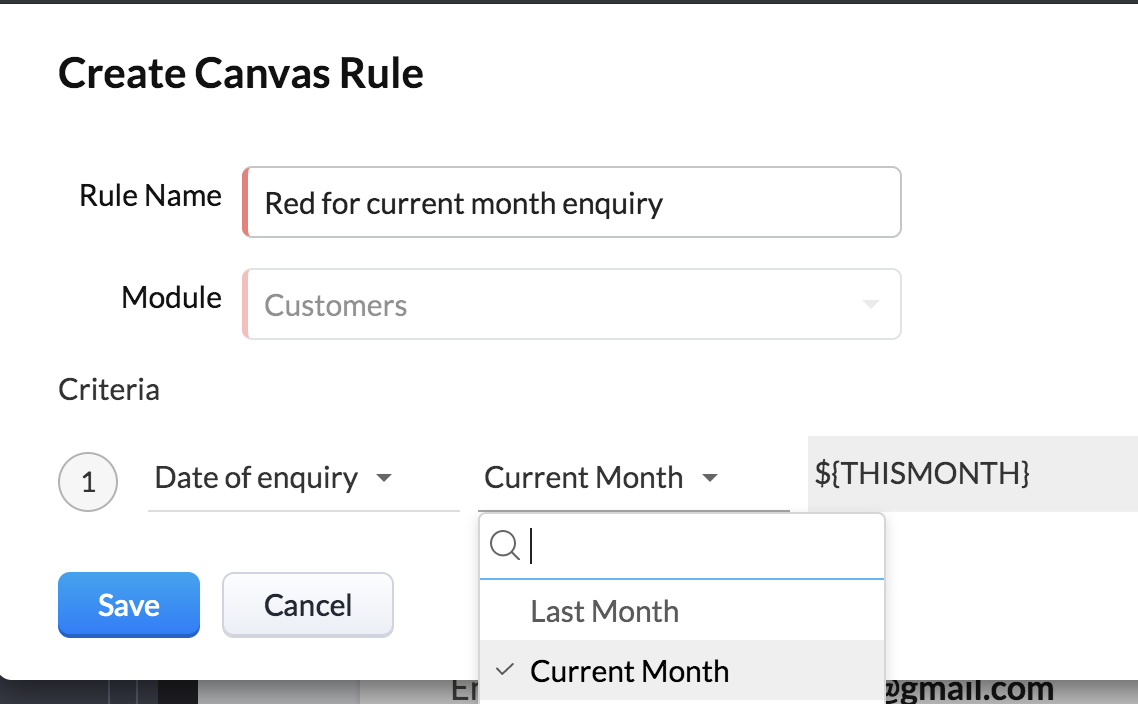
- Enter a rule name: For ex: Red for current month enquiry
- Set the criteria for the rule: Date of enquiry within Current Month.
- Click Save.
- Click Apply.
- Right away, without selecting any other component, choose the styling option for that component.
For example, background color of red. The selected style will be applied only when the criteria configured is fulfilled. Otherwise, by default, there's no styling.
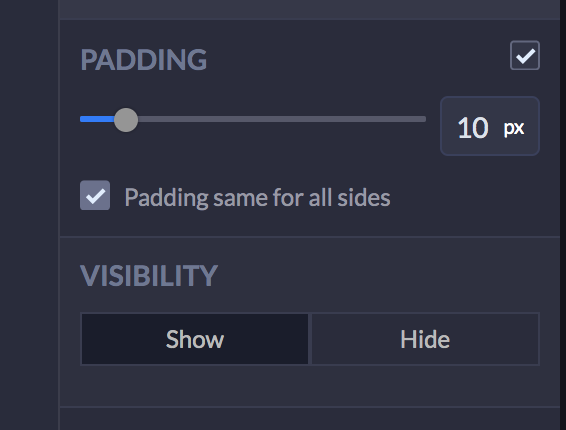
This is how you achieve conditional styling. You can also set the visibility of components based on conditions by selecting Show/Hide options under the Visibility section for a component.
So this is how conditional styling and visibility is achieved. Therefore, Zylker's need for 360 degree view of data and ease of identifying key details have been addressed using the Canvas views.