
Trips Analytics
The reports under this category can be used to analyze the business trips undertaken during a specified period.
Note: Users in custom roles can perform actions and access modules only based on the permissions enabled for them.
To view the Trips analytics:
- Go to Analytics on the left sidebar.
- Click Trips under Analytics Category.
Trip Details
View a complete summary of the business trips undertaken during a given period. Details regarding the travel type, trip status, destination city, destination country, user who created the trip, approver of the trip, and the budget amount will be listed in the report.
Trip Stage Summary
Get an outlook of all the completed, ongoing, upcoming, and canceled trips of your organization in the form of a chart. Click a stage and get a detailed report of the trips in that stage.
Trip Expense Summary
Get a comprehensive view of all the expenses, including personal expenses incurred by employees during their trips. The analytics report includes details such as trip number, name, booking expenses, per diem allowance, trip expenses, and the total expense amount. Additionally, you can group the trip data by status, policy, department, or the travel type.
You can also predict or estimate the future trip expenses over a specific period in your organization. Zoho Spend will forecast trip expenses based on historical data to help you plan effectively and make informed decisions.
Note: Forecasting reports is available in early access. You can write to us at support@zohospend.com to enable this feature for your organization.
Here’s how you can forecast the trip expenses:
- Go to Analytics on the left sidebar.
- Click Trips under Analytics Category.
- Click the Trips Spend Summary report.
- Navigate to Chart View above the table.
- Click View Forecast at the top right corner.
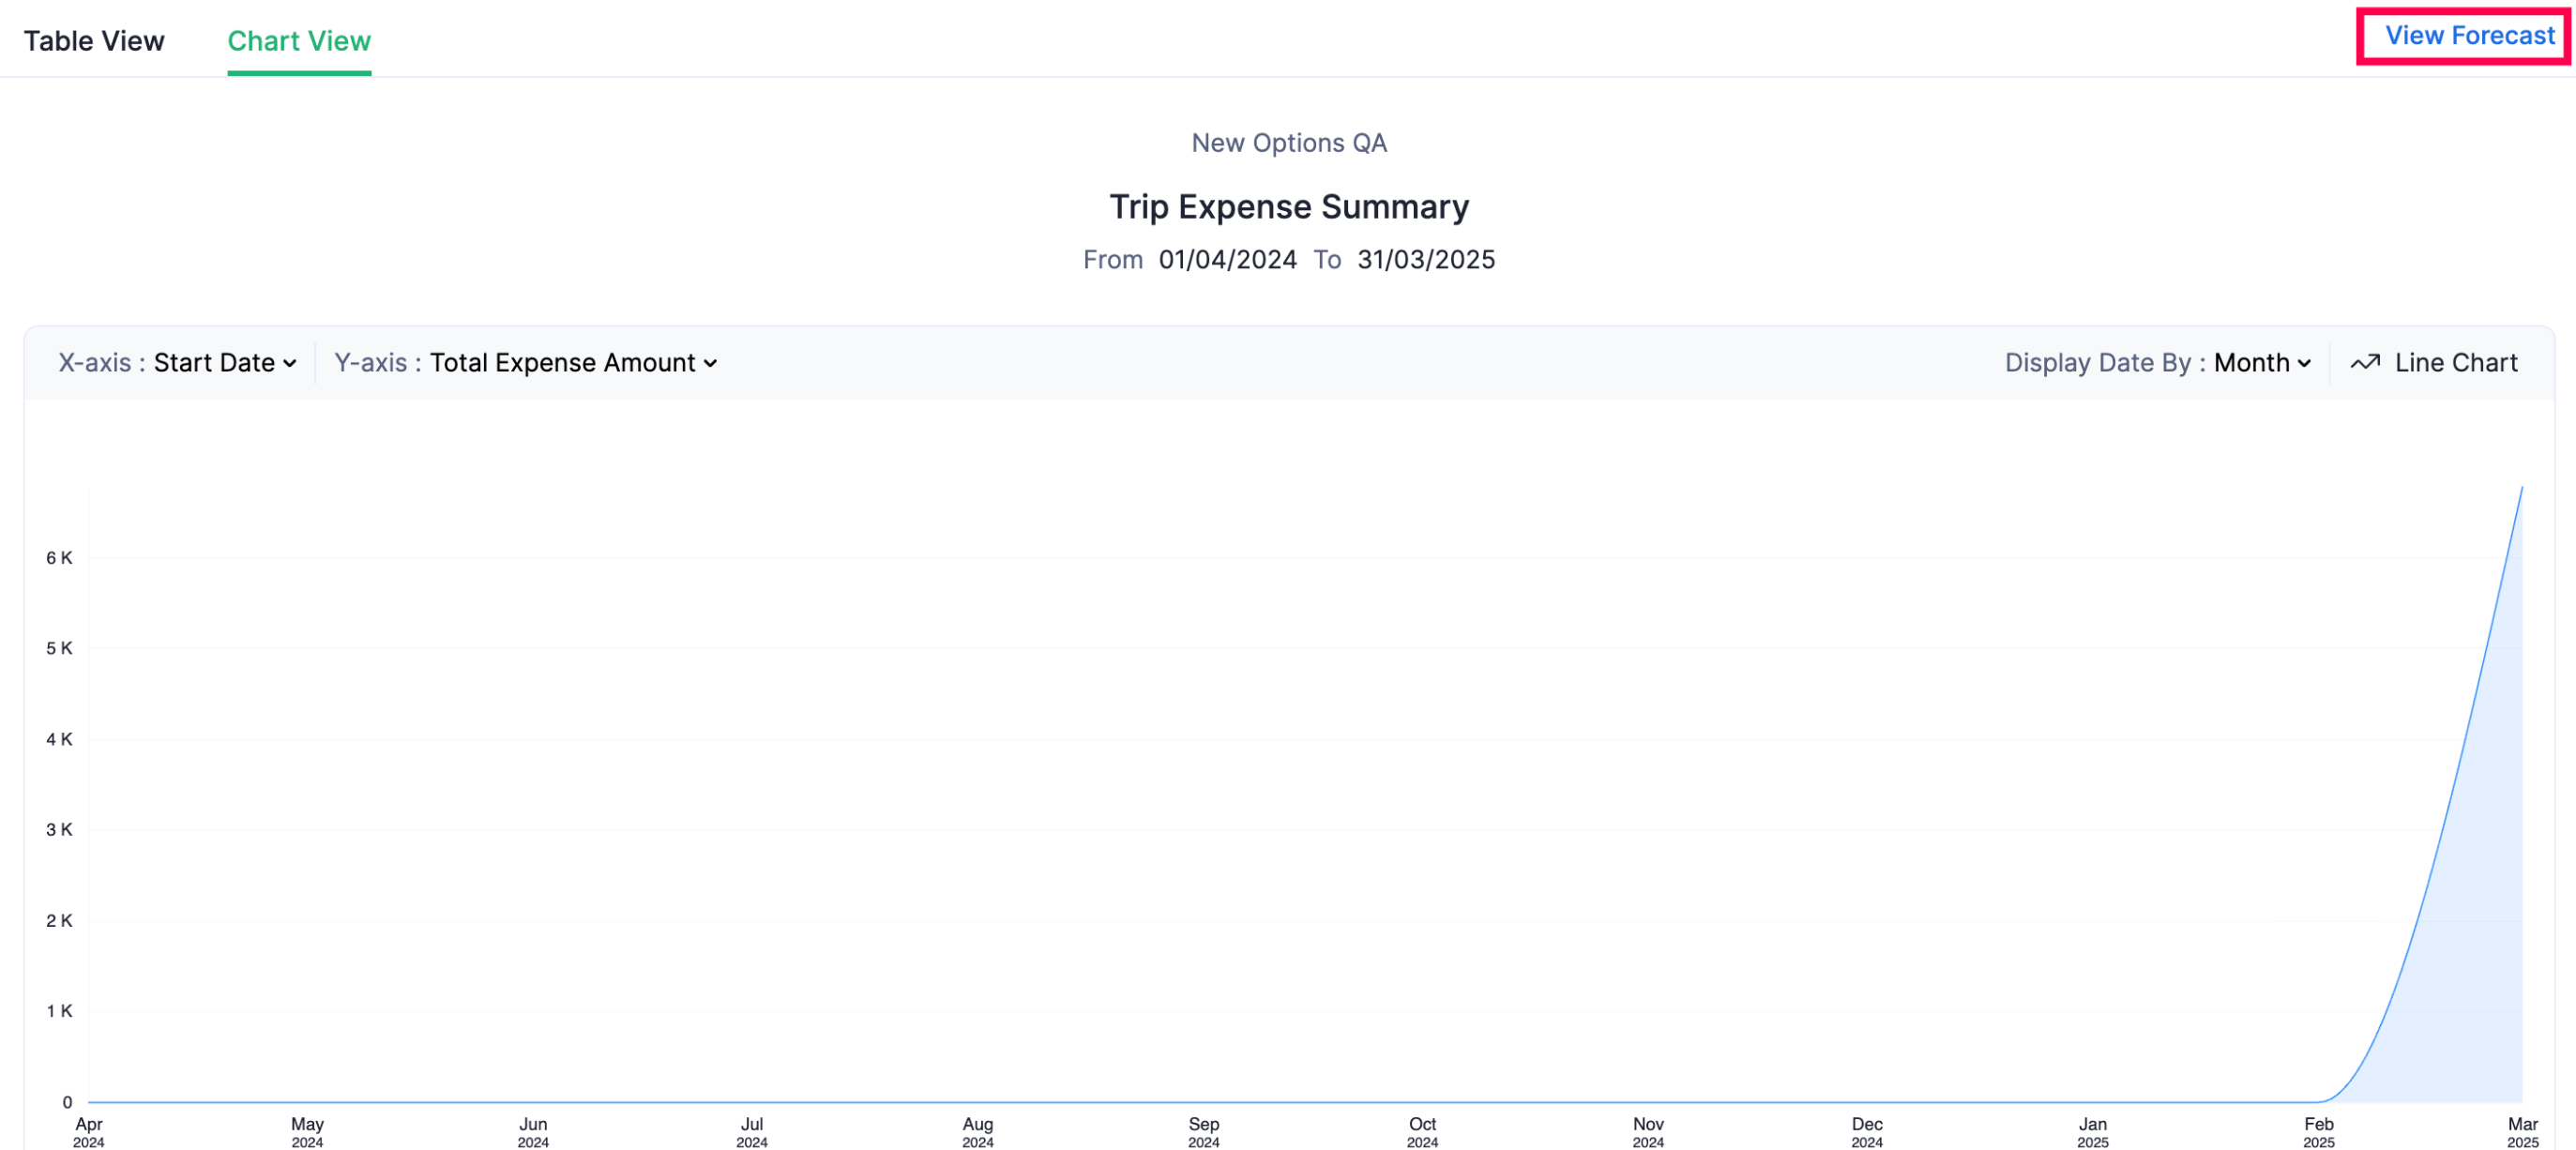
Zoho Spend forecasts future trip expenses using data from the selected date range.
You can also create a custom date range. Here’s how:
- Click the dropdown next to the Date Range and select Custom.
- Click Display Date By and select whether you want the data to be displayed based on Month, Year, Quarter, or Day.
Using Zia Insights, you can analyze the report and gain key insights, including future projections, trends, and other key details.
Here’s how you can view Zia Insights:
- Go to Analytics on the left sidebar.
- Click Trips under Analytics Category.
- Click the Trips Spend Summary report.
- Navigate to Chart View above the table.
- Click Zia Insights. Report insights will be displayed in the right pane.

Trip Summary by Report Status
In this report, you can view a chart that displays the status of the expense reports that are associated with the trips raised by the employees. If you click any of the report statuses, that is, Unsubmitted, Submitted, Approved, and Reimbursed in the chart, details regarding the trips to which the expense reports in the selected status are associated will be displayed.
Time Taken for Booking
Note: This analytics report is available only if booking options are enabled for trips.
This report shows the time taken for booking a flight, hotel, train, or bus for a business trip. You can also filter the data by specific interval ranges. To do this:
- Go to Analytics on the left sidebar.
- Click Trips under Analytics Category.
- Click Time Taken for Booking under Trips.
- Click the Interval Range dropdown in the right corner of the page.
- Enter how many intervals you want and choose the time span (days or weeks) from the dropdown.
- Click Apply.
Booking Stage Time Summary
Note: This analytics report is available only if booking options are enabled for trips.
View the time taken for adding an option, selecting an option, and booking a ticket for a business trip. Also, the time taken for adding each trip option, that is, flight, hotel, train, and bus will be clearly tabulated. You can also filter the data by specific interval ranges. To do this:
- Go to Analytics on the left sidebar.
- Click Trips under Analytics Category.
- Click Time Taken for Booking under Trips.
- Click the Interval Range dropdown in the right corner of the page.
- Enter how many intervals you want and choose the time span (days or weeks) from the dropdown.
- Click Apply.