What's New In Zoho Analytics
2025
Dec
22 December, 2025
December is a special time of the year to celebrate progress, reflect on what we have achieved, and prepare for what’s ahead! As we wrap up the year, this month’s updates focus on refining experiences, strengthening analytics workflows, and setting the stage for a smarter start to the new year. Here’s what’s new this month!
Multi-Table Auto Analysis
Auto Analysis now supports multiple related tables based on the model (Star schema).

Reports and dashboards generated through Auto Analysis can use data from related tables, enabling more comprehensive analysis and deeper insights without manual report creation.
Learn more
GenAI Updates
Ask Zia Actions
Ask Zia now supports actions such as Export, Share, and Schedule when using Zoho LLM, extending capabilities that were previously available only with OpenAI.

This allows you to take immediate action on insights generated by Zia, making it easier to share results and automate report delivery.
Learn moreEmbedding support by Zoho LLM
Zoho LLM now supports embeddings for GenAI skills in the US, EU, and IN data centers. This centralizes embedding support within Zoho LLM and removes the need to configure OpenAI credentials.
Learn more
Improved PDF Export
We have enhanced PDF exports to ensure dashboards maintain their visual integrity.
- Images embedded within widgets are now included in PDF exports along with all applied image customizations.
- When exporting dashboards, report card backgrounds now retain the same opacity as in the original dashboard, ensuring visual consistency in PDFs.
New Connectors
Zoho Analytics now supports new integrations with FreshBooks, Zoho Voice, and Zoho Shifts, enabling you to bring in data from additional business applications for unified reporting and analysis. In addition, new modules are now supported for Zoho Inventory, including Zone, Bin Locations, Batch Bin Mapping, and Bin Transactions, helping you analyze inventory-related data in greater detail.
MCP Server Extensibility
The Zoho Analytics MCP Server can now be installed via NPM (Node Package Manager) package, making deployment and updates significantly simpler and developer-friendly.
Learn more
Data Connectivity Updates
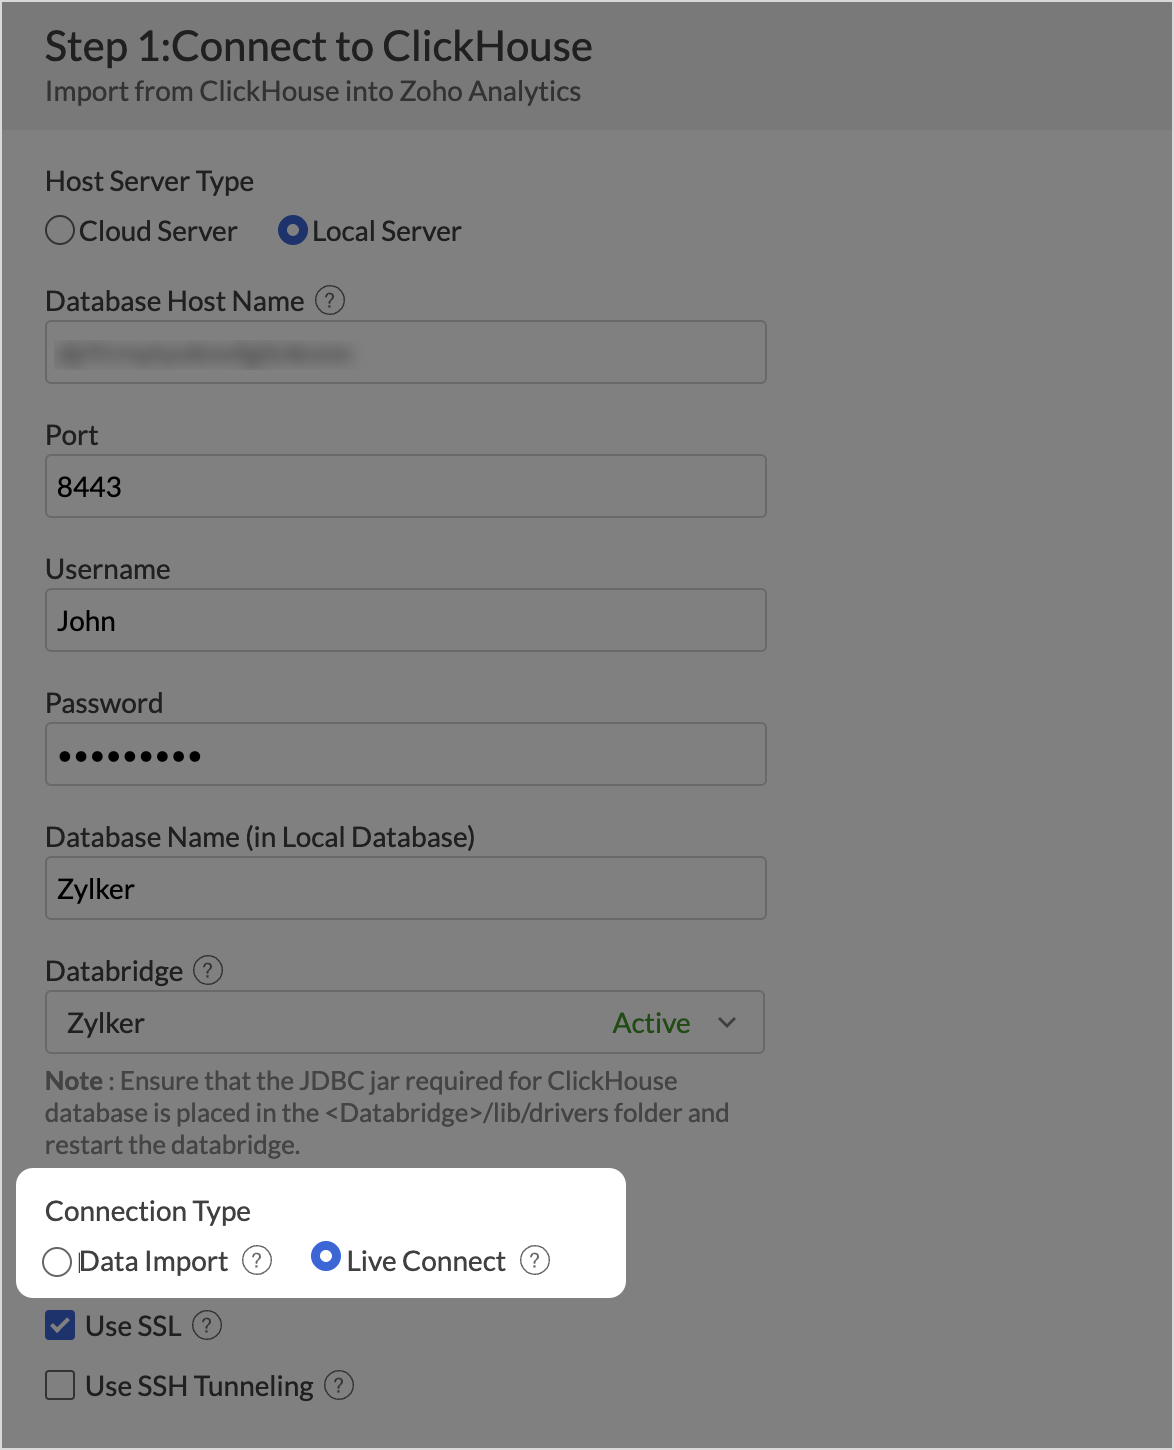
Zoho Analytics now supports Databricks (Local and Cloud servers) and ClickHouse (Local server) through Live Connect. This allows you to analyze data directly from these databases in real time, without importing data into Zoho Analytics.
Nov
29 November, 2025
We're thrilled to announce a significant update focused on expanding your data connectivity, enhancing visualization capabilities, and delivering a more powerful, intuitive, and performant analytics experience. Here’s a look at what’s new.
Explore What's New!
Accessibility
Introducing a new Accessibility section in Zoho Analytics. It gives you full control over how you view and interact with your Zoho Analytics interface. This update brings enhanced usability and helps ensure a more comfortable, efficient, and accessible reporting experience.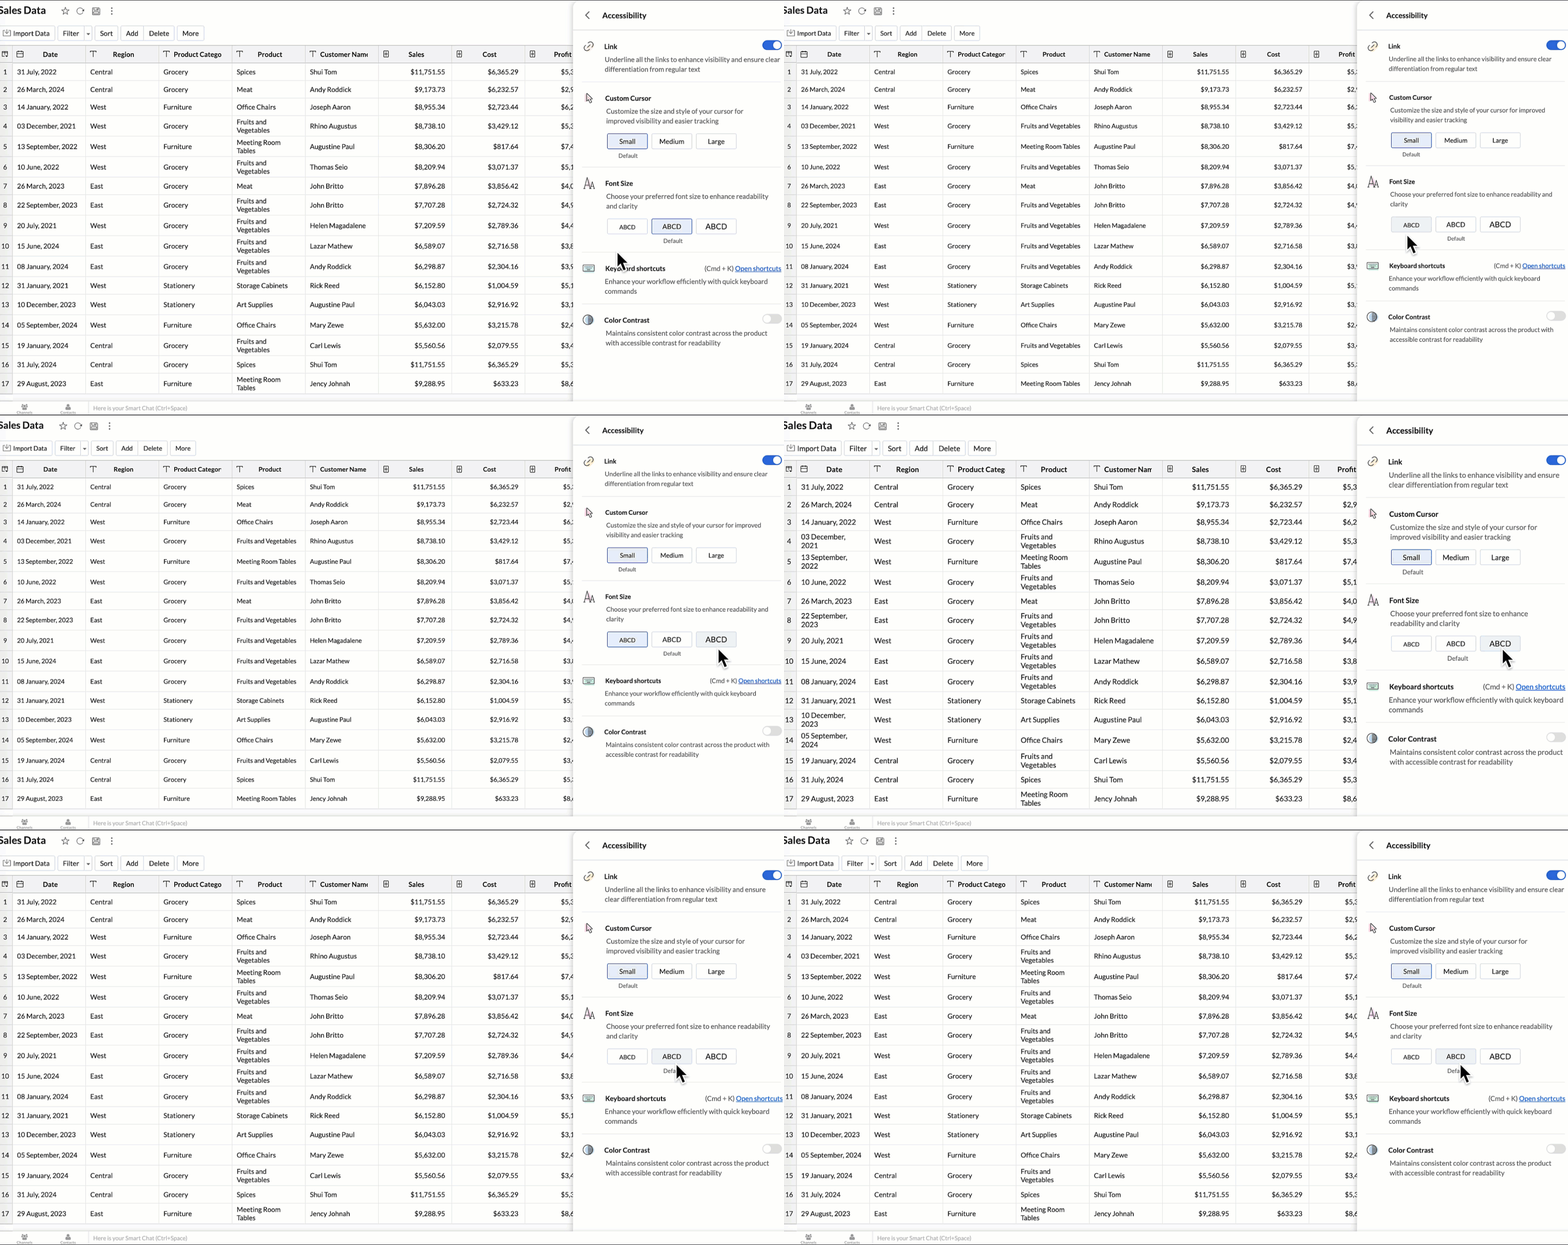
You can now personalize your interface with these new settings:
- Highlight Links - Underline all links to distinguish them clearly from regular text.
- Custom cursor - Choose the size of your mouse cursor (Small / Medium / Large) for better visibility and easier navigation.
- Font size - Adjust the font size of the interface to suit your reading comfort.
- Color contrast - Enable high-contrast mode to improve readability and support users with visual impairments.
- Keyboard shortcuts - Access a full list of built-in shortcuts, to speed up your workflow and navigate quickly using the keyboard.
New Data Connectors
Bring data from more sources into your analytics ecosystem with these new native connectors.
Qntrl Connector
Effortlessly bring workflow and process data from Qntrl into Zoho Analytics. Build reports to analyze task progress, approvals, and operational efficiency.
Learn more.
Asana Connector
Sync your Asana tasks, projects, and workflows seamlessly. Create visual dashboards to track productivity, timelines, and team performance.
Learn more.
Zoho Community Spaces Connector
Import engagement and activity data from Zoho Community Spaces. Analyze member participation, content performance, and community growth trends.
Learn more.
Zoho Finance Connector - New Modules
Gain deeper financial insights with newly added modules, enabling more granular reporting and analysis across your Zoho Finance suite.
Learn more.
Data Sync & Live Connect Enhancements
Incremental Fetch Enhancements
- From Other Workspaces: Users can now configure incremental fetch for data imported from another workspace, bringing in only new or updated records. This improves sync efficiency and reduces load times.
- For Custom Queries: Incremental fetch is now supported for data imported via custom queries, retrieving only new or updated records to enhance performance and reduce processing time.
Developer Hub Enhancements
API – Ruby Language Support
Zoho Analytics SDK now supports Ruby, enabling developers to build Ruby-based integrations and automation with native methods.
Learn more.
JS API - Tab Switch
Enhance embedded dashboard navigation. The JavaScript API now allows you to switch between tabs programmatically, enabling a better navigation control and interactive dashboard experiences.
Learn more.
Map & Geo Analytics Enhancements
Map-Layering Enhancements
Map Layering now includes drill-through for individual layers, options to fix unresolved locations, and the ability to use layered maps as filters in dashboards. These updates deliver deeper and more interactive geo-analysis.
Learn more.
Map Chart – Tooltip Enhancements
Map chart tooltips have been refined by removing Latitude/Longitude values. Users now see cleaner, more meaningful data highlights.
Reporting & Visualization Enhancements
Drill Through Enhancements
Drill-through is now supported for both Public Views and Embedded Views, enabling viewers to seamlessly access related reports for deeper data exploration and enhanced analytical context.
Previously, drill-through functionality was limited to shared reports. With this enhancement, viewers can now open linked drill-through reports, provided those reports have also been made Public.
Learn more.
Tooltip / Info Icon in Widgets
Widgets now support tooltips and Info icons to display additional descriptions or context. This helps dashboard viewers understand metrics instantly.
Learn more.
Anomaly Detection – Color Support
Anomaly detection results now include intuitive color cues, making unusual patterns or values easier to identify at a glance.
Learn more.
Sorting of Values Across Group in Pivot Views
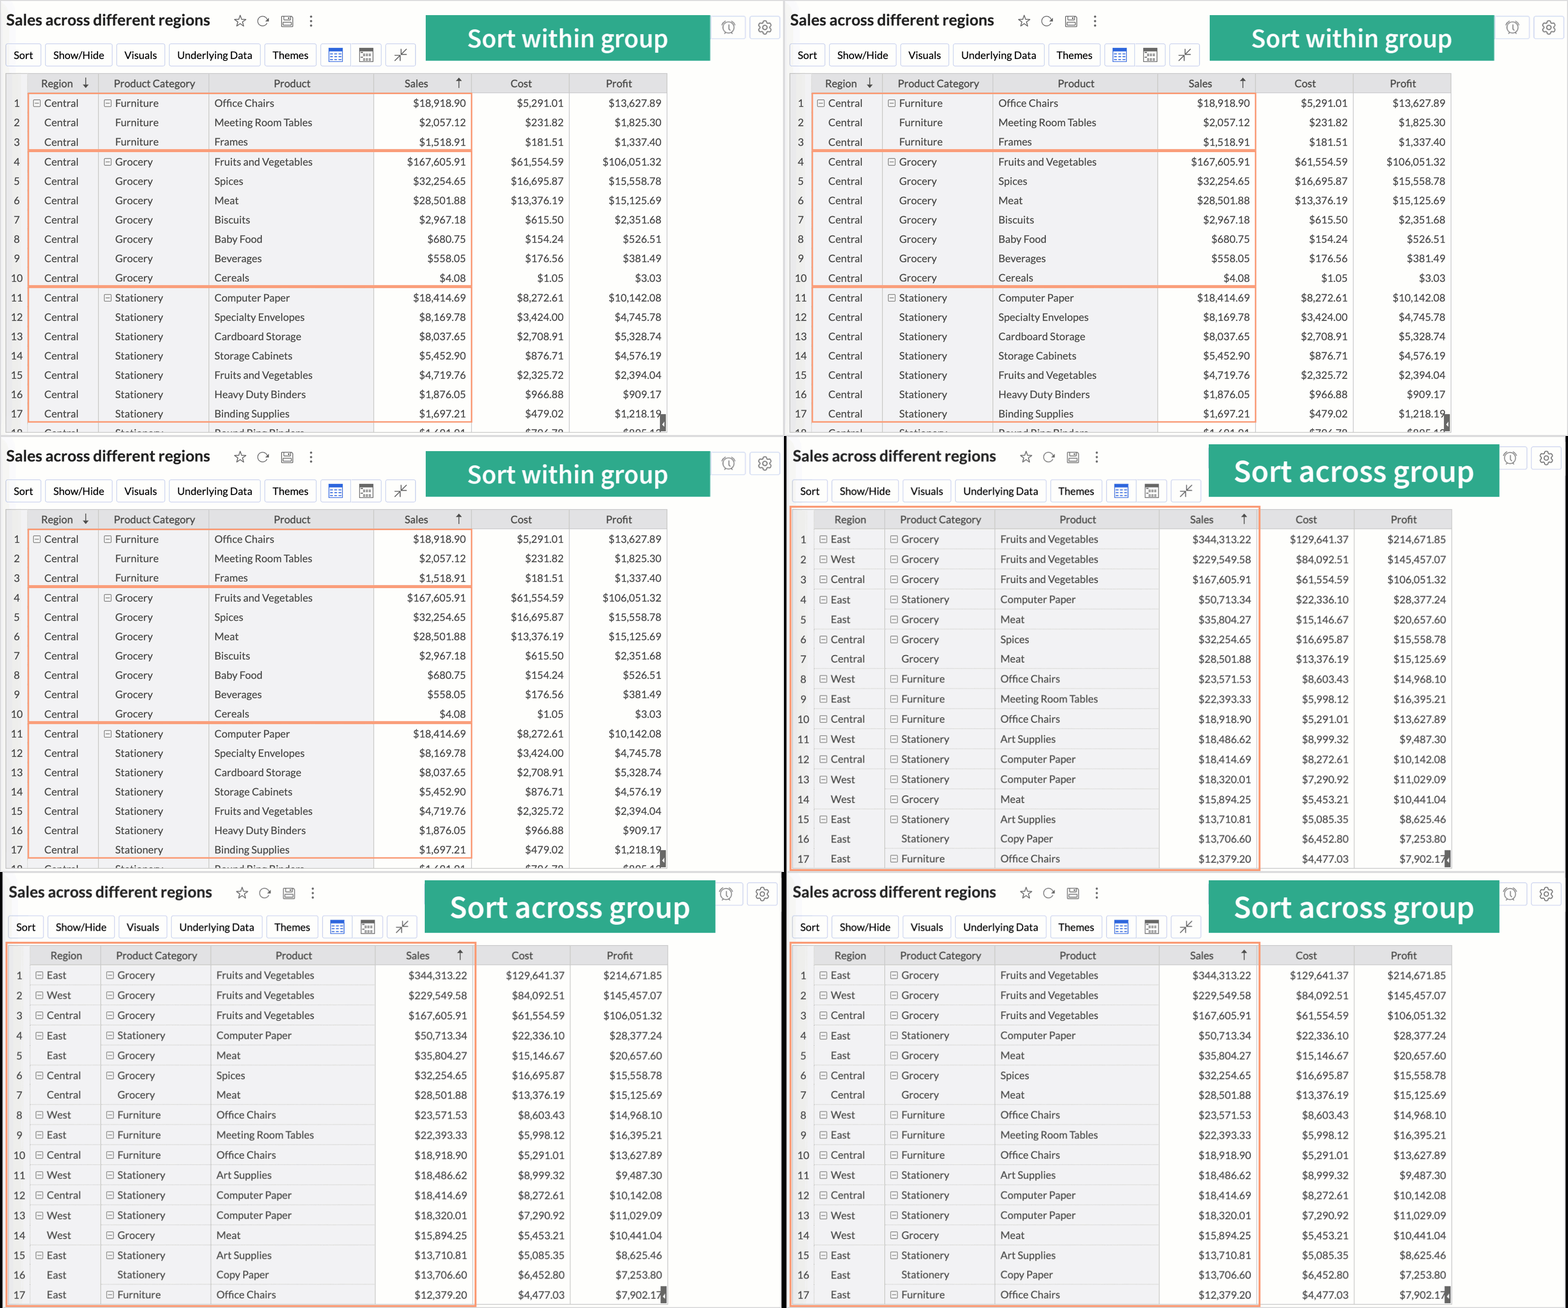
We have added a new option called Sort across Group which helps you apply clearer and more consistent sorting in Pivot Tables.
Earlier, sorting worked only inside each group. With Sort across Group, you can now sort the entire pivot table based on the selected column, regardless of how the groups are arranged.
Learn more.
Freeze Column Support in Pivot & Summary Views
We have added Freeze Column support in Pivot and Summary Views to help you work more comfortably with wide reports. This feature keeps selected columns fixed on the left side of the table while you scroll horizontally, allowing you to compare key columns with other metrics without losing context.
Learn more.

Report-Level Fiscal Year Option
Align individual reports with your organization's financial calendar by defining the Fiscal Year start month at the report level. This setting applies only to the selected report and appears when a date column is used, enabling accurate time-period analysis.
Learn more.
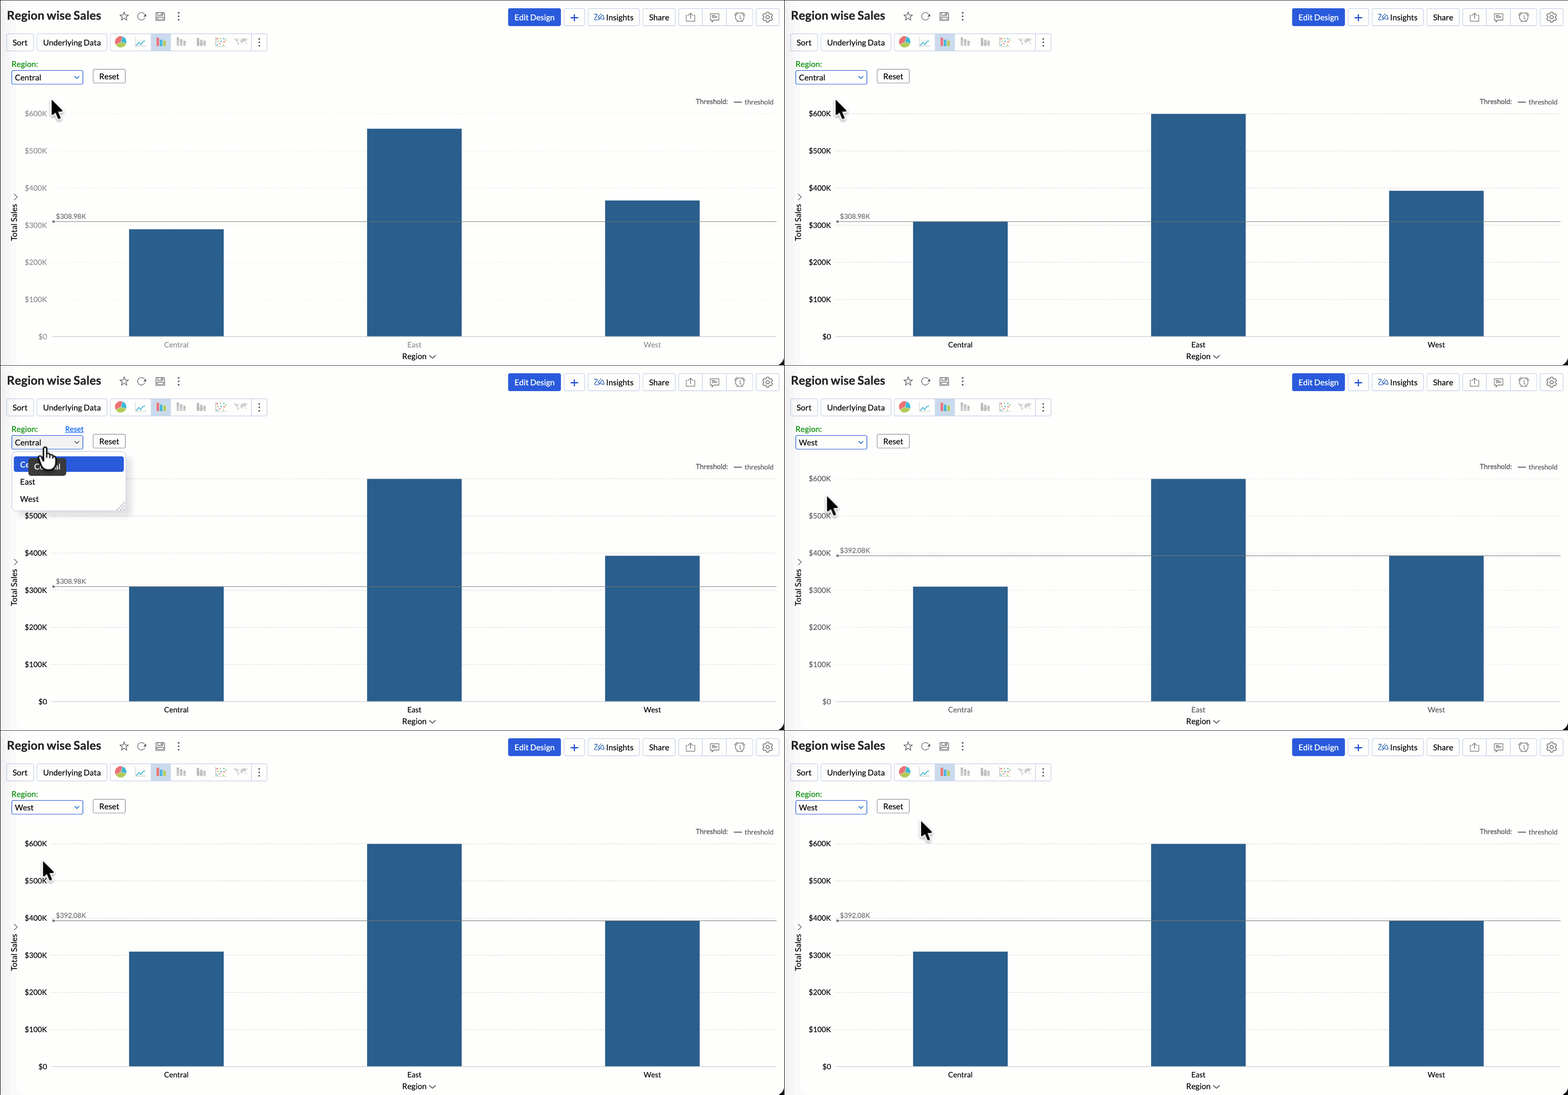
Dynamic Thresholds with Variables in User Filters
Aggregate formulas can now be used with variables inside thresholds. When paired with User Filters, threshold values are calculated dynamically based on each user’s filter selections ensuring every user sees context-relevant threshold boundaries instead of a fixed value.
Learn more.
Datatype-based Variable Suggestions for Default User Filters
When configuring default values in User Filters, only variables matching the filter’s datatype are now listed. This prevents configuration issues such as assigning a text variable to a numeric filter, and ensures accurate default value mapping.
Learn more.
AI & ML Enhancements
AutoML – 128GB Server Support
AutoML now runs on high-power 128GB servers in the US Data Center. This enables faster model training and support for significantly larger datasets.
Learn more.
Zia Insights - Enhancements
Customize Zia Insights
Users can now tailor Zia Insights by selecting specific metrics and dimension columns for insight generation and choose the types of insights to focus on:
- Contribution Analysis: Understand key factors impacting outcomes.
- Time Series Insights: Detect trends, seasonality, anomalies, and forecast future values.
- Comparison Between Dimensions: Analyze performance and variance across different dimensions.

This customization ensures insights are focused, relevant, and tailored to the report’s context.
Learn more.
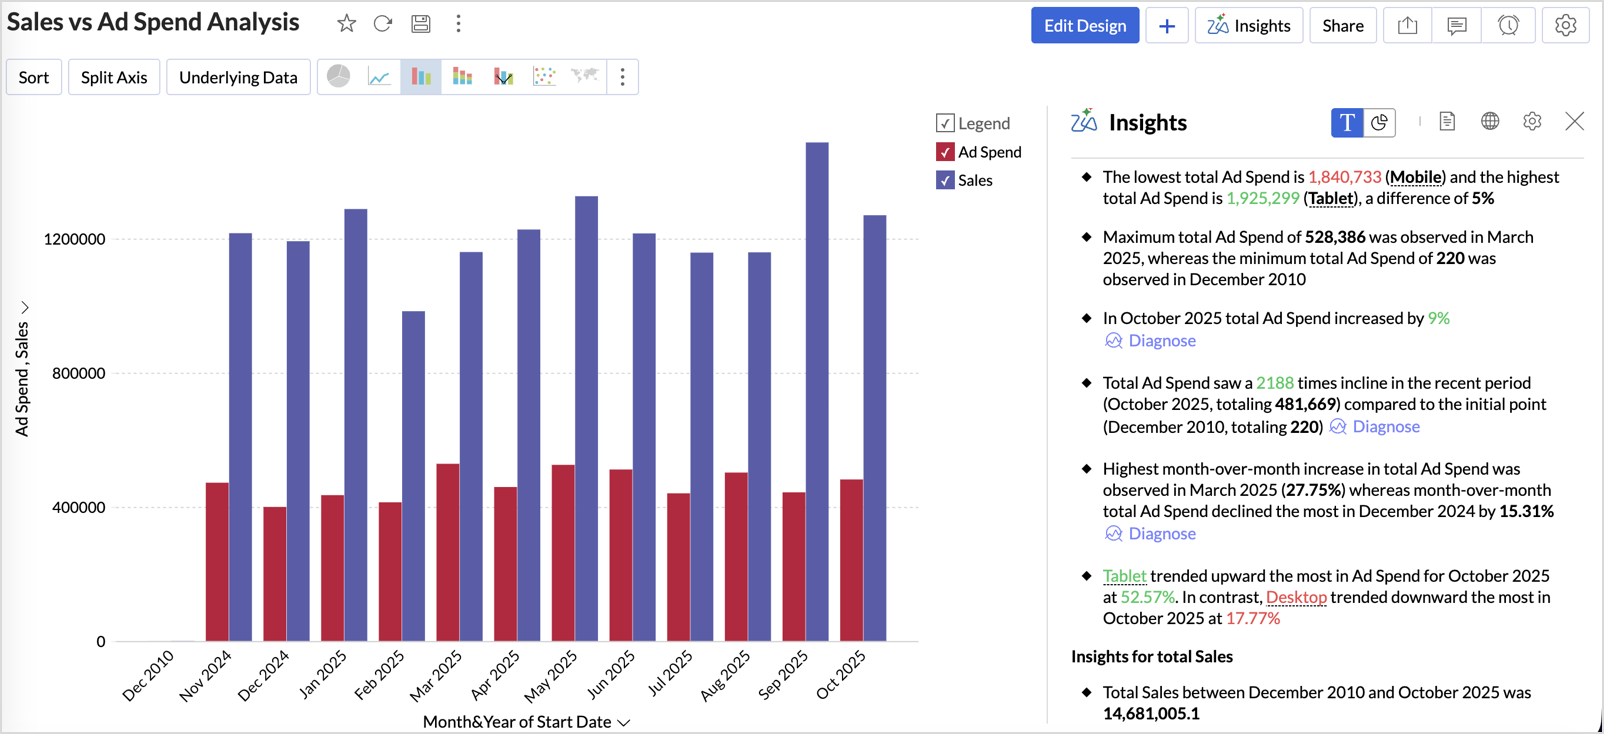
Diagnostic Insights Now Available for Multiple Time Series Analyses
Previously, diagnostic insights were available only for Recent Time Period Analysis. With this update, users can now access diagnostic insights across multiple time series analyses like, Anomalies/Outliers, Largest Incline/Decline, Period-over-Period Changes, and Start vs End Period Analysis revealing the “why” behind the data for more informed decisions.
Learn more.
Other Updates
Audit Logs for White label Users
Track administrative actions with greater precision. All activities performed in the White Label admin console are now comprehensively logged in the Audit Logs for improved security and compliance.
New Language Support
Zoho Analytics is now more accessible globally, with support for 29 international and 11 Indian languages.
Learn more.
Oct
29 October, 2025
Hello Users!
We're are back with a fresh set of updates and enhancements to make data analysis faster and more insightful. Take a quick look at what’s new and see how these updates can power up your reports and dashboards.
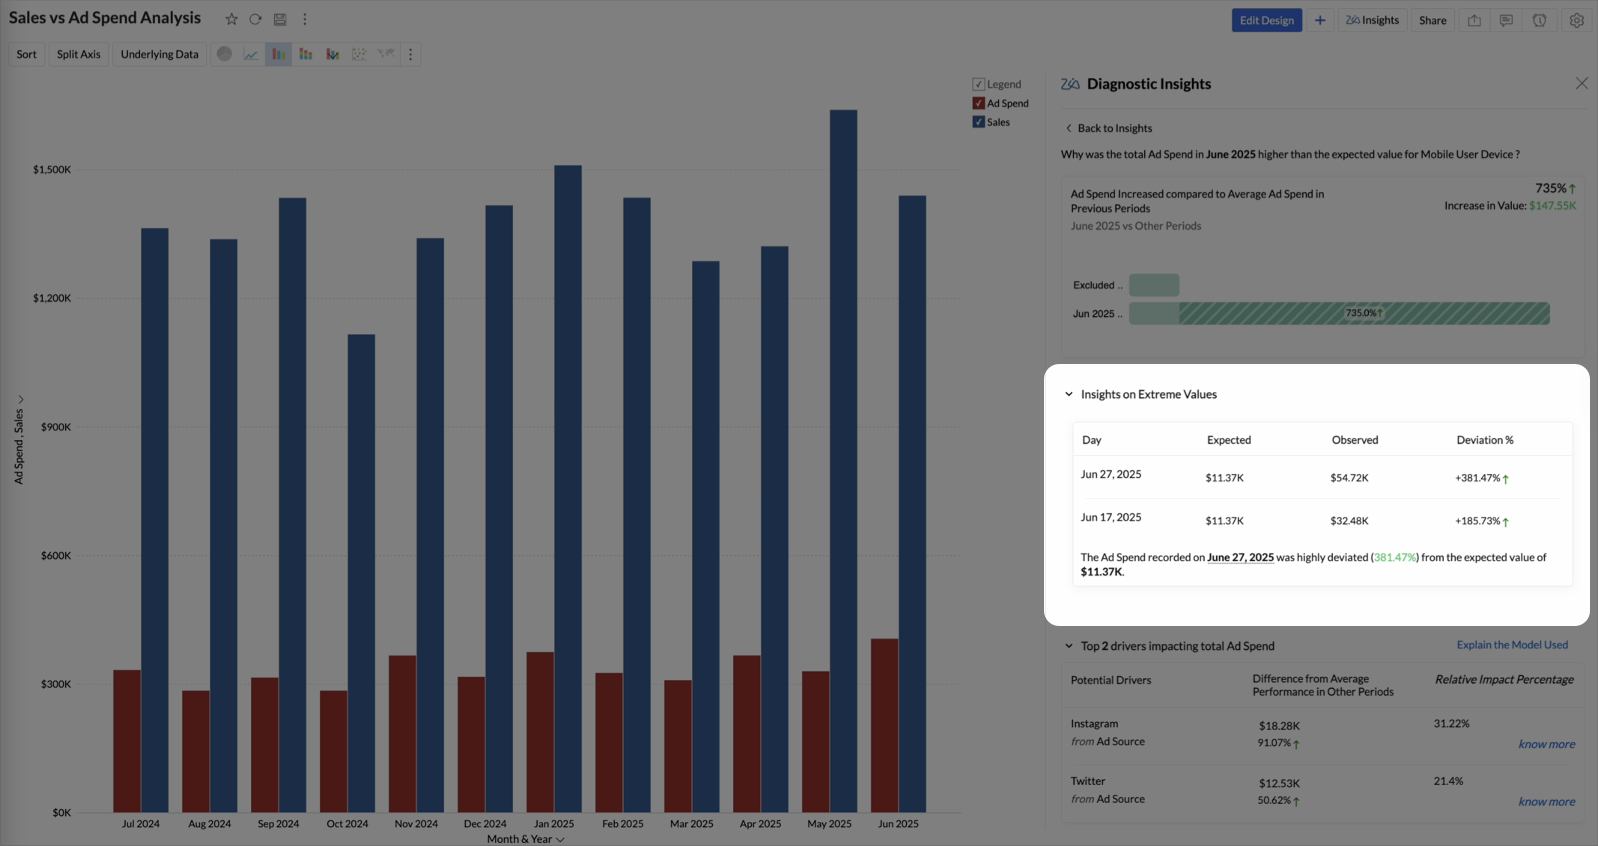
Extreme Value Insights in Key Driver Analysis
We've taken Key Driver Analysis a step further with Extreme Value Insights, a smarter way to detect outliers that drive significant changes in the target metric.
Feature Highlights
- Identify Outlier Impact: Detects unusually high or low values in key drivers that strongly influence the target metric.
- Spot Performance Deviations: Highlights sharp deviations from expected trends, revealing abnormal spikes or drops.
- Enable Deeper Diagnosis: Helps uncover thresholds and understand the factors driving extreme variations in performance.
Create Tabular View using Multiple Tables 
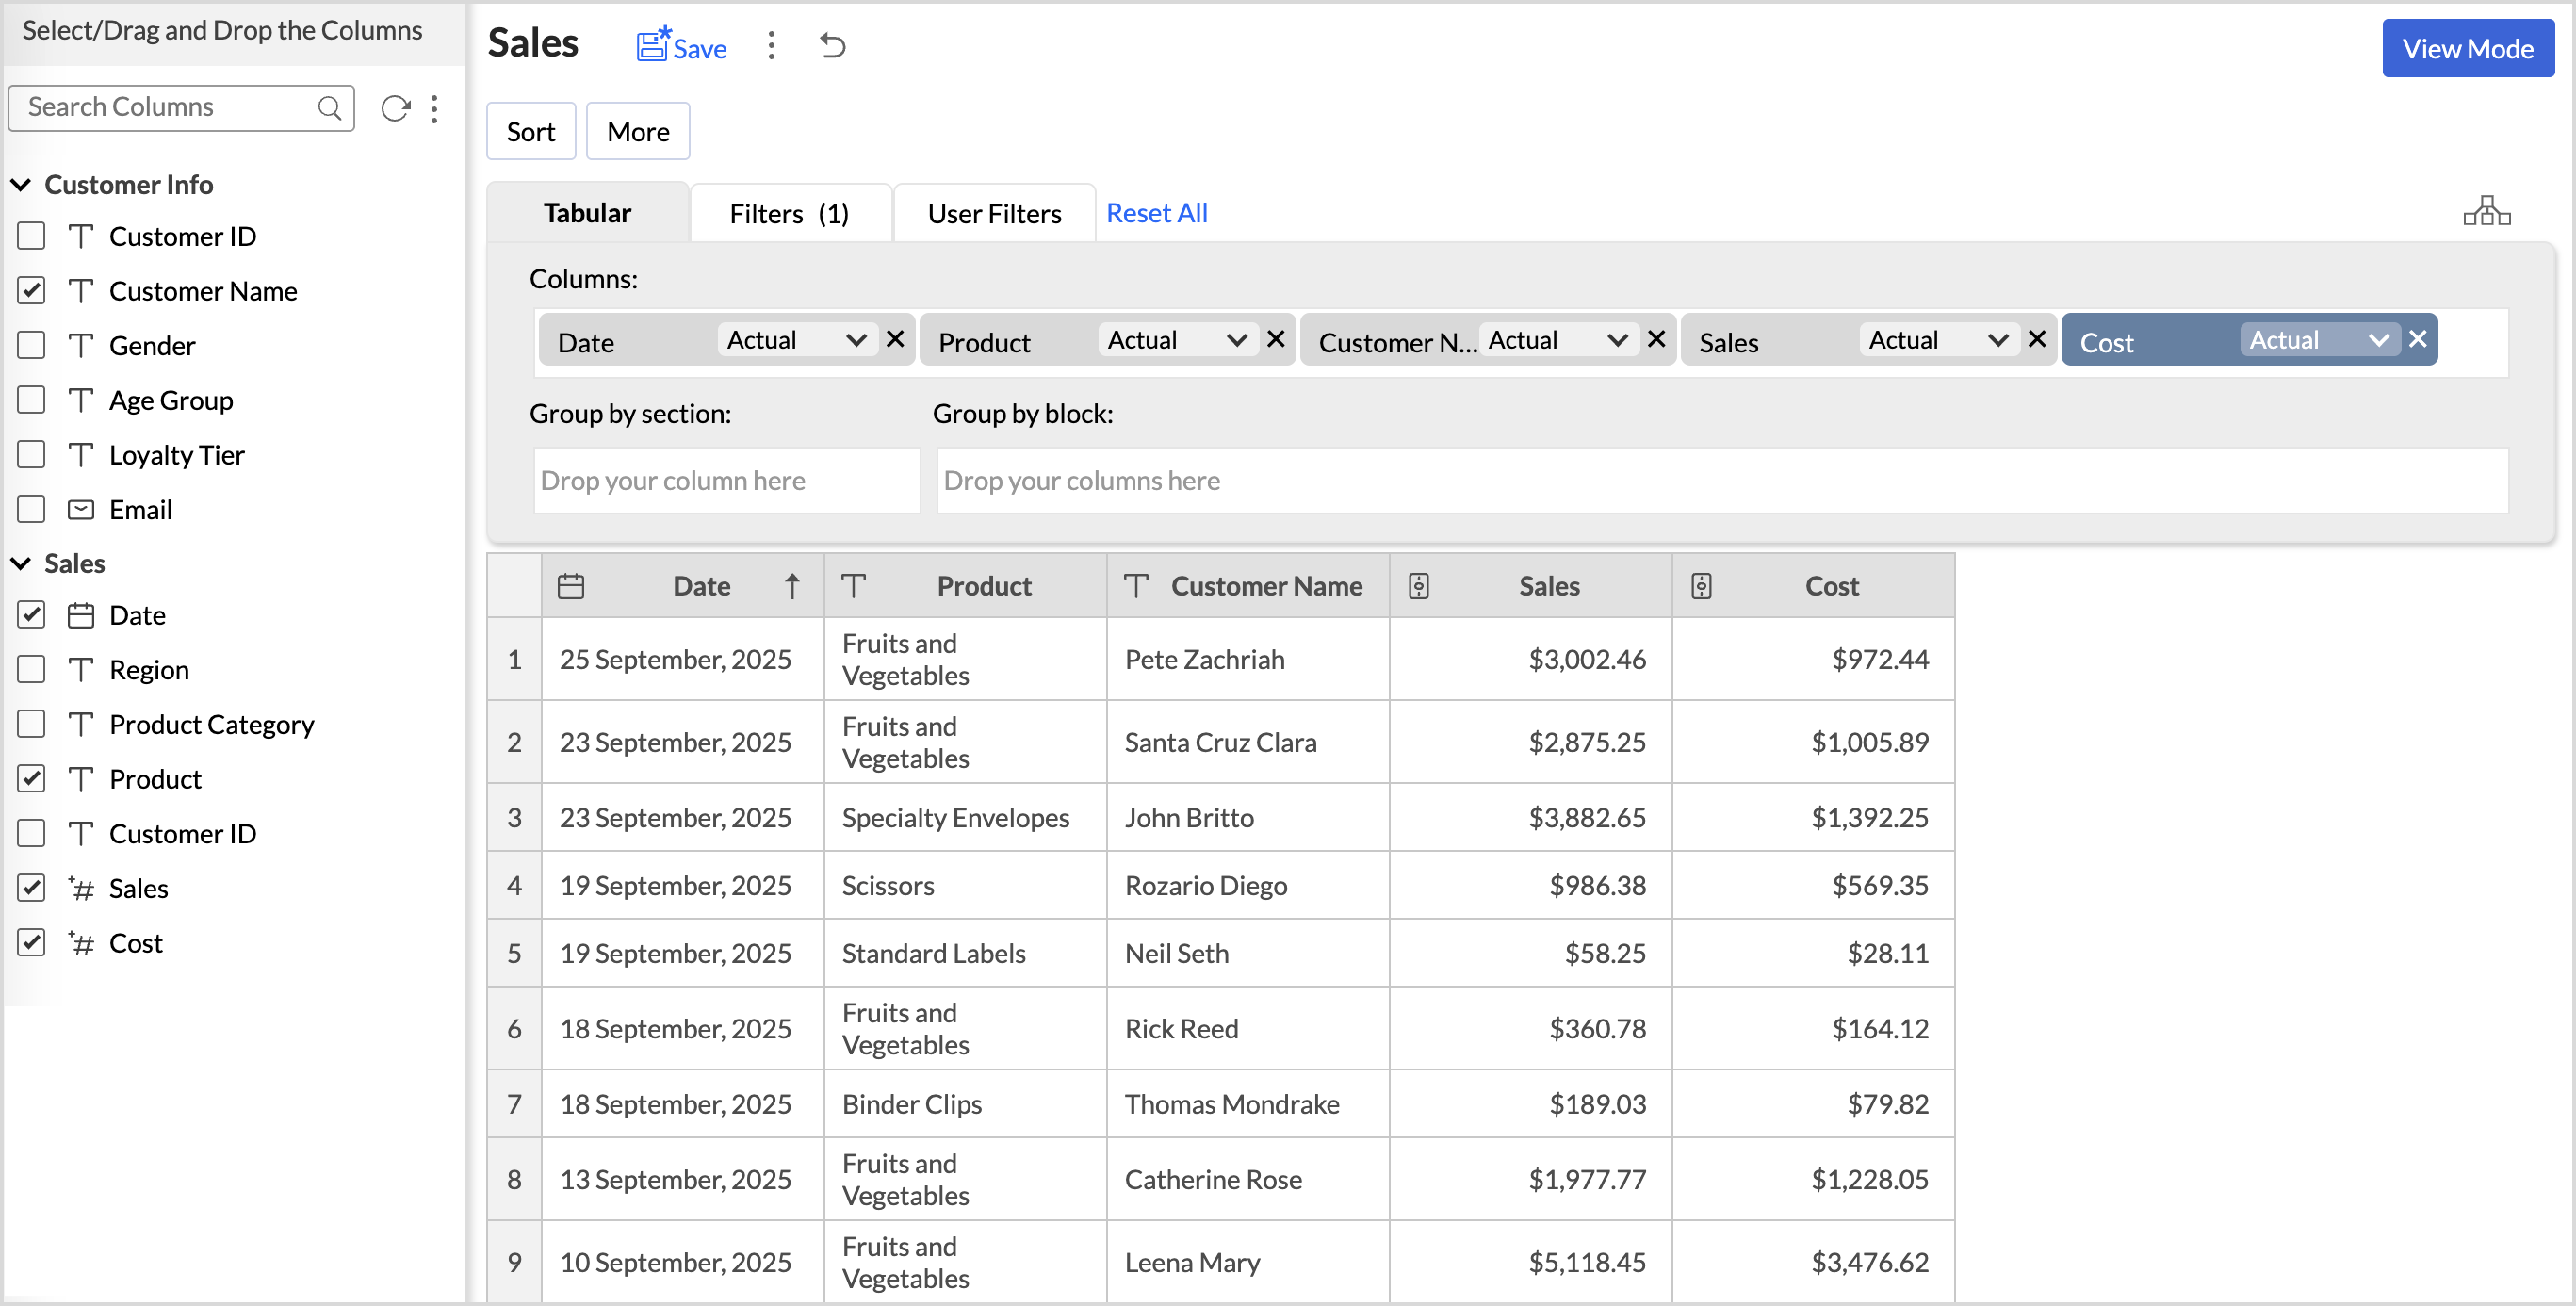
With this enhancement, all tables linked via lookup columns are now available when creating a tabular view. This allows you to build reports that include multiple key metrics and dimensions. Previously, tabular views could be created from a single table only.
Learn more.
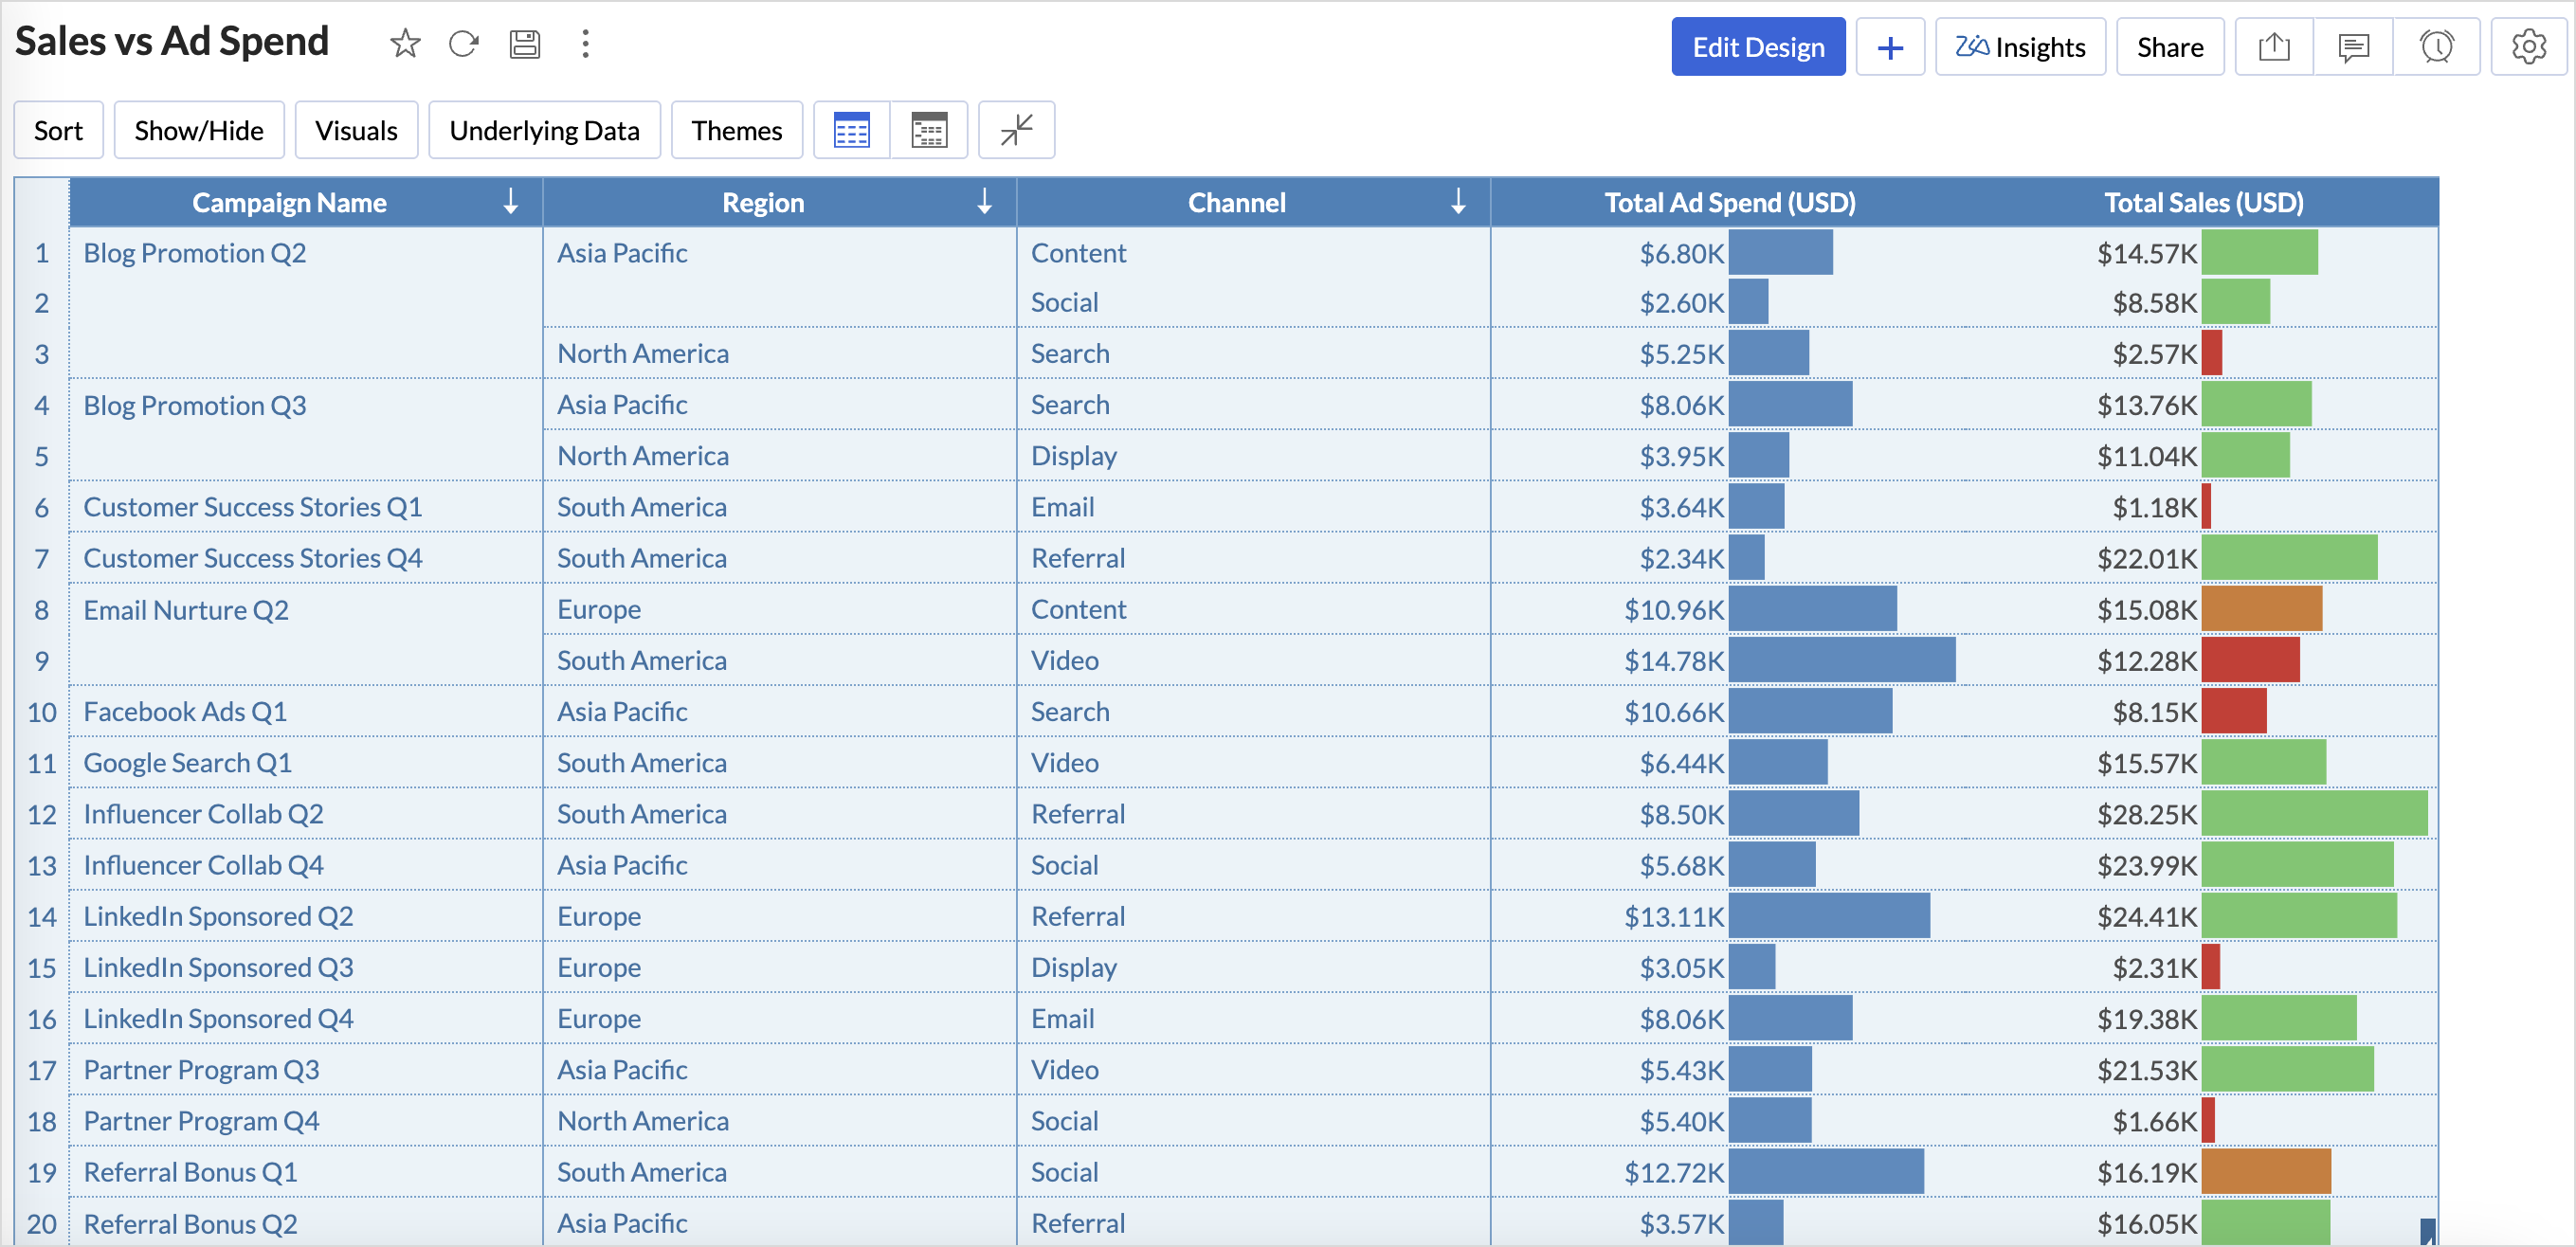
Conditional Formatting for Data Bars
Turn static data bars into dynamic ones by applying conditional formatting. Now, you can instantly highlight metrics that meet, exceed, or fall short of defined targets, making it easier to spot trends, outliers, and performance deviations quickly and clearly.
Feature Highlights
- Visualize Trends: See patterns and performance variations directly in Data Bars.
- Dynamic Updates: Data Bars respond automatically when underlying data changes.
- Customizable Appearance: Choose colors, scaling, and direction to match your reporting needs.
Geo Spatial Functions
We've now introduced a set of geo spatial functions in Zoho Analytics enabling advanced location-based analysis. The newly added functions include:
- ST Makepoint
- ST Makeline
- ST Buffer
- ST Area
- ST Distance
- ST Intersect
- ST_Centroid
These functions help you perform spatial computations such as measuring distances, creating geometries, and analyzing spatial relationships between locations.
Learn more.
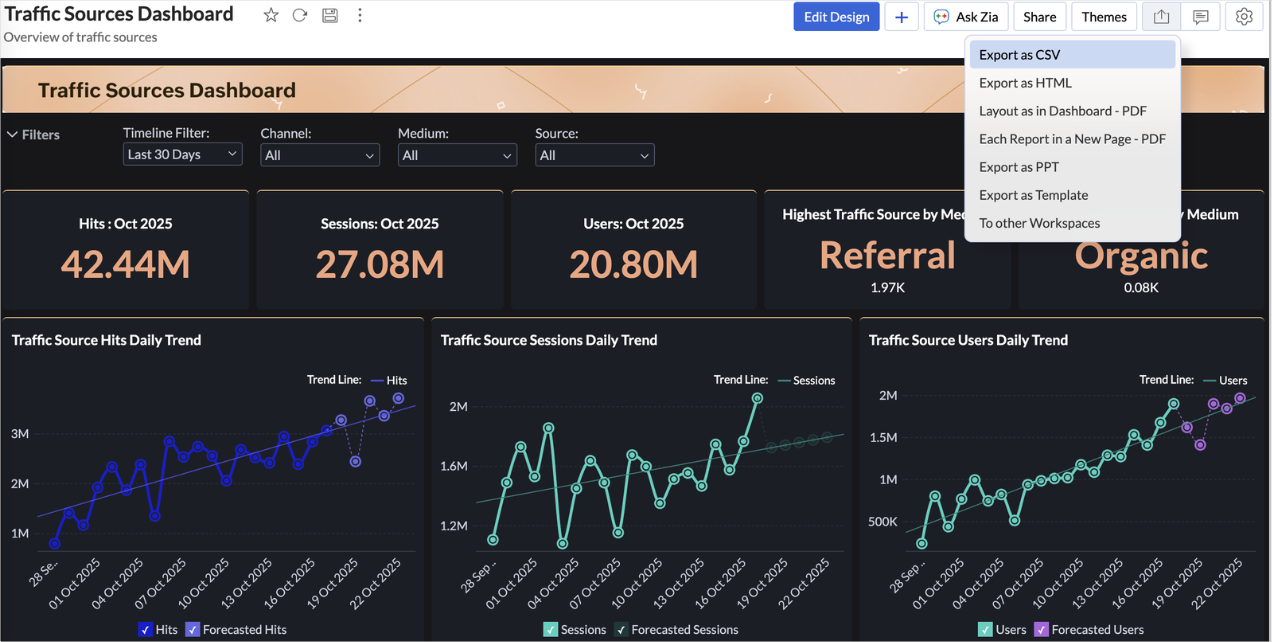
Export Dashboard as CSV Files
Export dashboards directly as CSV files, making it easier to share, analyze, or archive your data outside the platform. This enhancement allows you to retain the underlying data from your reports and widgets, enabling seamless offline access and further analysis.
Learn more.
Database Connectivity
We’ve expanded our support to help you bring in data from more sources, more flexibly.
Azure Managed SQL Instance
Import data from Azure Managed SQL Instance into Zoho Analytics. This allows you to seamlessly integrate cloud-hosted SQL Server data without manual exports.
Learn more.
Query Table support in Live Connect - Google BigQuery
Zoho Analytics now supports Query Tables for Google BigQuery Live Connect, allowing you to perform complex data preparation and transformation tasks directly on your live BigQuery data. This feature is currently enabled on request.
Learn more.
Sep
01 September, 2025
Hello Users!
In this month’s update, we’re raising the bar across multiple touchpoints, from how you bring in data, plan and track projects to how you design and brand your dashboards.
Introducing Gantt Chart
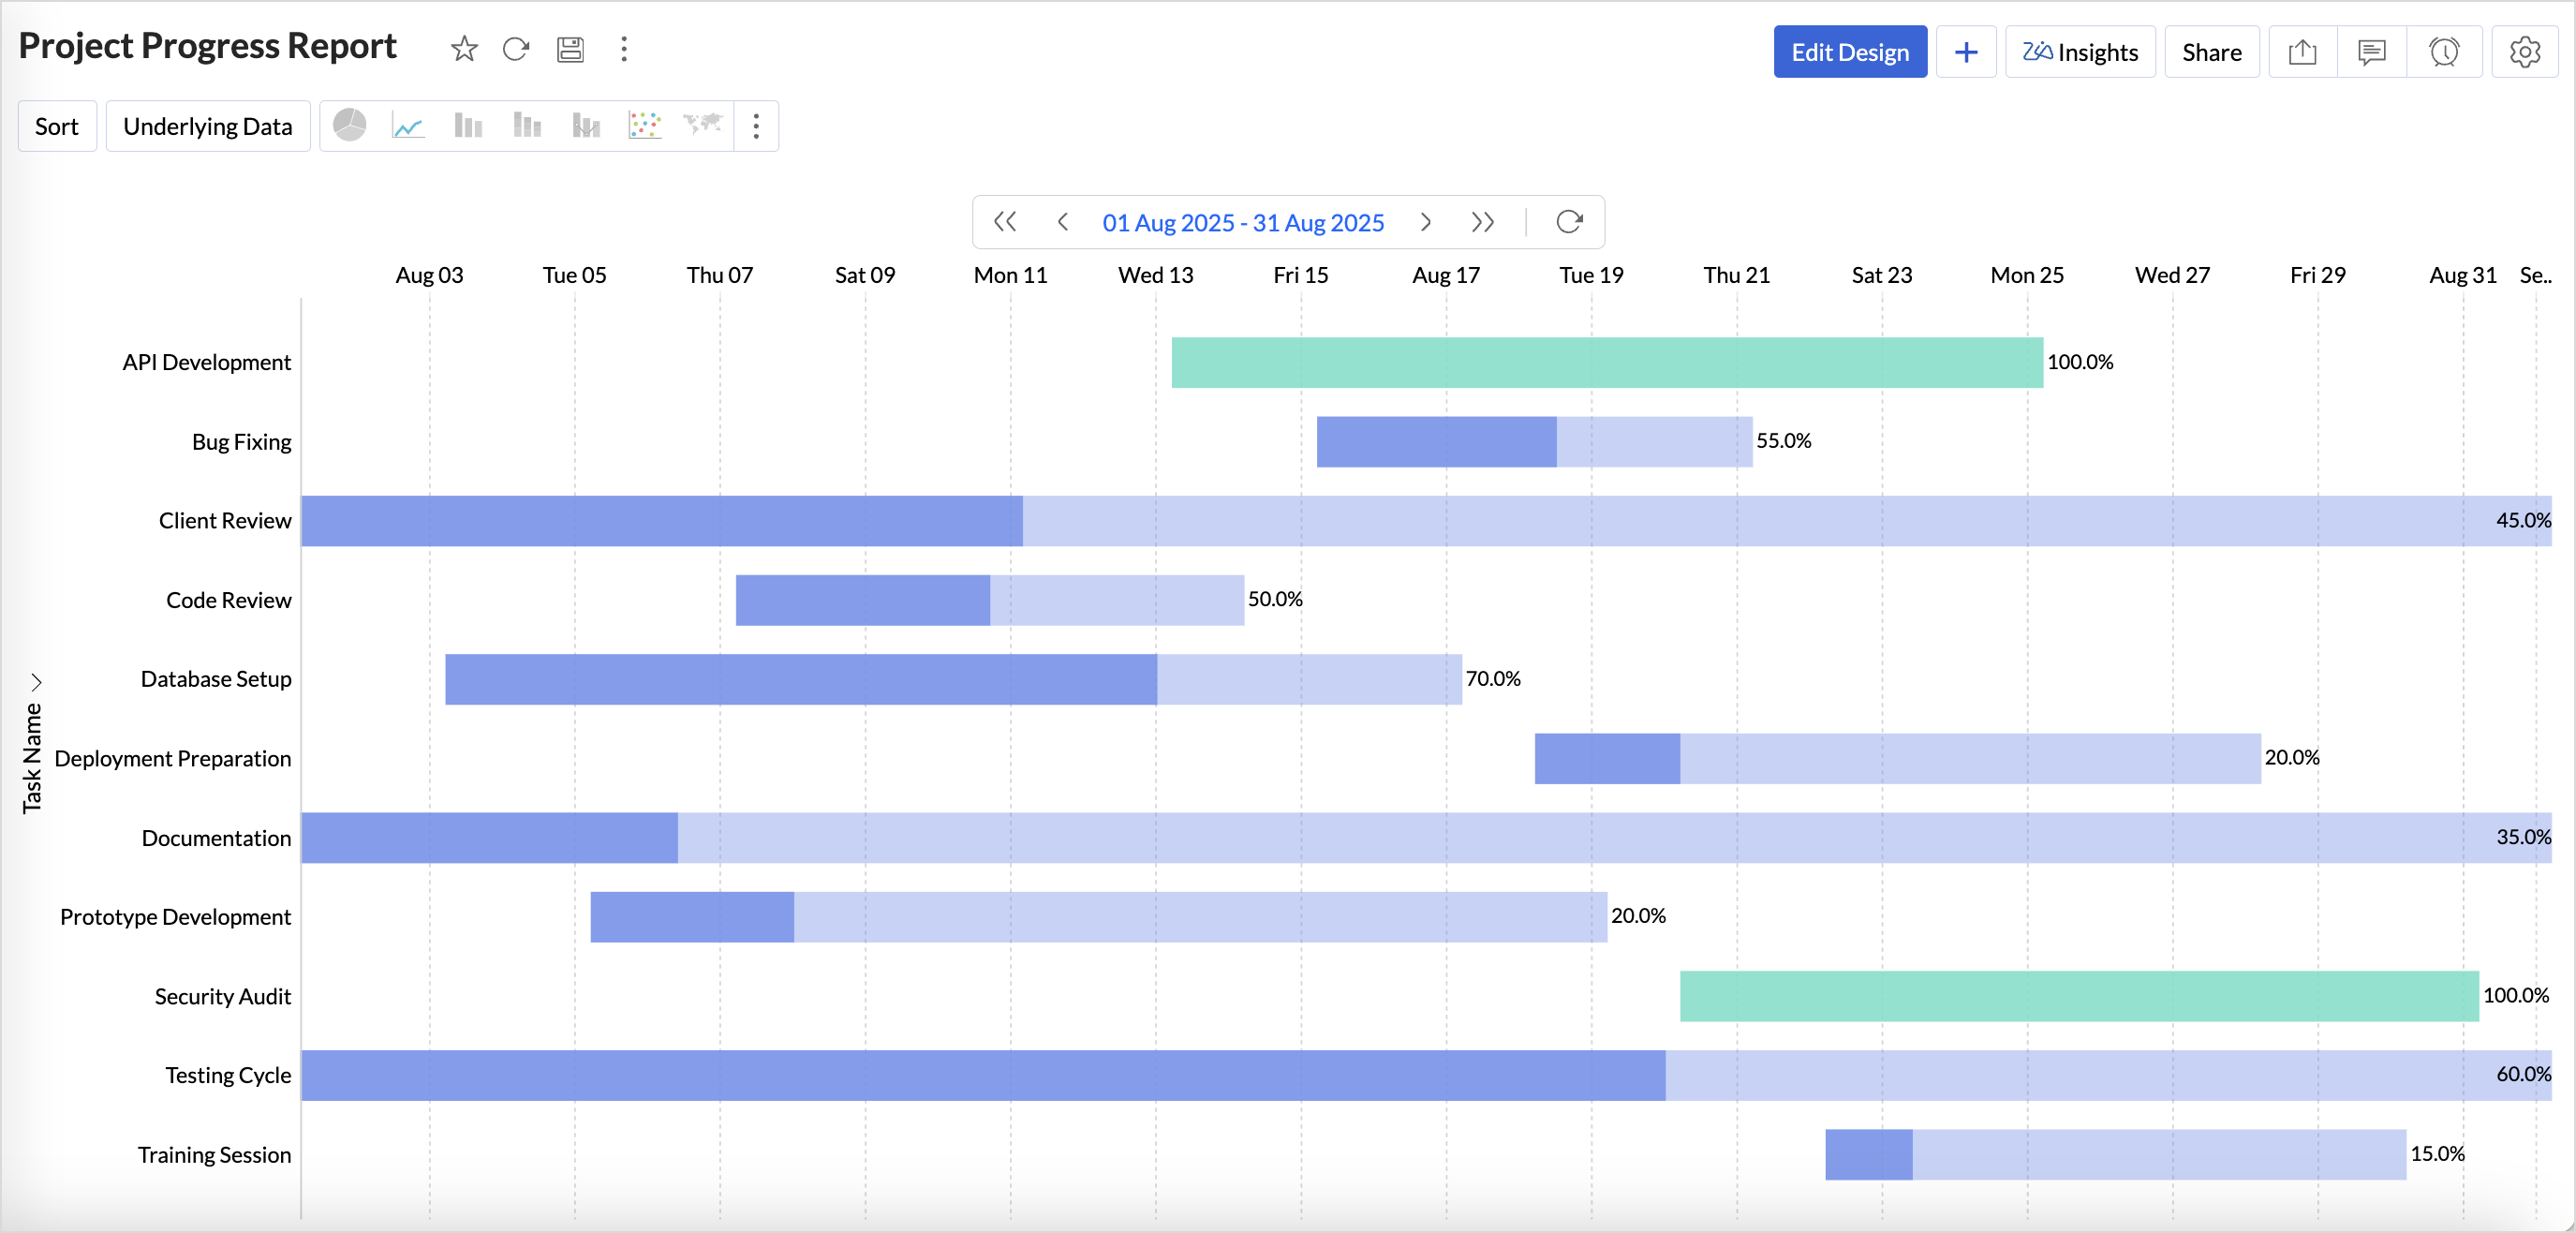
Manage projects more effectively with the brand-new Gantt Chart in Zoho Analytics. Use it to track tasks, monitor progress, and quickly identify delays in project execution. You can customize your Gantt charts with:
- Different chart styles to suit your project needs
- Color schemes to visually distinguish tasks in progress and completed tasks
- Flexible date display ranges to match your preferred project view
Database Connectivity
We’ve expanded our support to help you bring in data from more sources, more flexibly.
Cassandra
You can now import data from Cassandra, a distributed NoSQL database widely used for handling high-volume, high-velocity data. Zoho Analytics automatically normalizes the collections into parent-child table structures, making it easy to analyze your data once imported.
Learn more.
SAP HANA & ClickHouse
Now import data directly from cloud-hosted SAP HANA and ClickHouse databases. Alongside local server connection, we’ve added cloud server connection as an additional option to give you more flexibility with how and where you connect.
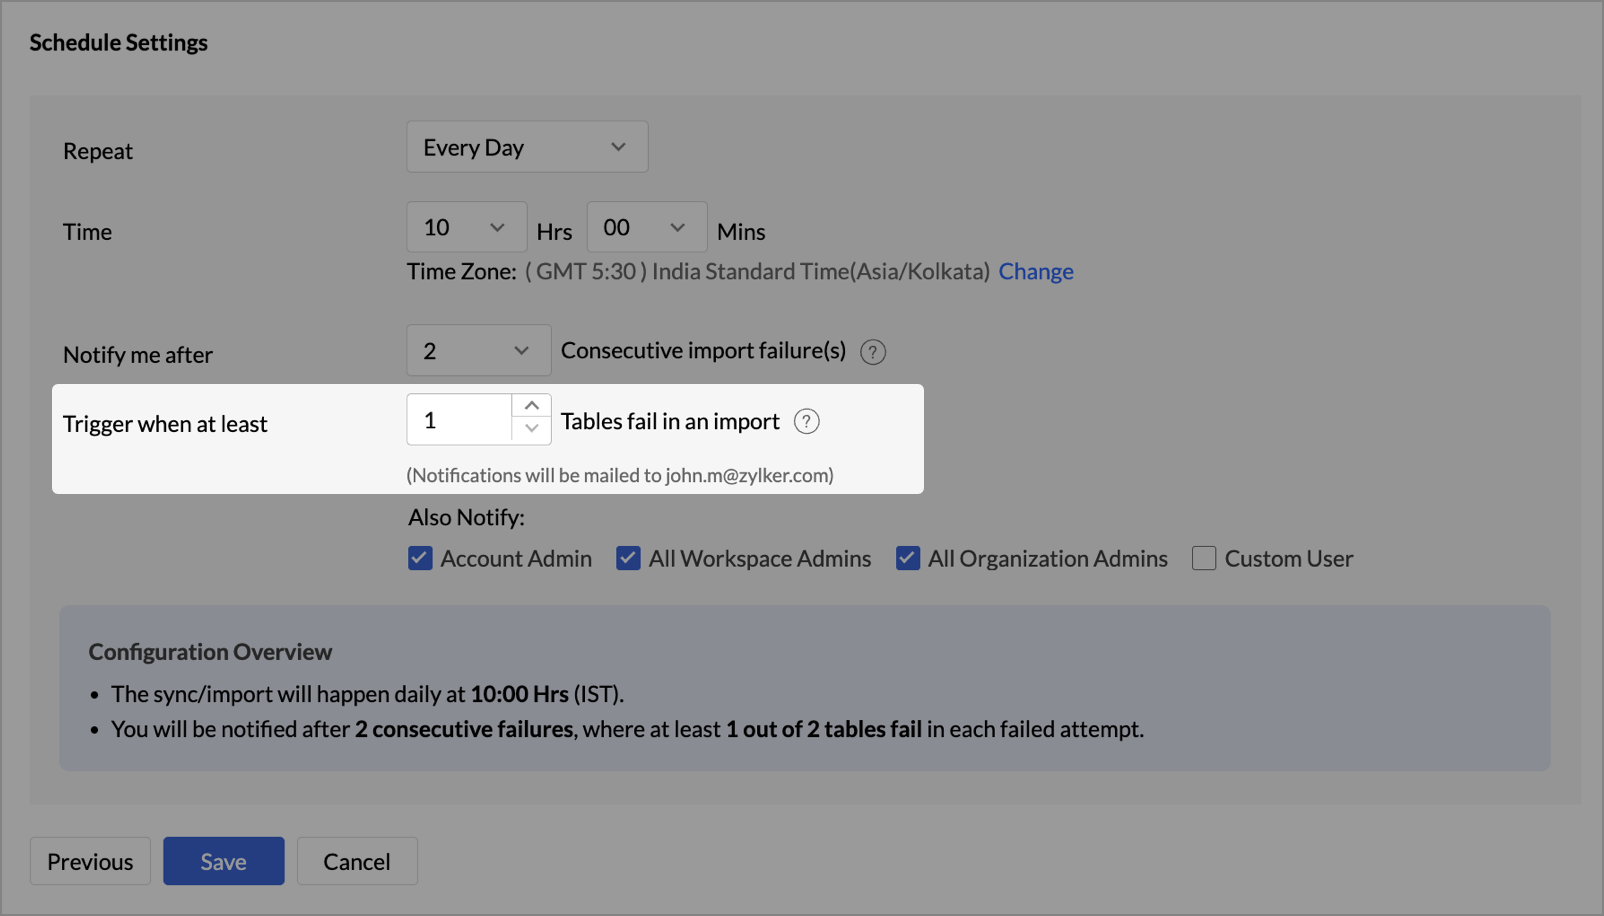
Learn more about importing from SAP HANA and ClickHouse.Cloud Database Synchronization – Failure Notification Settings
You can now configure synchronization settings to trigger a failure notification when a chosen number of table imports fail. Simply set the value for “n” failed tables, and Zoho Analytics will notify you when the condition is met. This gives you more control over monitoring imports and helps avoid missing critical sync issues.
Snowflake - New Authentication options
Zoho Analytics now supports two new authentication methods, Private key and OAuth for connecting to your Snowflake data. These options provide more flexibility and enhanced security. Learn more.
Local File Formats
Working with local files is now more powerful and flexible.
- New File Format Support - Parquet and Avro
You can now import Parquet and Avro files. These modern, columnar file formats are optimized for analytical workloads and are commonly used in big data pipelines. - Larger file uploads
Until now, Zoho Analytics supported large file uploads only for CSV files. With this update, you can now upload files (Excel, HTML, JSON, XML and Statistical files) larger than 100 MB using Zoho Databridge
This enhancement removes the hassle of file size limits when working with heavy datasets across multiple formats.
Learn more.

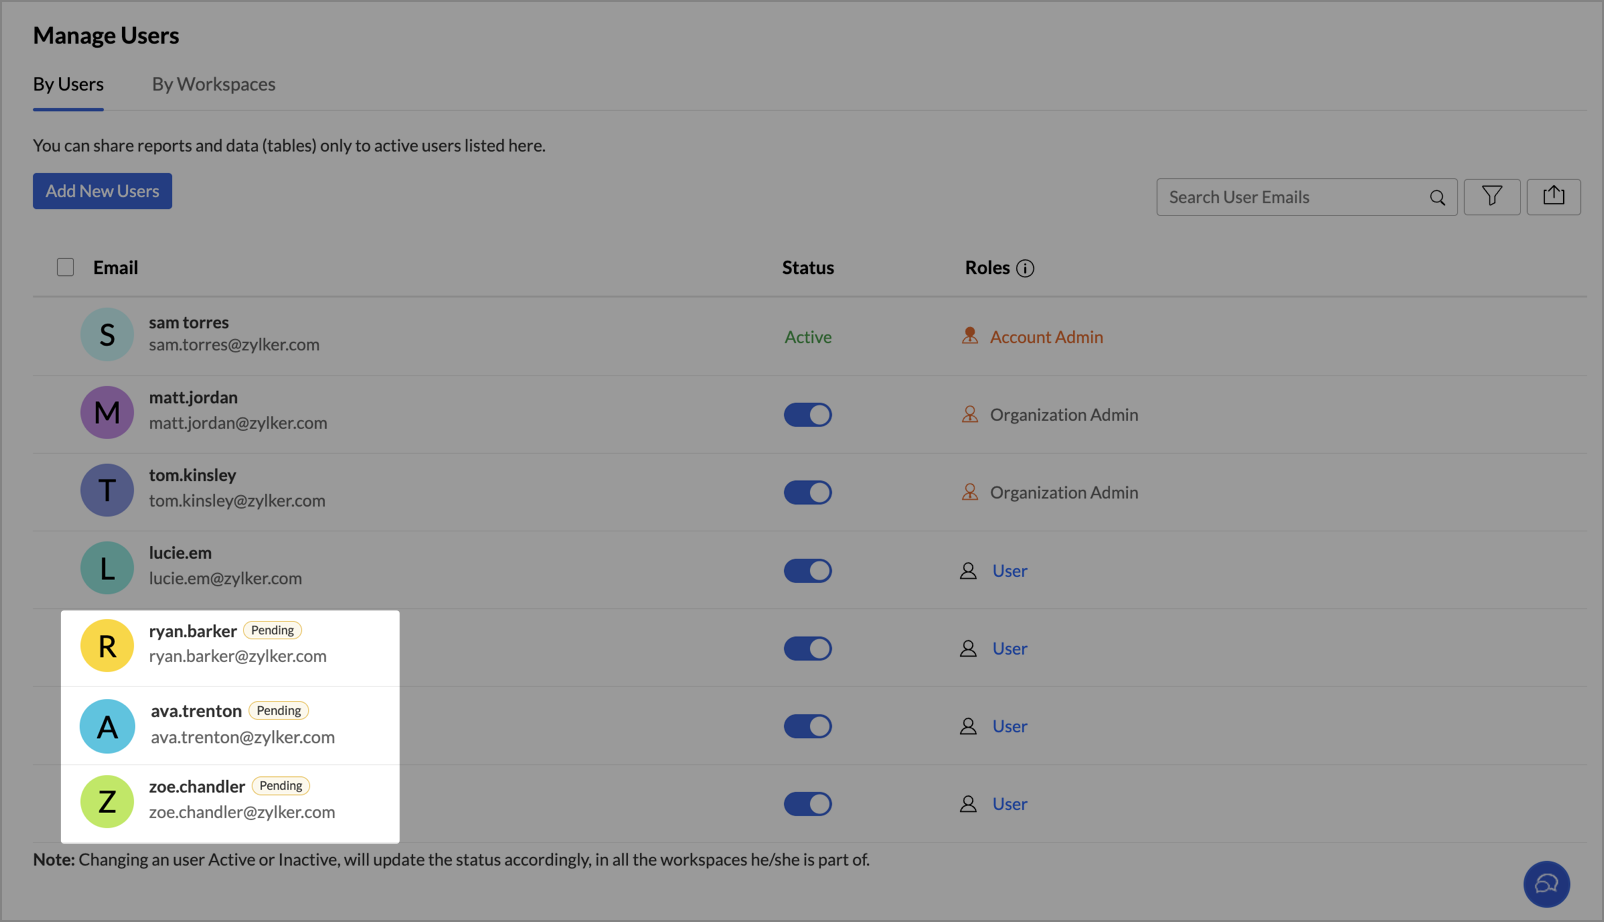
Invitation-based User Invite Flow
Zoho Analytics now uses an invitation-based model for adding users to your organization.
You can invite users in multiple ways, based on your workflow:
- From the Organization Settings or Workspace Settings
- While sharing reports or dashboards using email addresses
- By adding users to Groups
Invited users will receive an email and must accept the invitation to join. Access to your organization and its shared content will be granted only after they accept the invite. This ensures better control and visibility over user access.
Learn more.
Dashboard Background Image Customization
Personalize your dashboards like never before with new background image adjustment options. You now have greater control over how background images appear across your dashboards, helping you fine-tune visual impact and maintain readability.
You can now adjust:
- Brightness – Lighten or darken the image for visual balance
- Contrast – Enhance details and visual clarity
- Transparency – Soften the background to highlight dashboard elements
- Flip – Mirror the image horizontally for better composition
These controls allow you to create cleaner, brand-aligned dashboards that look professional and feel polished.
Learn more.

Lookup Suggestions
Creating relationships between tables is now even easier. Zoho Analytics now offers lookup suggestions based on your table’s metadata. These smart recommendations help you in identifying potential relationships between tables, reducing manual guess work thereby simplifying data modelling process.
Learn more.

White Label Updates
We have introduced a more modern and consistent experience for white label.
- Zoho Analytics latest UI is now available for White Label
Users who opt for white label deployment can now offer the latest Zoho Analytics user interface to their end users. This includes the updated layout, navigation, and overall design, providing a seamless and branded analytics experience.
Learn more. - Dedicated White Label Guide
To help you make the most of white label capabilities, we’ve introduced a comprehensive guide covering everything from setup to branding best practices. This guide is now available as a separate resource for quick reference.
Learn more.
Access Log for Mobile App
Zoho Analytics now extends access log tracking to the Mobile BI App, giving admins greater visibility into how users interact with reports and dashboards from mobile devices.
Jul
17 July, 2025
Announcing Agentic AI Capabilities in Ask Zia!
We are delighted to roll out the new agentic AI capabilities in Ask Zia, where every stage of the BI workflow is assisted by AI. With a human-in-the-loop approach, Ask Zia ensures that you’re in command of the decision, while AI handles the complexity.

Upholding the commitment to our motto – Analytics for All, Ask Zia, a conversational AI assistant (powered by LLMs), empowers users of different personas, such as data engineers, data analysts, and business users, to build and automate data pipelines and get intelligent recommendations and contextual suggestions through natural language prompts.
Ask Zia for Data Engineers
Ask Zia helps data engineers accelerate data preparation and pipeline tasks through natural language prompts.
Build Data Pipelines

Ask Zia pipeline builder allows you to build, clean, transform, and automate data pipelines using simple, natural language. This streamlines the entire ETL process thereby reducing manual effort.
Learn more
Transform with Examples

Transform by example easily helps you transform the data in any column to your needs just by providing examples of the output.
Learn more
Ask Zia for Data Analysts and Business Users
Build reports and dashboards using simple natural language. Get contextual narratives to understand the What and Why behind any scenario.
Smarter Report Creation

While users have always been able to build reports using Ask Zia, the new LLM-powered enhancements significantly improve the experience. With LLMs now driving report creation, Ask Zia better understands your queries, recommends the most relevant visualizations, and delivers deeper, more meaningful insights.
Learn more
Dashboard Creation Made Easy

Build fully functional dashboards using natural language prompts. Describe your requirements, and Ask Zia brings together the most relevant reports, applies filters, and arranges them into a customizable dashboard ready to share, explore, and act on.
Learn more
Get Actionable Insights and Smart Recommendations

Data analysts and business users no longer need to sift through multiple reports to uncover key insights. While Ask Zia has supported descriptive and predictive insights, it now goes further by offering diagnostic and prescriptive insights, helping you understand why something happened and recommendations for what actions to be taken next. This empowers you to move from insights to action faster.
Learn more
Create Data Stories Using Slideshow Skills

Turn insights into impactful data stories. Create slideshows directly from reports and dashboards. Just use a simple prompt, and Zia will compile key visuals and narratives into a ready-to-present deck, saving you time and effort.
Learn more
Take Instant Actions

With Action Skills, you can instantly share reports, schedule email deliveries, and export dashboards within the Ask Zia portal without switching tabs.
Learn more
Embed Ask Zia Anywhere

Embed Ask Zia directly into the applications you work with. Ask questions, explore data, detect patterns or anomalies, and identify the key factors driving the metrics without switching platforms. Ask Zia is context aware, and insights are provided based on the user's role, data context, and access permissions.
Learn more
Build Custom Agents with MCP server

The Zoho Analytics MCP Server (Beta) implements the Model Context Protocol (MCP), a standardized interface that enables AI models to interact seamlessly with applications. This middleware solution bridges the connection between AI agents and Zoho Analytics, providing powerful data analysis capabilities through a unified interface.
Learn more
Jun
11 June, 2025
AutoML Enhancements
We’re thrilled to introduce powerful new AutoML enhancements, making machine learning more flexible and efficient than ever! Now, you can effortlessly retrain multiple models at once and bulk delete outdated models, streamlining your workflow for faster, smarter predictions.
Learn more.
"What If" in AutoML
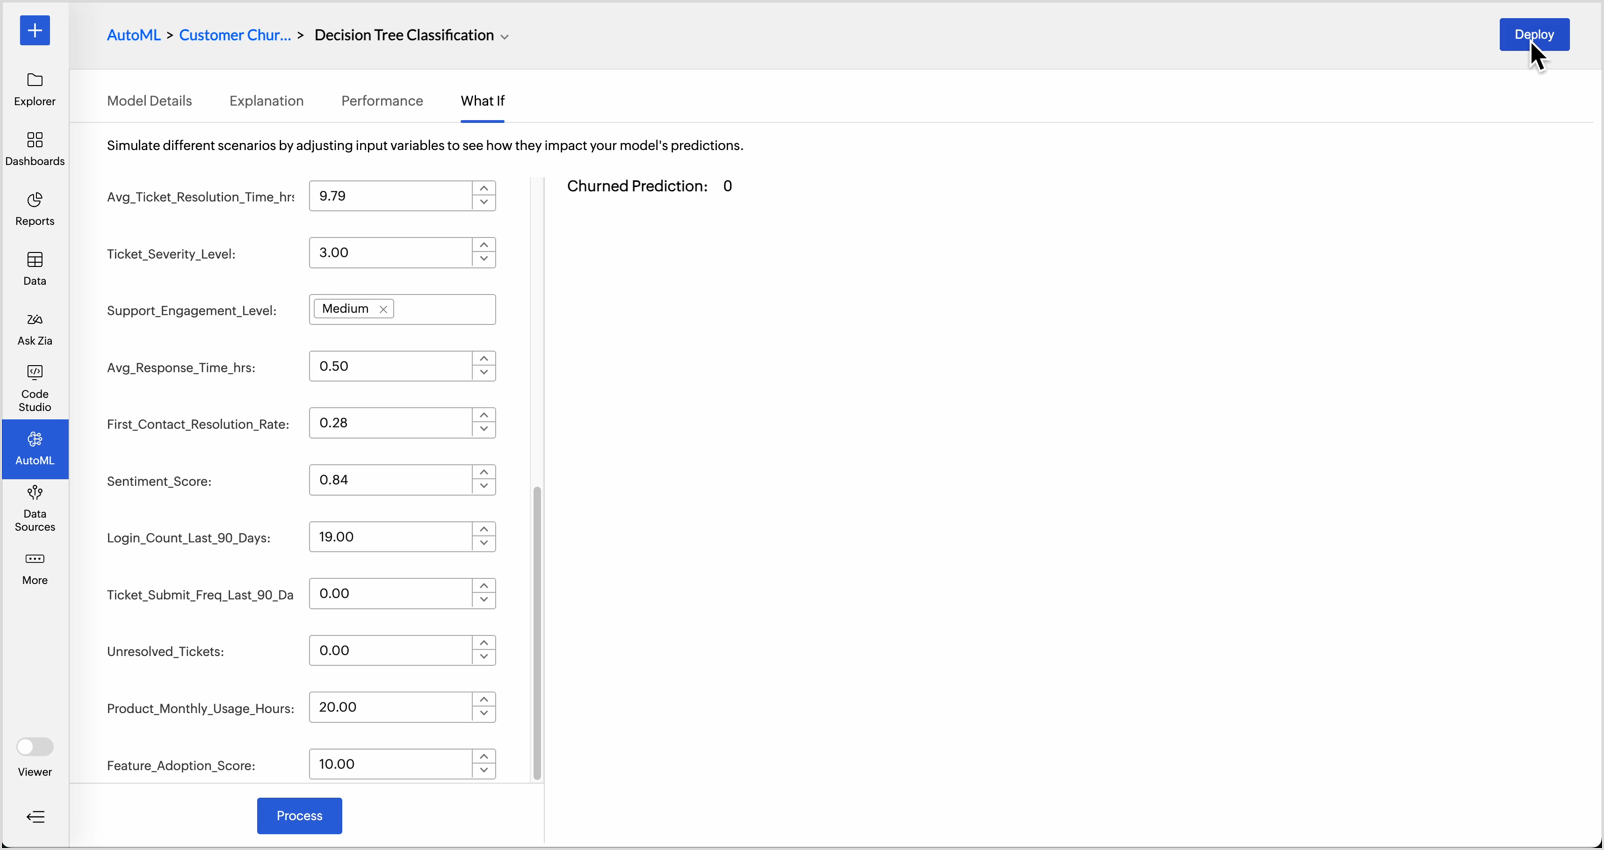
Unlock deeper insights with the new "What If" analysis in AutoML! Easily test different scenarios, tweak input variables, and instantly see how predictions change, empowering you to make data-driven decisions with confidence.
Learn more.
Hourly Data Syncs Now Available for Business App Connectors
We’re excited to announce that the Premium and Bundle plan users can sync their business app data every hour in Zoho Analytics. With this new scheduling option, your data imports will refresh every hour, ensuring you always have the freshest insights at your fingertips.
Zia Insights Enhancements
We’ve supercharged Zia Insights with Diagnostic: Time Series (Target vs Previous) support! Now, effortlessly compare your time-series forecasts against historical data, ensuring more accurate trend analysis and better decision-making.
Learn more.
Enhancements in Pivot Conditional Formatting

Say hello to a sleeker, more intuitive Pivot Table experience! Our enhanced conditional formatting now brings all icons and color bands into a single, unified interface, making it easier than ever to highlight key trends.
Learn more.
JDBC Driver Support in Zoho Analytics V2 API
We’re bringing JDBC Driver support to the Zoho Analytics V2 API! Now, seamlessly connect, query, and analyze your data with enhanced compatibility and performance—unlocking even more integration possibilities.
Learn more.
KPI Widgets – New Editor
Experience a completely revamped UI for the KPI Widget Editor! With a fresh, modern design, creating and customizing KPI widgets is now faster, smoother, and more intuitive than ever.
Learn more.
Microsoft Advertising Connector – New Modules
We’ve expanded our Microsoft Advertising Connector with new modules! Gain deeper insights into your ad performance, track campaigns more effectively, and optimize your marketing strategies—all within Zoho Analytics.
Learn more.
Zoho Marketing Automation – New Modules
Supercharge your marketing analytics with new modules in Zoho Marketing Automation! Easily track who opened your campaigns, when, and from where, and gain clearer visibility with new lead data like Sent Date.
Learn more.
Mar
12 March, 2025
Common Query Table Expression (CTE) support in Query Tables
We’ve added support for Common Table Expressions (CTE) in Query Tables, making it easier to write, manage, and optimize complex queries. With CTEs, you can break down large queries into modular, reusable components for better readability and performance.
Learn more
Move tables in different schedules to a common schedule
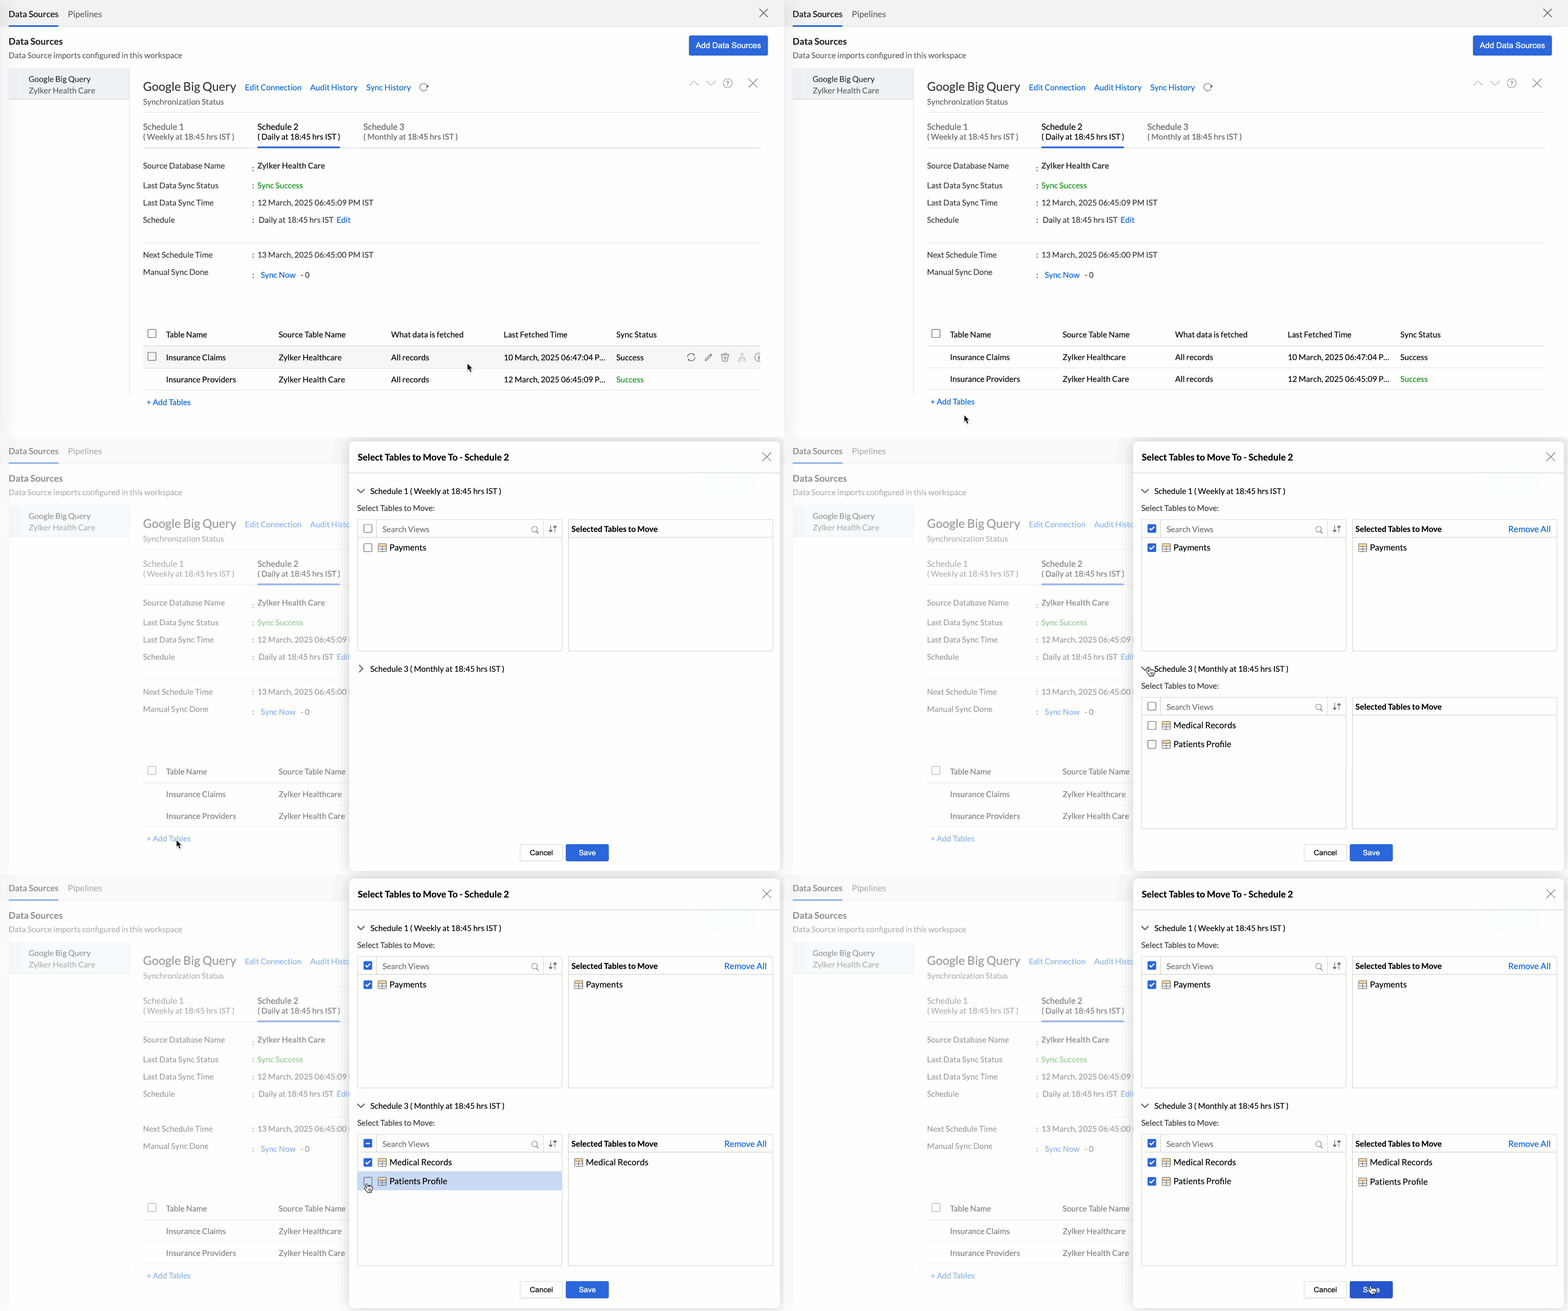
With the latest enhancement, you can choose tables from different schedules all at once and move them to a common schedule.
Learn more
Specify Dataset Location in Google BigQuery Integration

You can now define the dataset location when importing data from Google BigQuery into Zoho Analytics. This enhancement provides more flexibility and better performance when working with BigQuery data in Zoho Analytics.
Learn more
Pivot View Enhancements
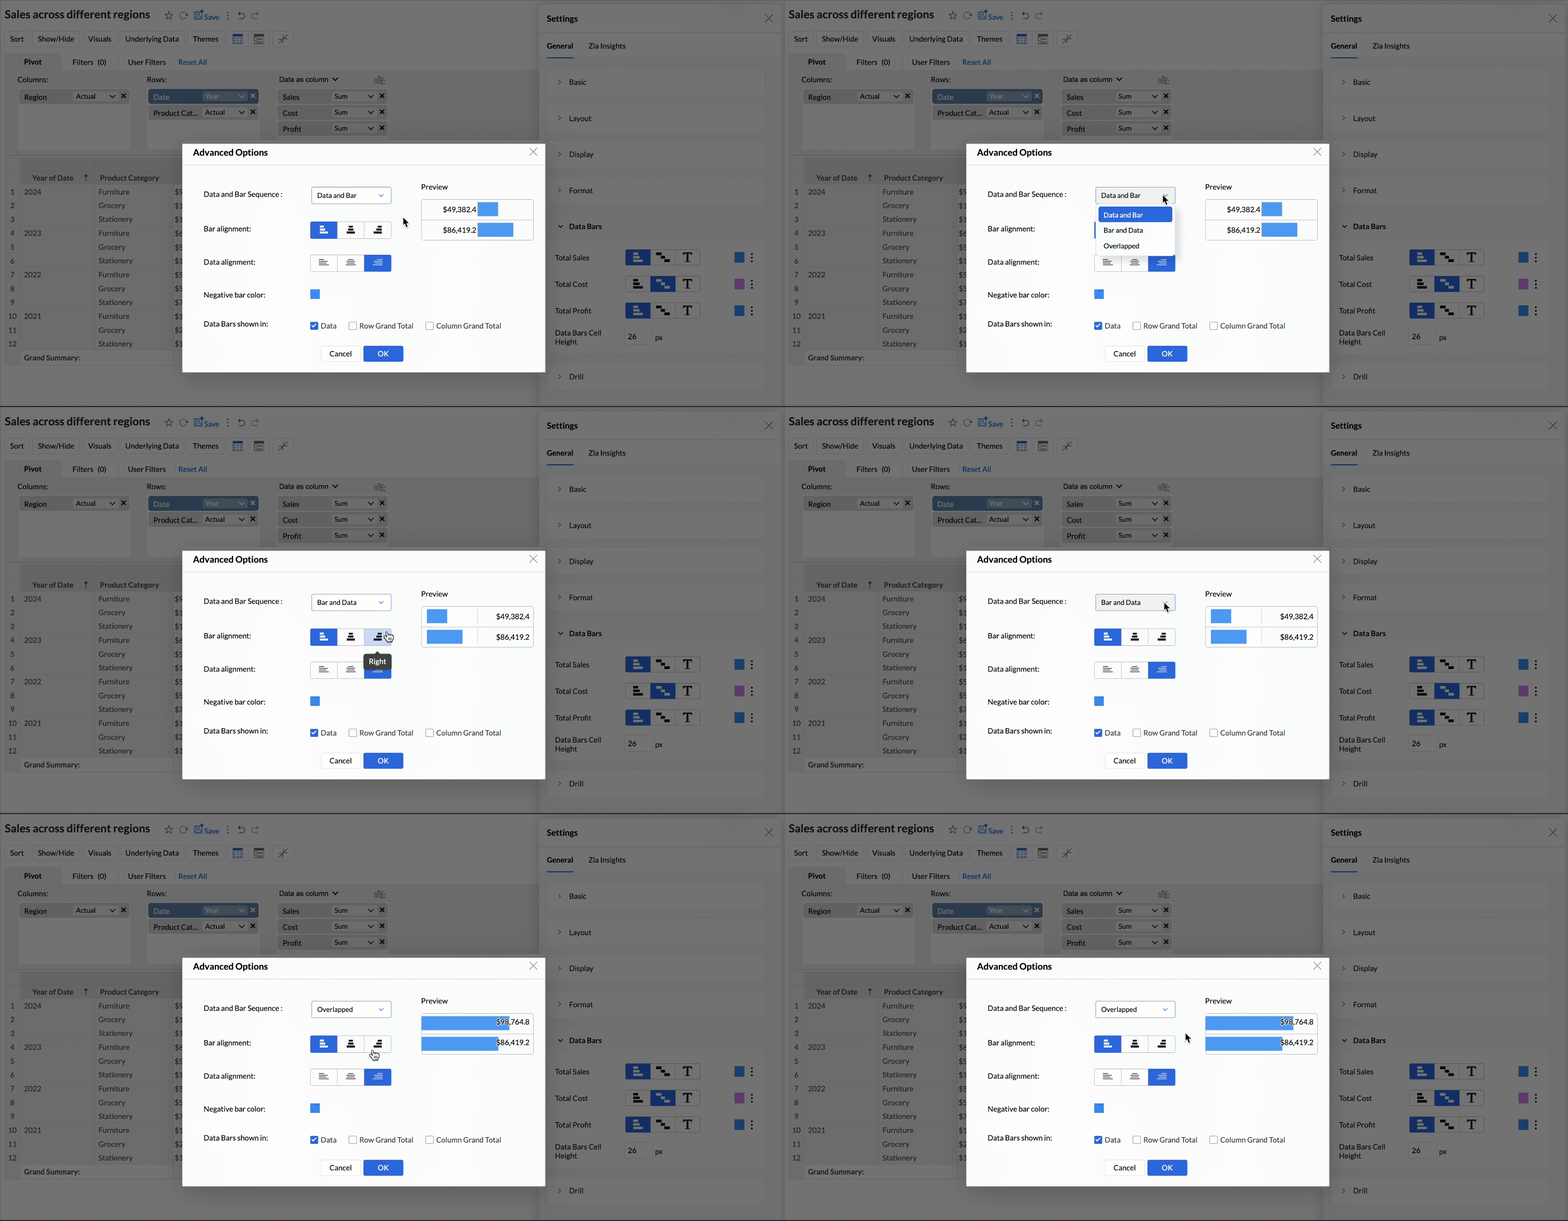
- Display Sequence: A new option Overlapped is now available, displaying values overlapping the bars.
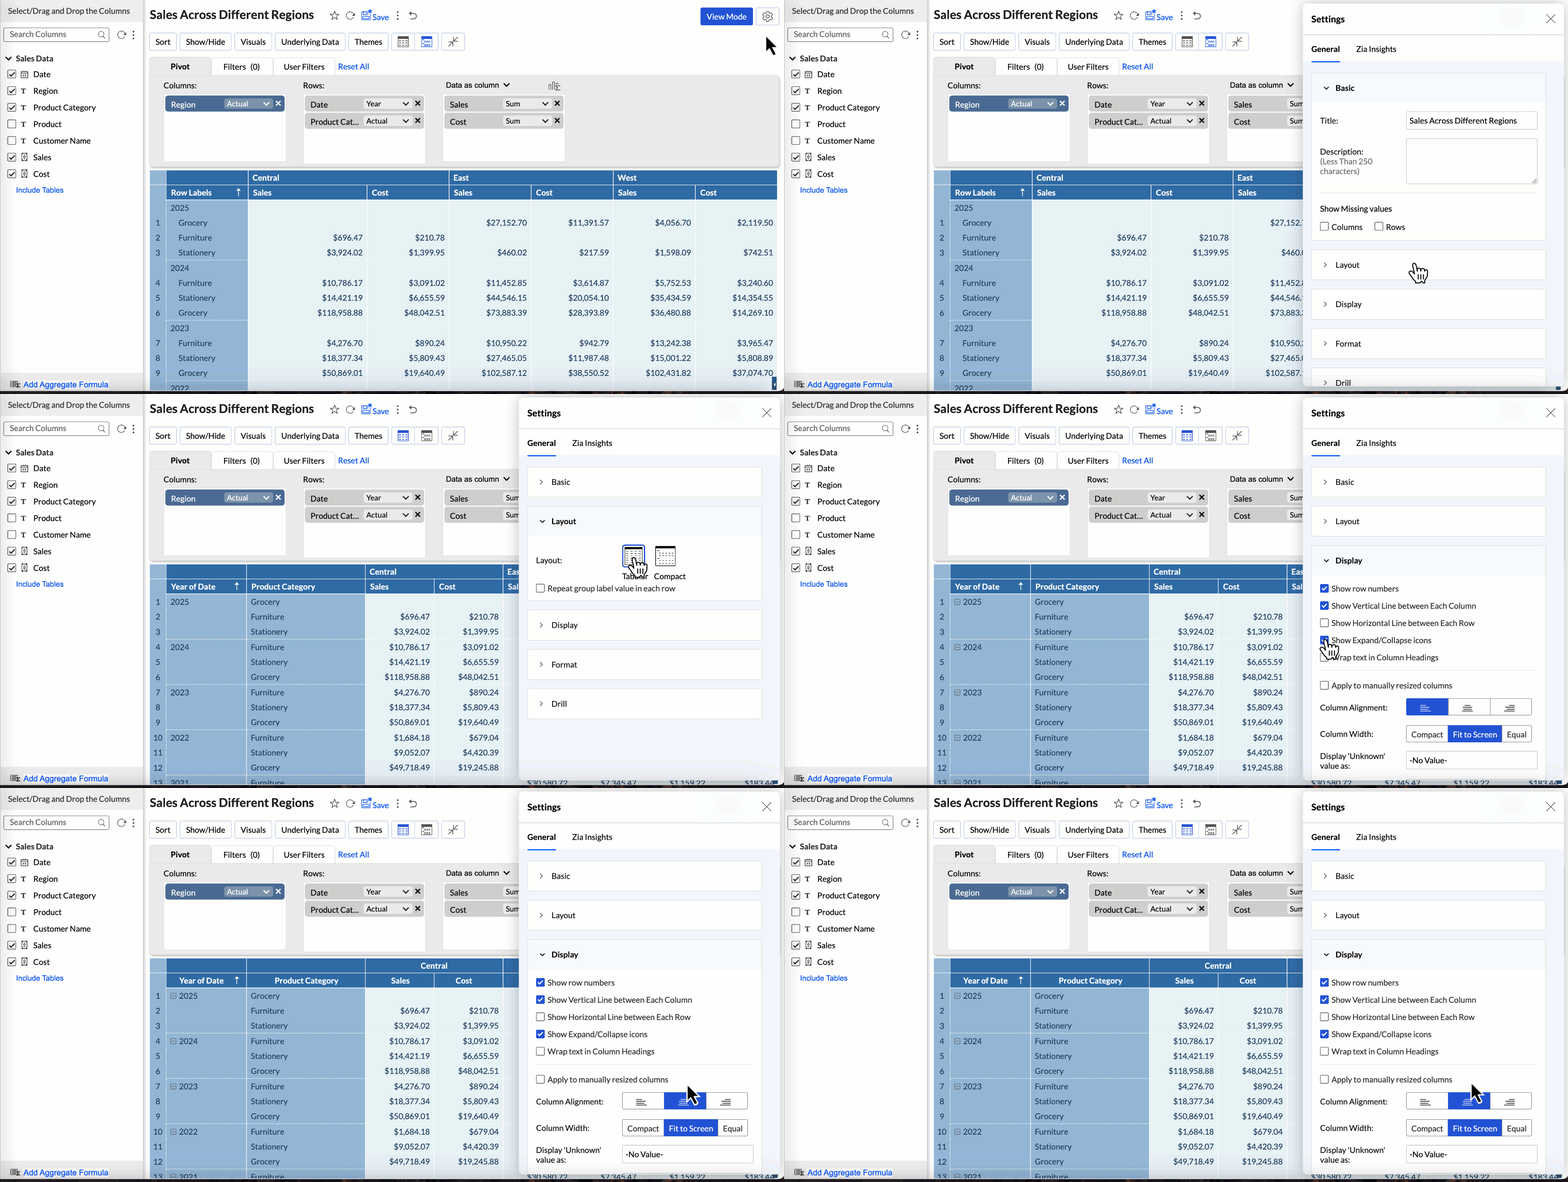
- Pivot Settings: The pivot settings pane now features an improved user interface for a more seamless experience. Settings are dynamically updated in real time as you make changes, ensuring better control and efficiency.
Images and URL association support for KPI Widgets
KPI widgets now support associated URLs and images, allowing you to display data values alongside visuals like country flags, product images, and more for a richer, more informative dashboard.
Learn more
Zoho Analytics API Collection in Postman
Zoho Analytics API collection is now available in Postman, making it easier to explore, test, and integrate its APIs seamlessly. With this update, you can efficiently manage API requests and validate responses within the Postman environment.
Learn more
Jan
January 16, 2025
Elevate your on-the-go analytics experience with the latest enhancements in the Zoho Analytics - Mobile BI App. These updates ensure a seamless, visually consistent, and feature-rich experience across mobile devices.
Here’s what’s new:
Enhanced Chart & Widget Support
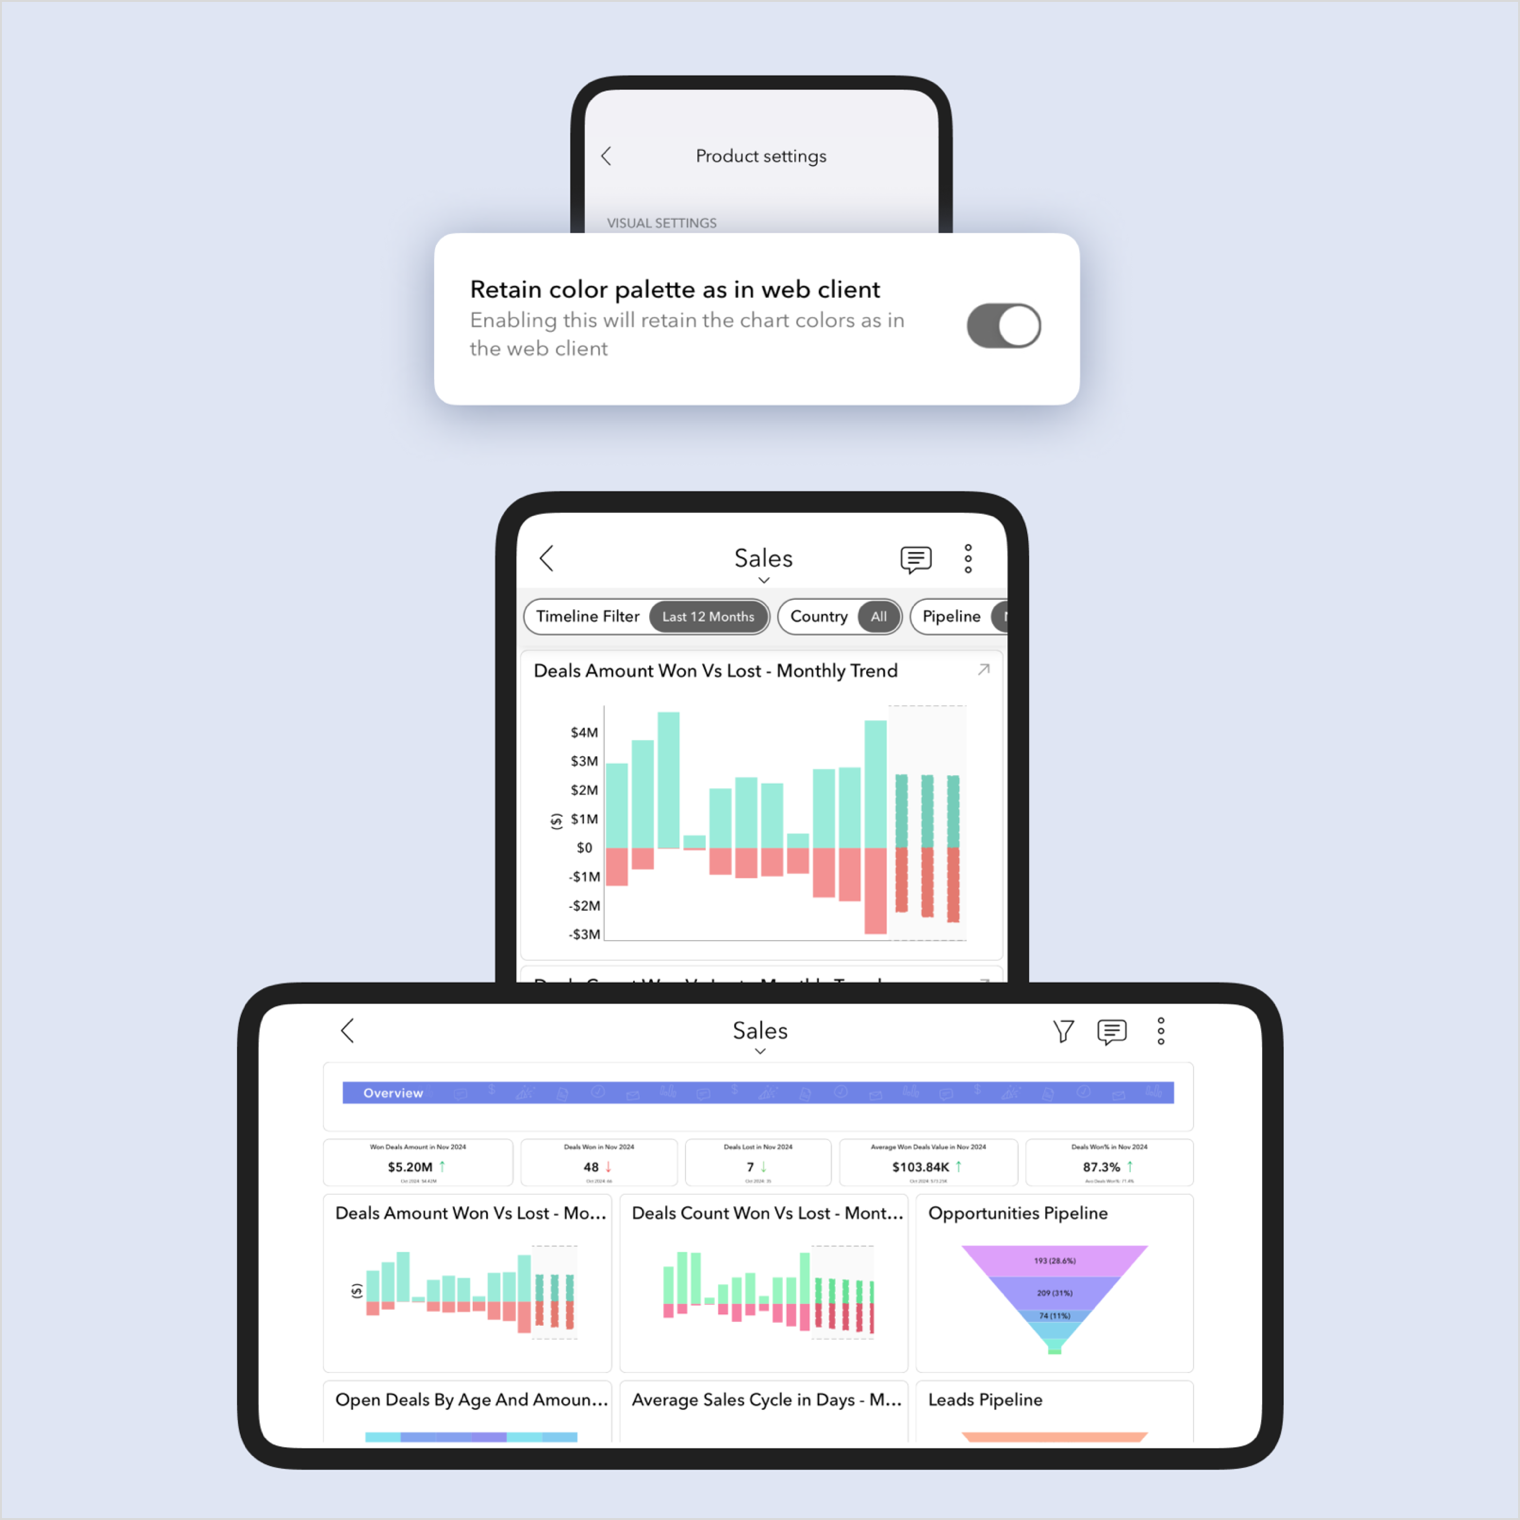
Custom Formatted Colors for Charts
Retain your custom color settings with the new "Retain color formatting" option, ensuring consistency in your chart visuals across web and mobile.
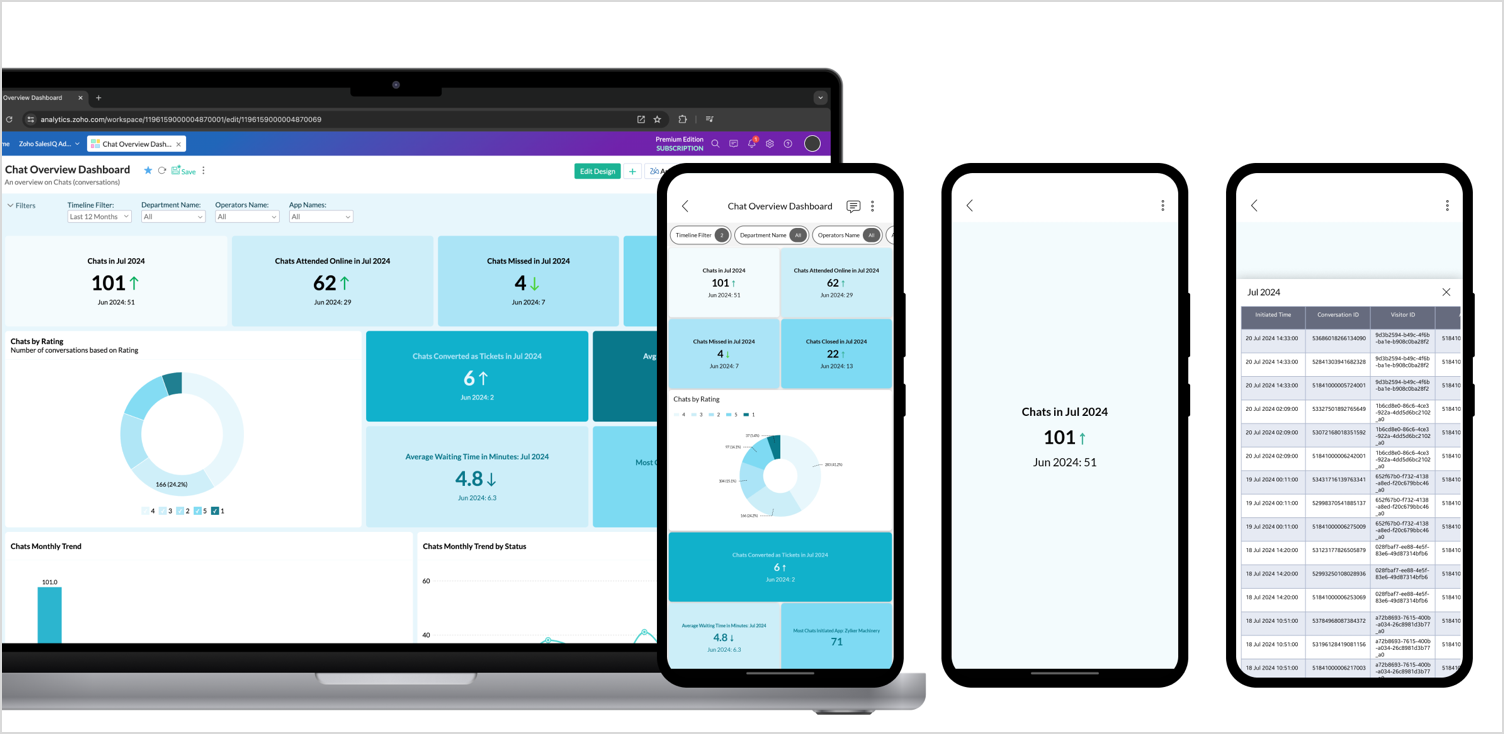
KPI Widget Enhancements
Retain the colors and styling set for KPI widgets, and get deeper insights by viewing key metrics in full view and accessing View Underlying Data (VUD) for detailed analysis.
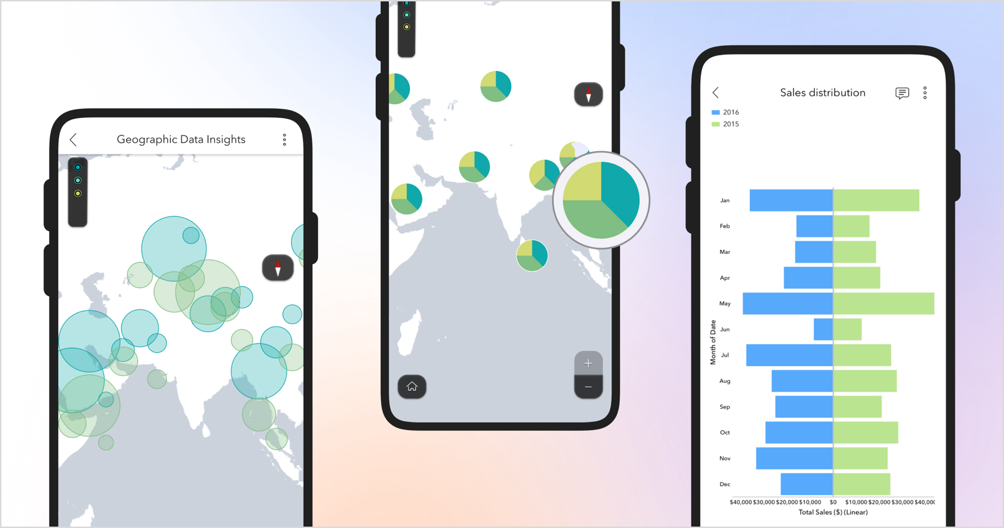
New Chart Support
Explore new visualizations, including Butterfly, Map Pie, Map Bubble, and Map Bubble Pie charts for richer data storytelling.
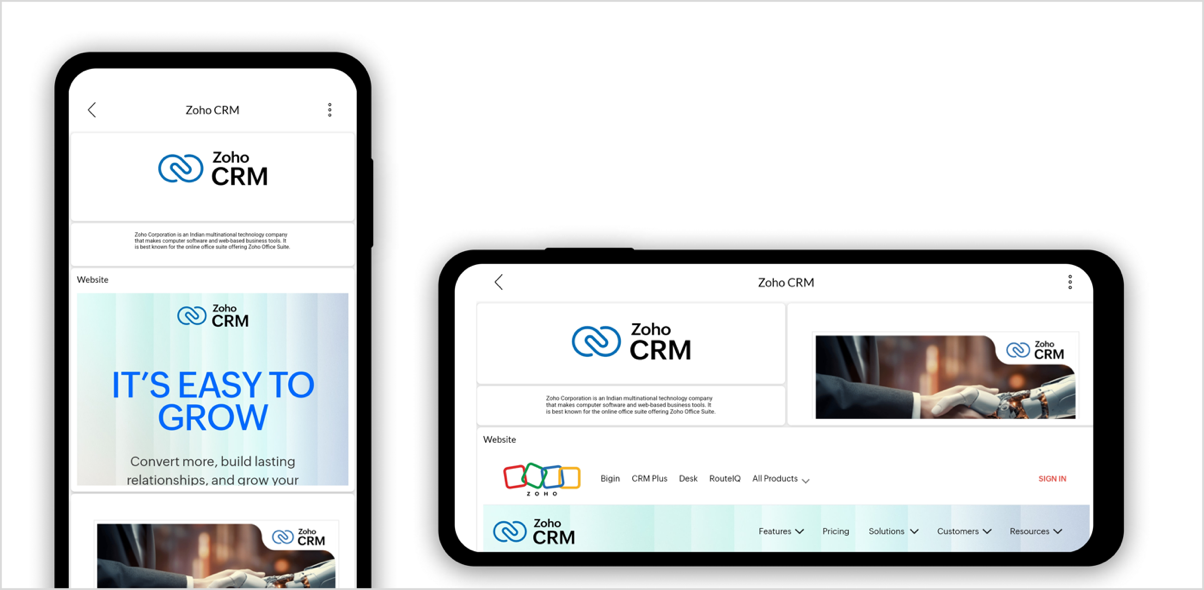
Support for Text, Image & Embed Elements
Seamlessly view and interact with Text, Image, and Embed elements in dashboards.
Improved Data Display and Formatting
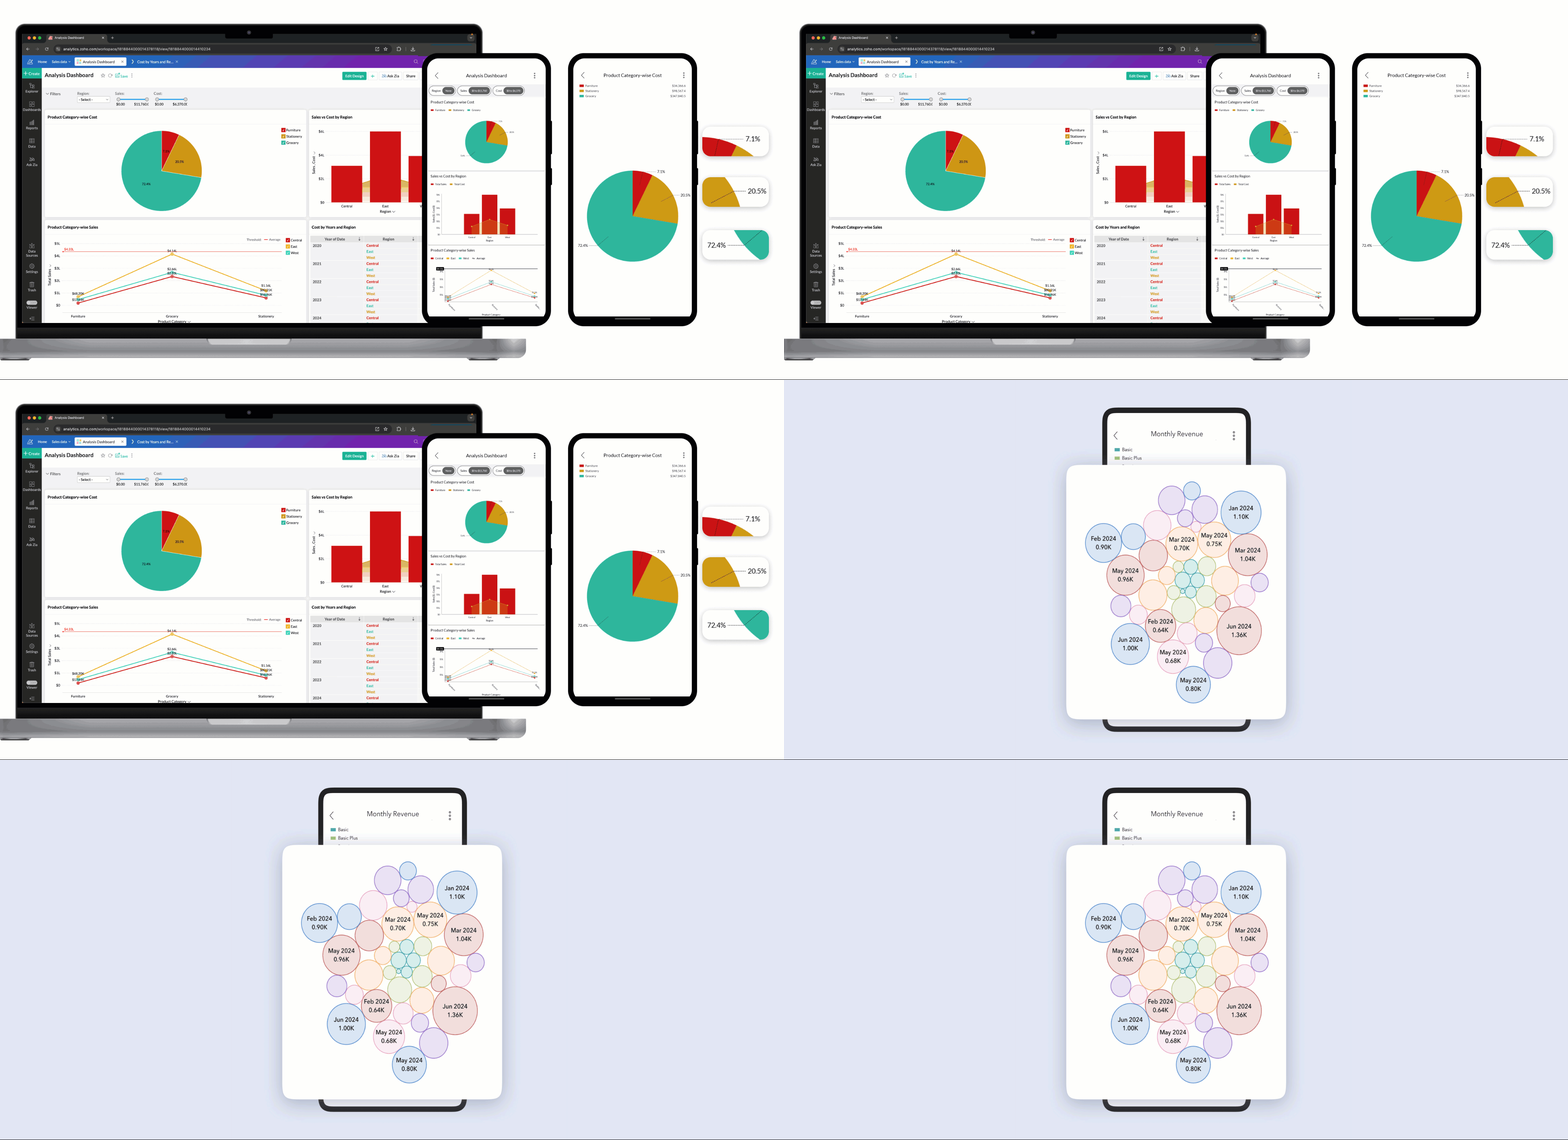
Data Label Configuration & Enhancements
Your web-configured data labels are now preserved on mobile, with improved clarity, alignment, and skip logic to prevent overlaps.
Conditional Formatting
Tables with conditional formatting applied in the web version now display perfectly on mobile for better context.
Web Theme Palette
The web theme palette is now retained in the mobile app, maintaining a consistent design.
Dashboard Enhancements
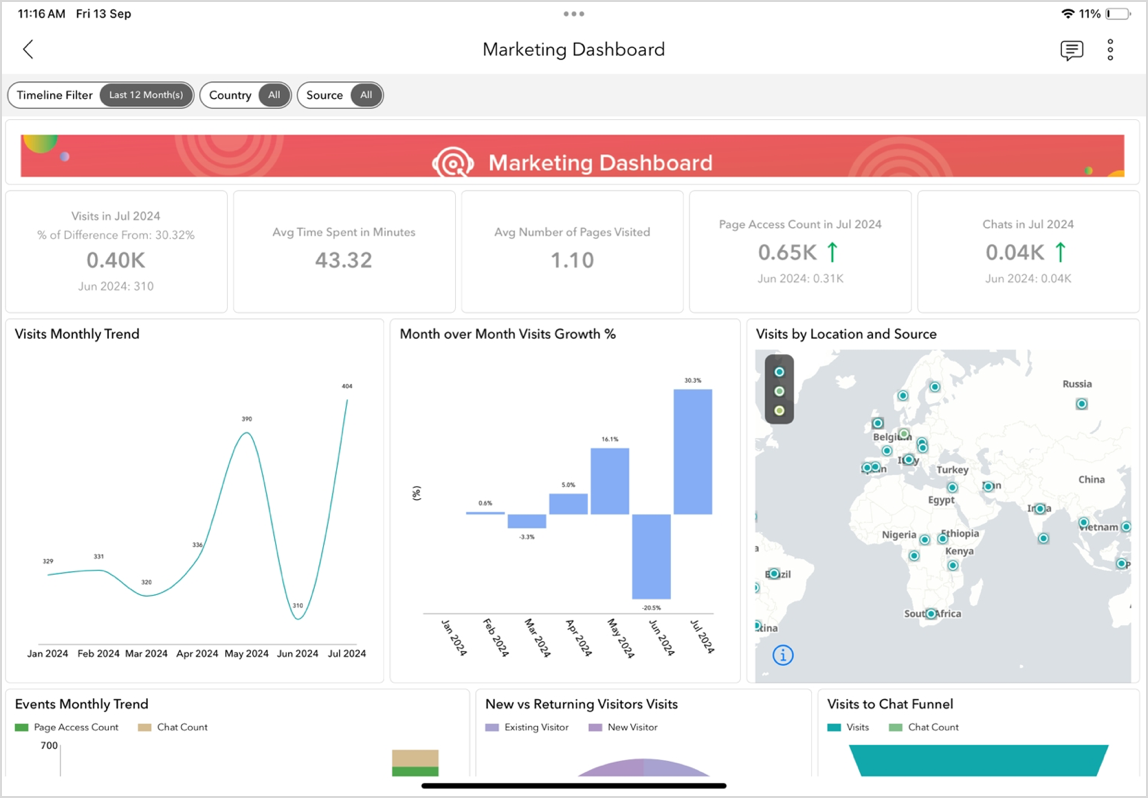
Retain Dashboard Layout
Ensure your dashboards look the same as they do on the web when using iPads, tablets, or mobile devices in landscape mode.
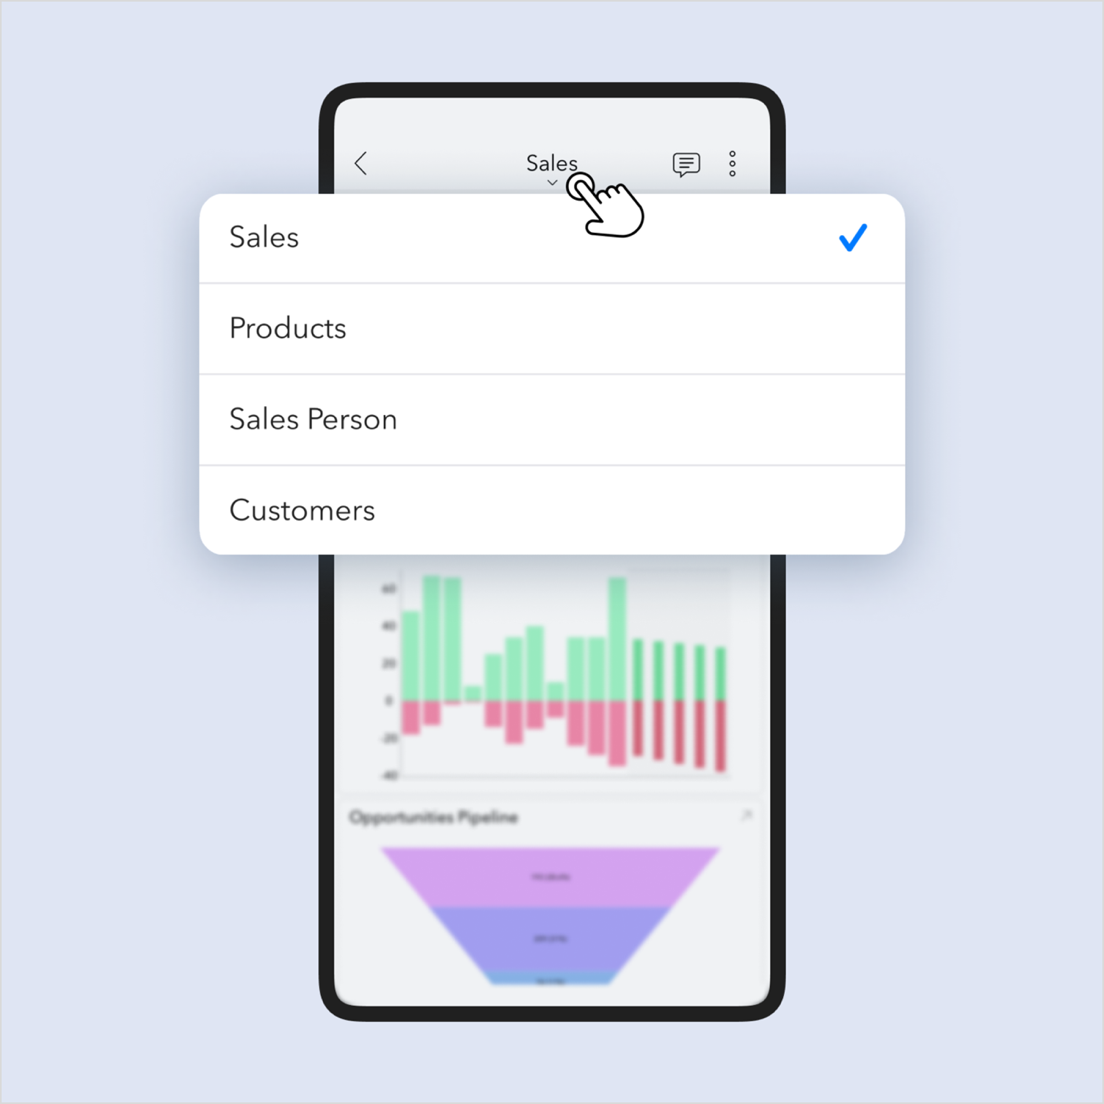
Tabbed Dashboards
Effortlessly switch between tabs in dashboards with the newly enhanced tabbed UI.
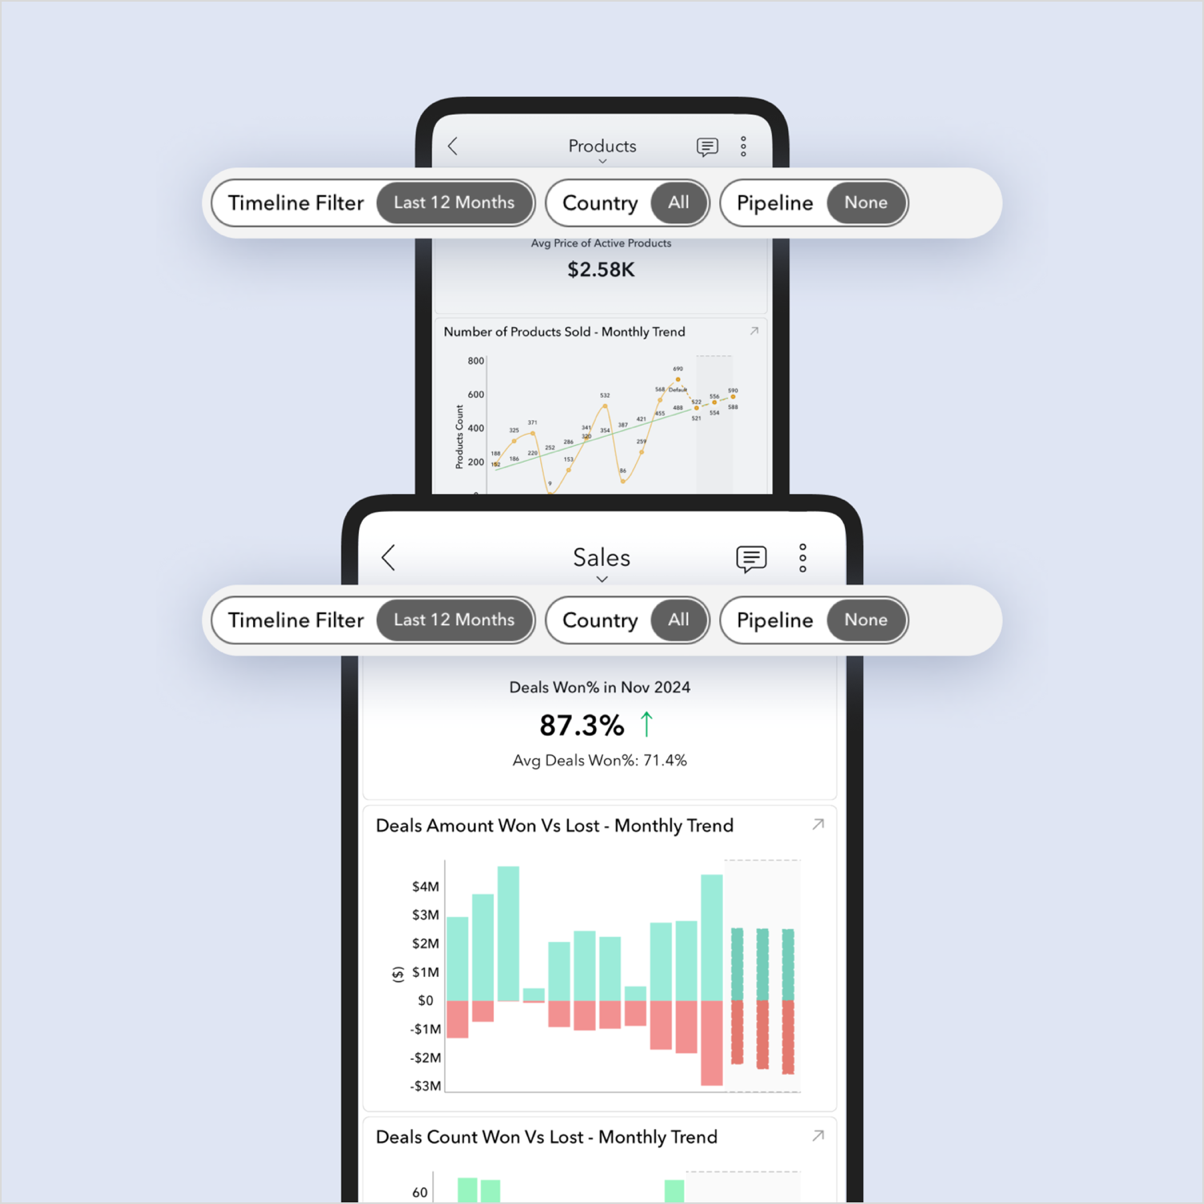
Global User Filter
Apply unified filters across reports on mobile with support for the global user filter.
Expanded Functionality
Web View Access
Enable Web View to access features in reports that are only available on the web version, delivering a more comprehensive experience.
Update your Zoho Analytics - Mobile BI app today and explore these powerful features designed to deliver a seamless and interactive analytics experience, wherever you are!
Download the Zoho Analytics - Mobile BI App
2024
Dec
30 December, 2024
Hello Users!
We’re excited to bring you a roundup of the latest features and improvements in Zoho Analytics. These updates are designed to elevate your data analytics experience, making it more powerful, interactive, and seamless. Let’s dive in!
Expanded Database Support
Say hello to four new databases that now support live connect
Effortlessly integrate your data from these sources and start generating actionable insights with real-time connectivity.
Zoho Writer Integration
Turn your data into captivating visuals with the Zoho Analytics extension for Zoho Writer.
- Seamlessly create stunning infographics.
- Create instant infographics directly within Zoho Writer for each page and effortlessly simplify data storytelling and deliver impactful visuals on the go!

Enhanced Sankey Chart Interaction
The Sankey Chart just got better!
- Click on any data point to trace the entire flow, from start to finish, for a clearer understanding.
- This enhancement makes navigating and interpreting your data smoother than ever.

New Modules/Fields
- Salesforce: Account Contact Roles, Opportunity Splits, Opportunity Product Splits, Line Item Schedule.
Learn more. - Zoho Books: MRR (Monthly Recurring Revenue), Subscription Activity.
Learn more. - Zoho Projects: Roll-up Enabled field in the Projects module.
Learn more.
Code Studio Enhancements
Now, Workspace Admins can access Code Studio! This enables more control and customization to meet your business needs.
Learn more.
Tabular View: Wrap & Clip Text
Manage lengthy headers in tabular views effortlessly with two new options:
- Wrap Text for improved readability.
- Clip Text to maintain a compact layout.

Sep
Announcing Zoho Analytics 6.0 - An AI Powered Self-Service BI & Analytics Platform!
At Zoho Analytics, our mission is to democratize analytics for everyone. We recognize that team members across an organization rely on data to make both simple and complex decisions every day. These tasks shouldn’t require ongoing support from IT and data teams, even for basic visualizations.
That’s why we’re excited to announce the launch of Zoho Analytics 6.0! This powerful new version brings together business users, data analysts, data engineers, and data scientists on a single platform, making data-driven decision-making easier and more accessible for all. Welcome to a new era of analytics!
New capabilities in this release
- Data Connectors and Data Management
- Visual Analytics
- Generative AI Infused Analytics
- Predictive AI
- Data Science & Machine Learning Studio
- Platform Extensibility
- Security Enhancements
- Other Updates
Data Connectors and Data Management
New Connectors
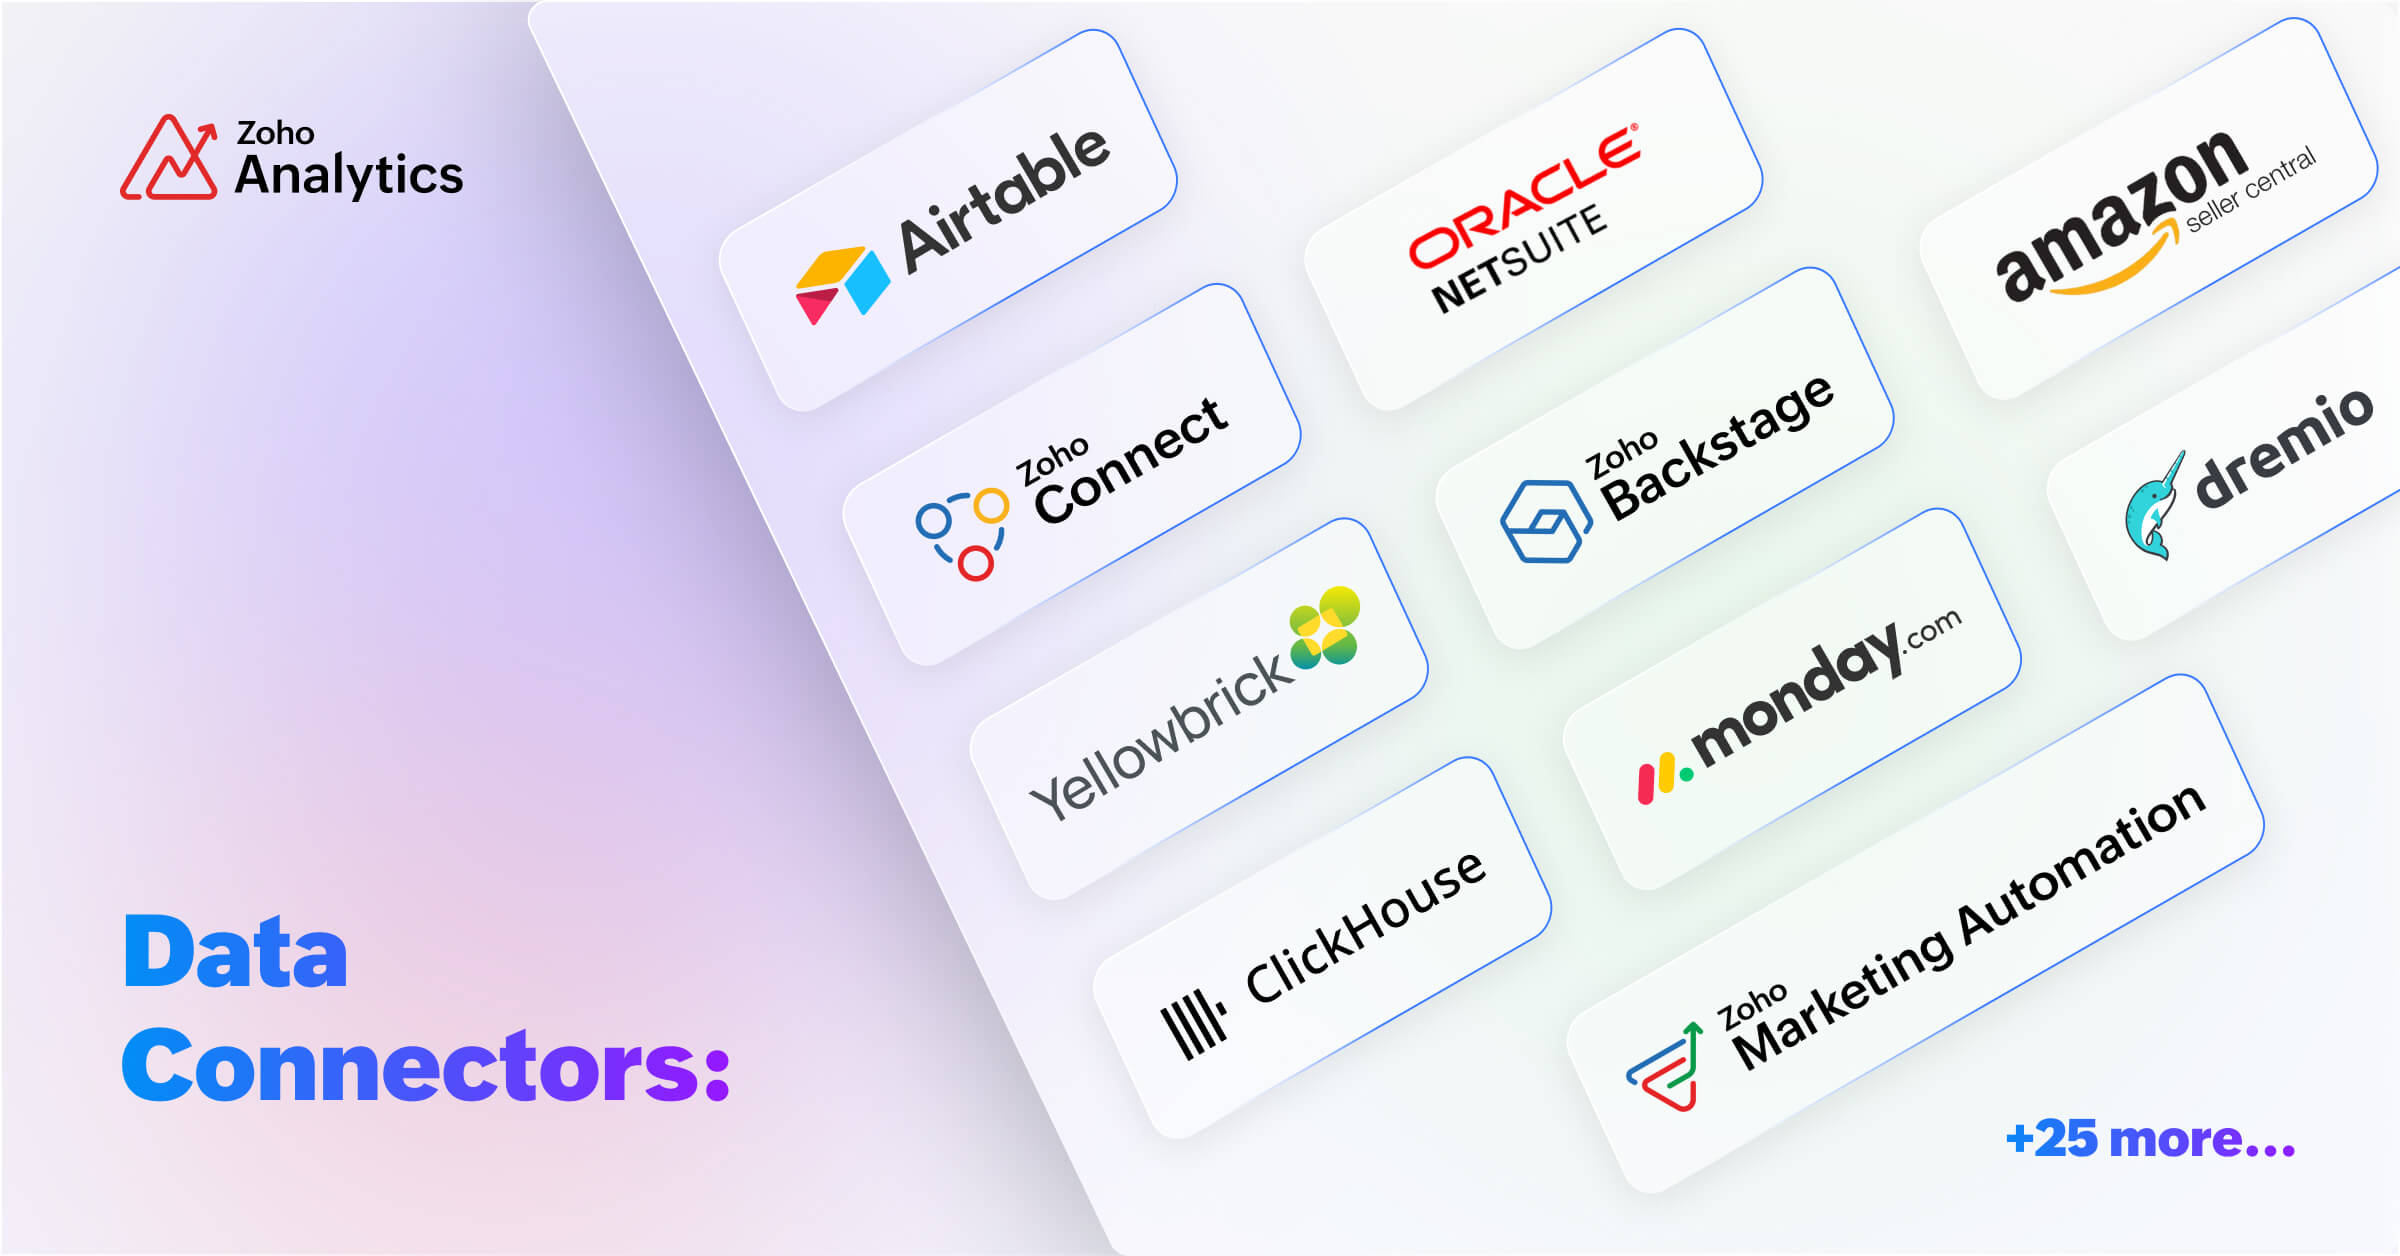
We are enhancing our existing portfolio of over 500+ advanced analytics connectors by adding more than 25 connectors to this list. These additions cater to big data platforms and business applications, including Yellowbrick, ClickHouse, Dremio, Oracle Netsuite, Databricks, Monday.com, Airtable, Qualtrics, ClickUp, and several others.

Effectively analyze your data from different business applications by using our pre-built reports and dashboards. Additional features in Zoho Analytics like Sync history, Audit History, and Undo Import allow you to manage all data sources, including the connectors.
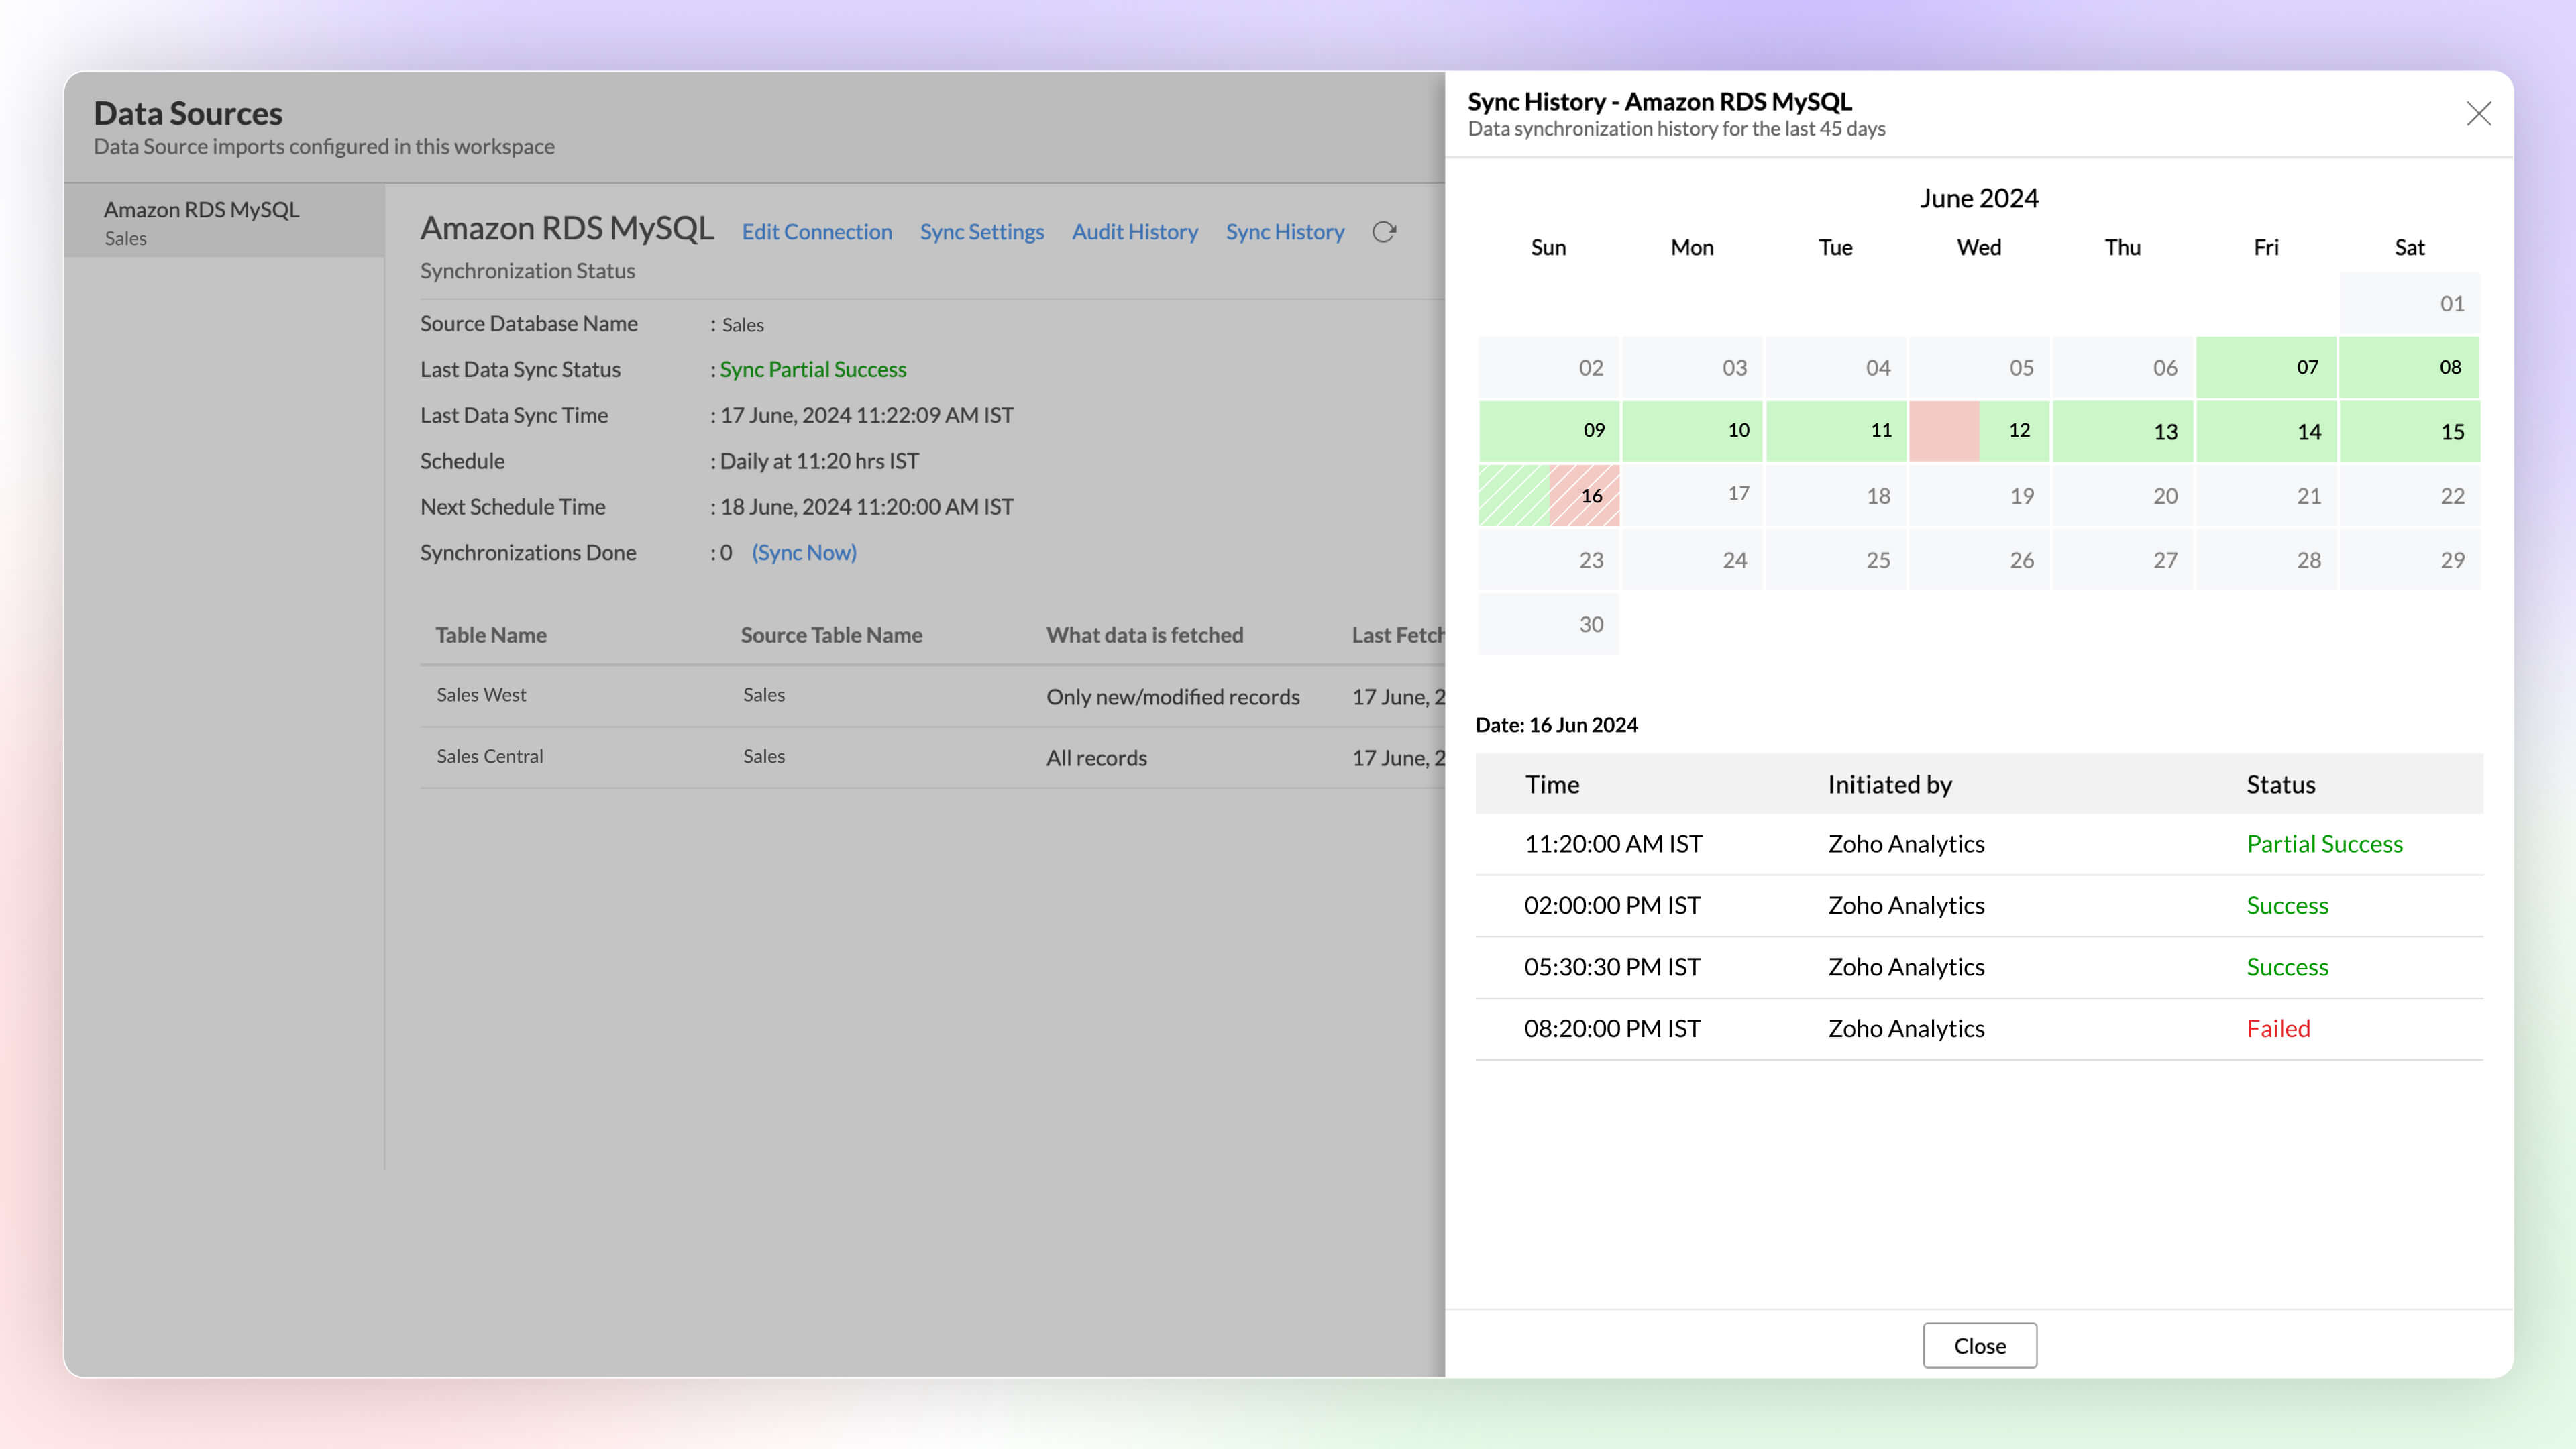
Sync History
Get a detailed overview of data synchronization activities using Sync history in Zoho Analytics. It helps administrators monitor the status of each sync easily, as successful syncs are highlighted in green, while failed syncs appear in red, along with reasons for the failure and required actions.
Learn more.
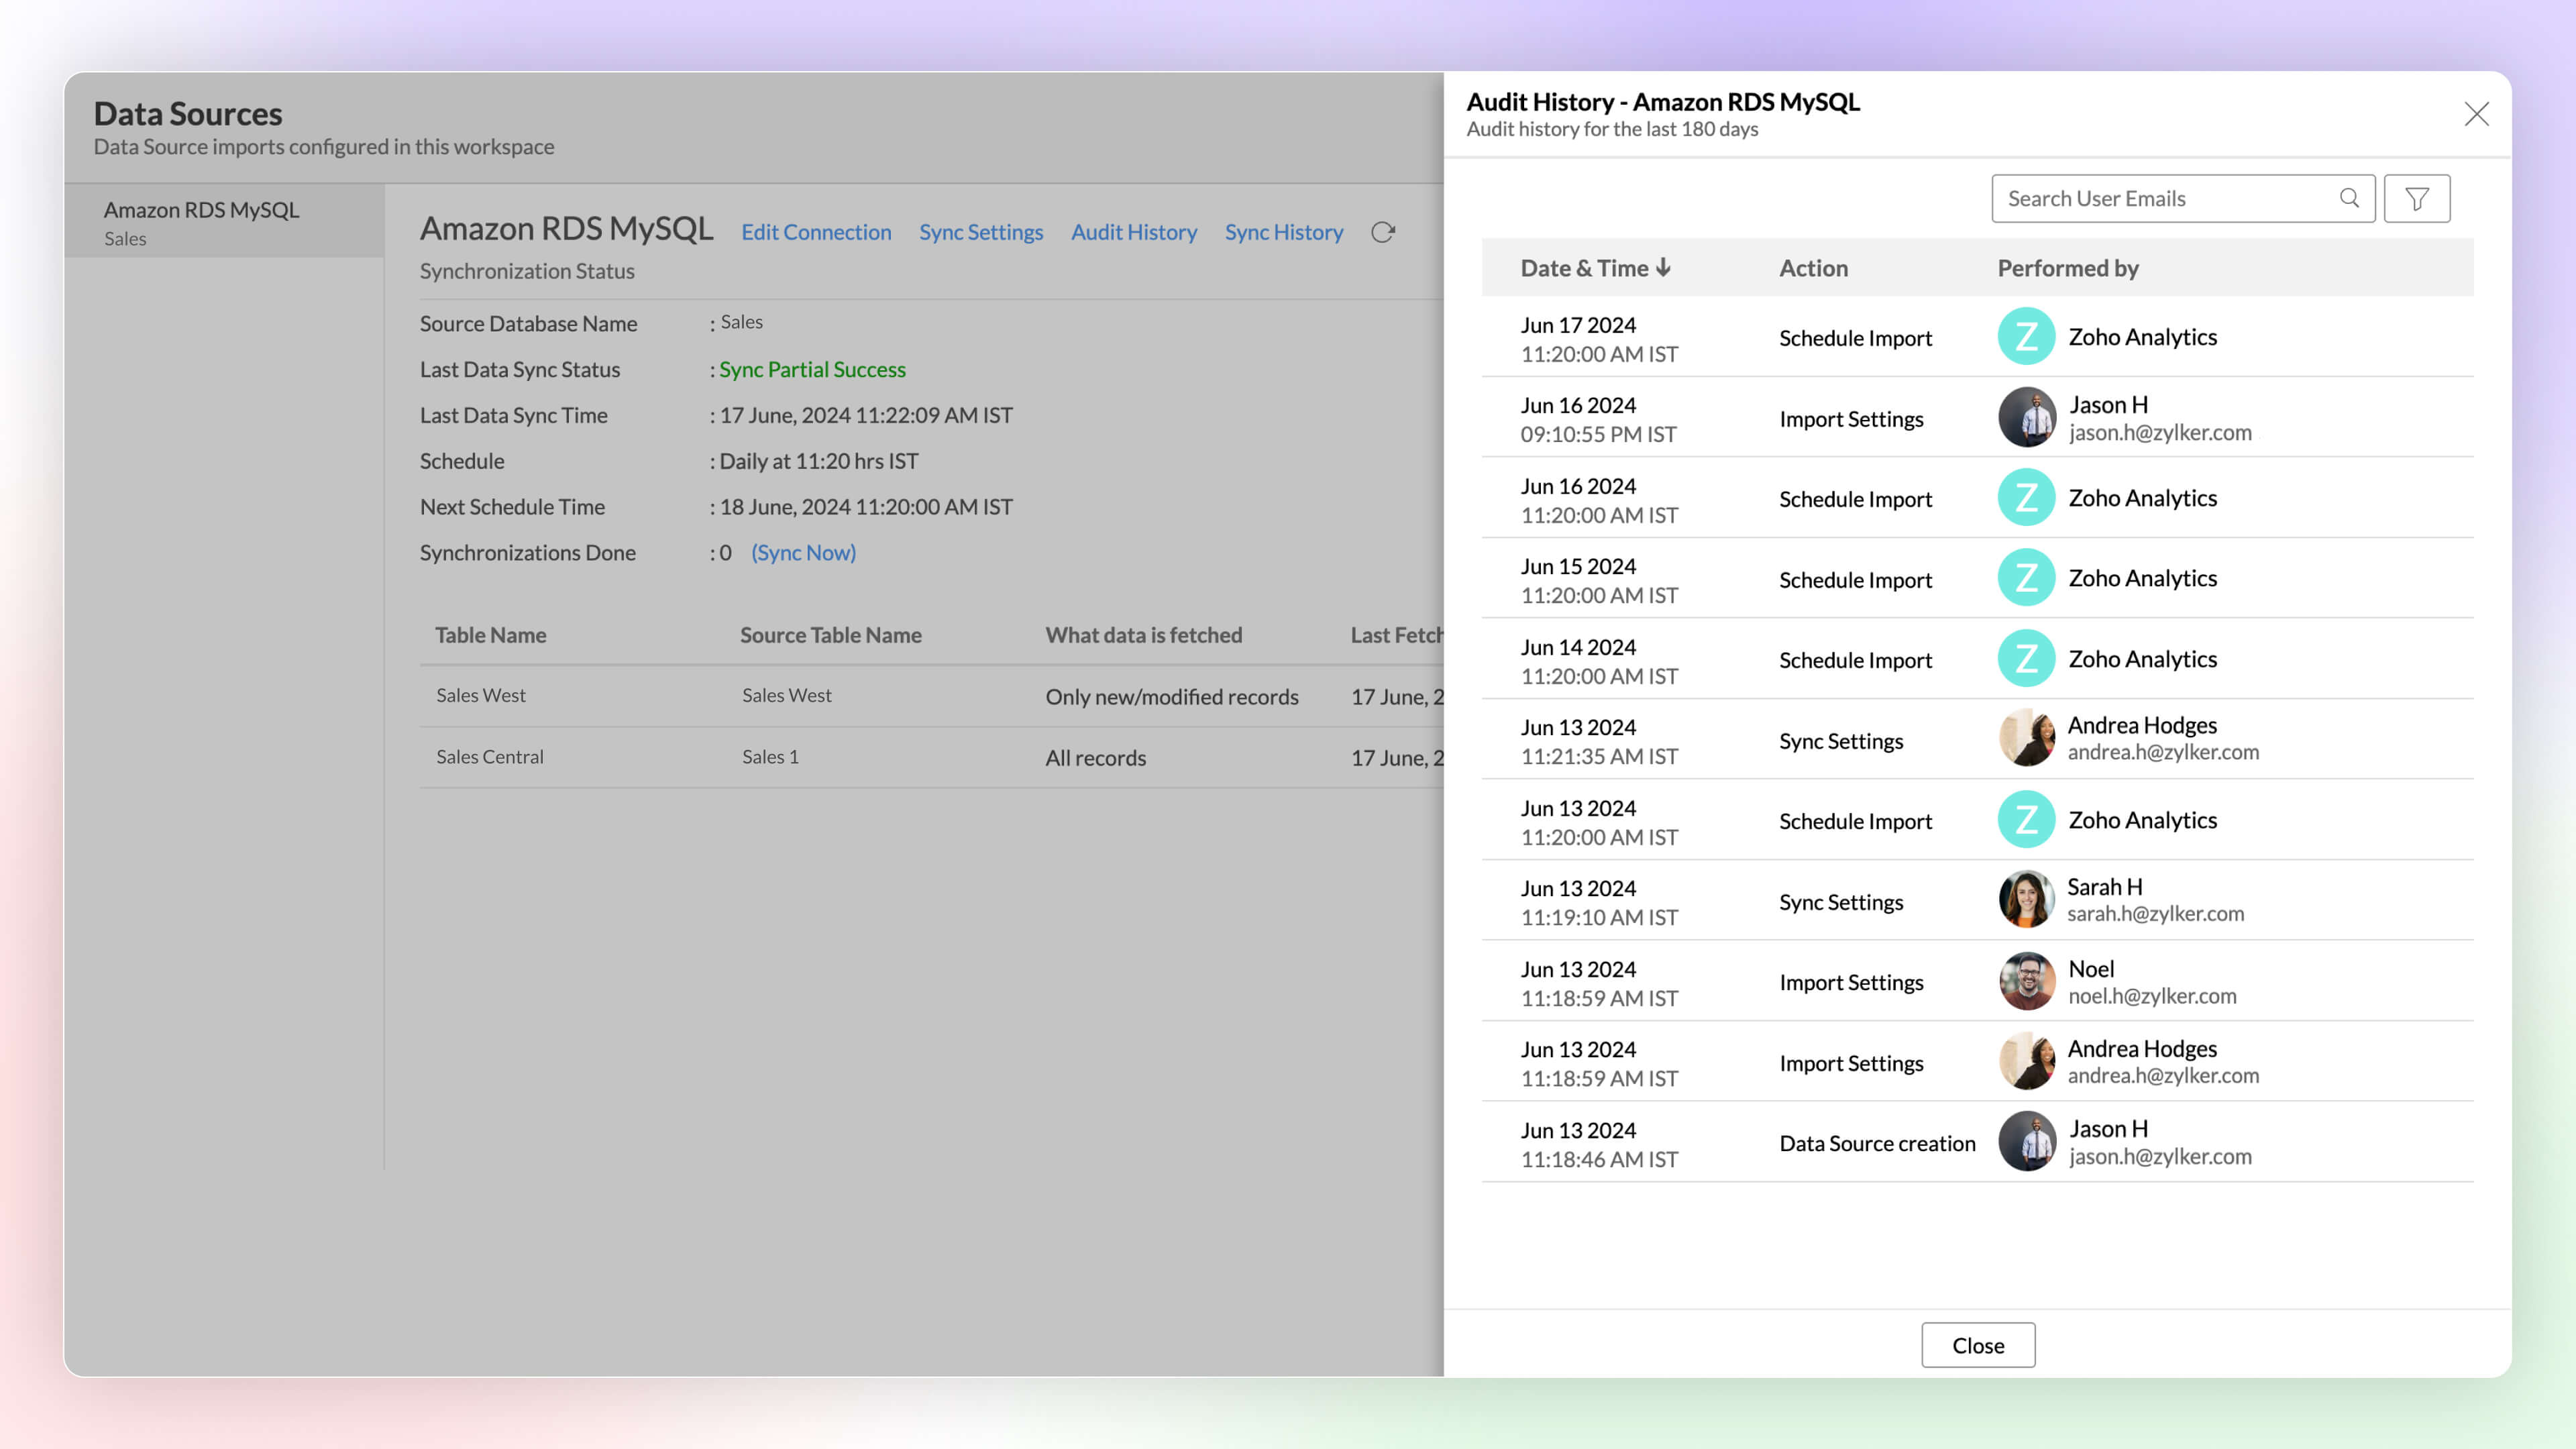
Audit History
Keep a full track of user and system activities using Audit History in Zoho Analytics. it helps you ensure security and resolve issues easily, using the timestamps and details of the administrator responsible for each action.
Learn more.
Undo Import Enterprise Plan
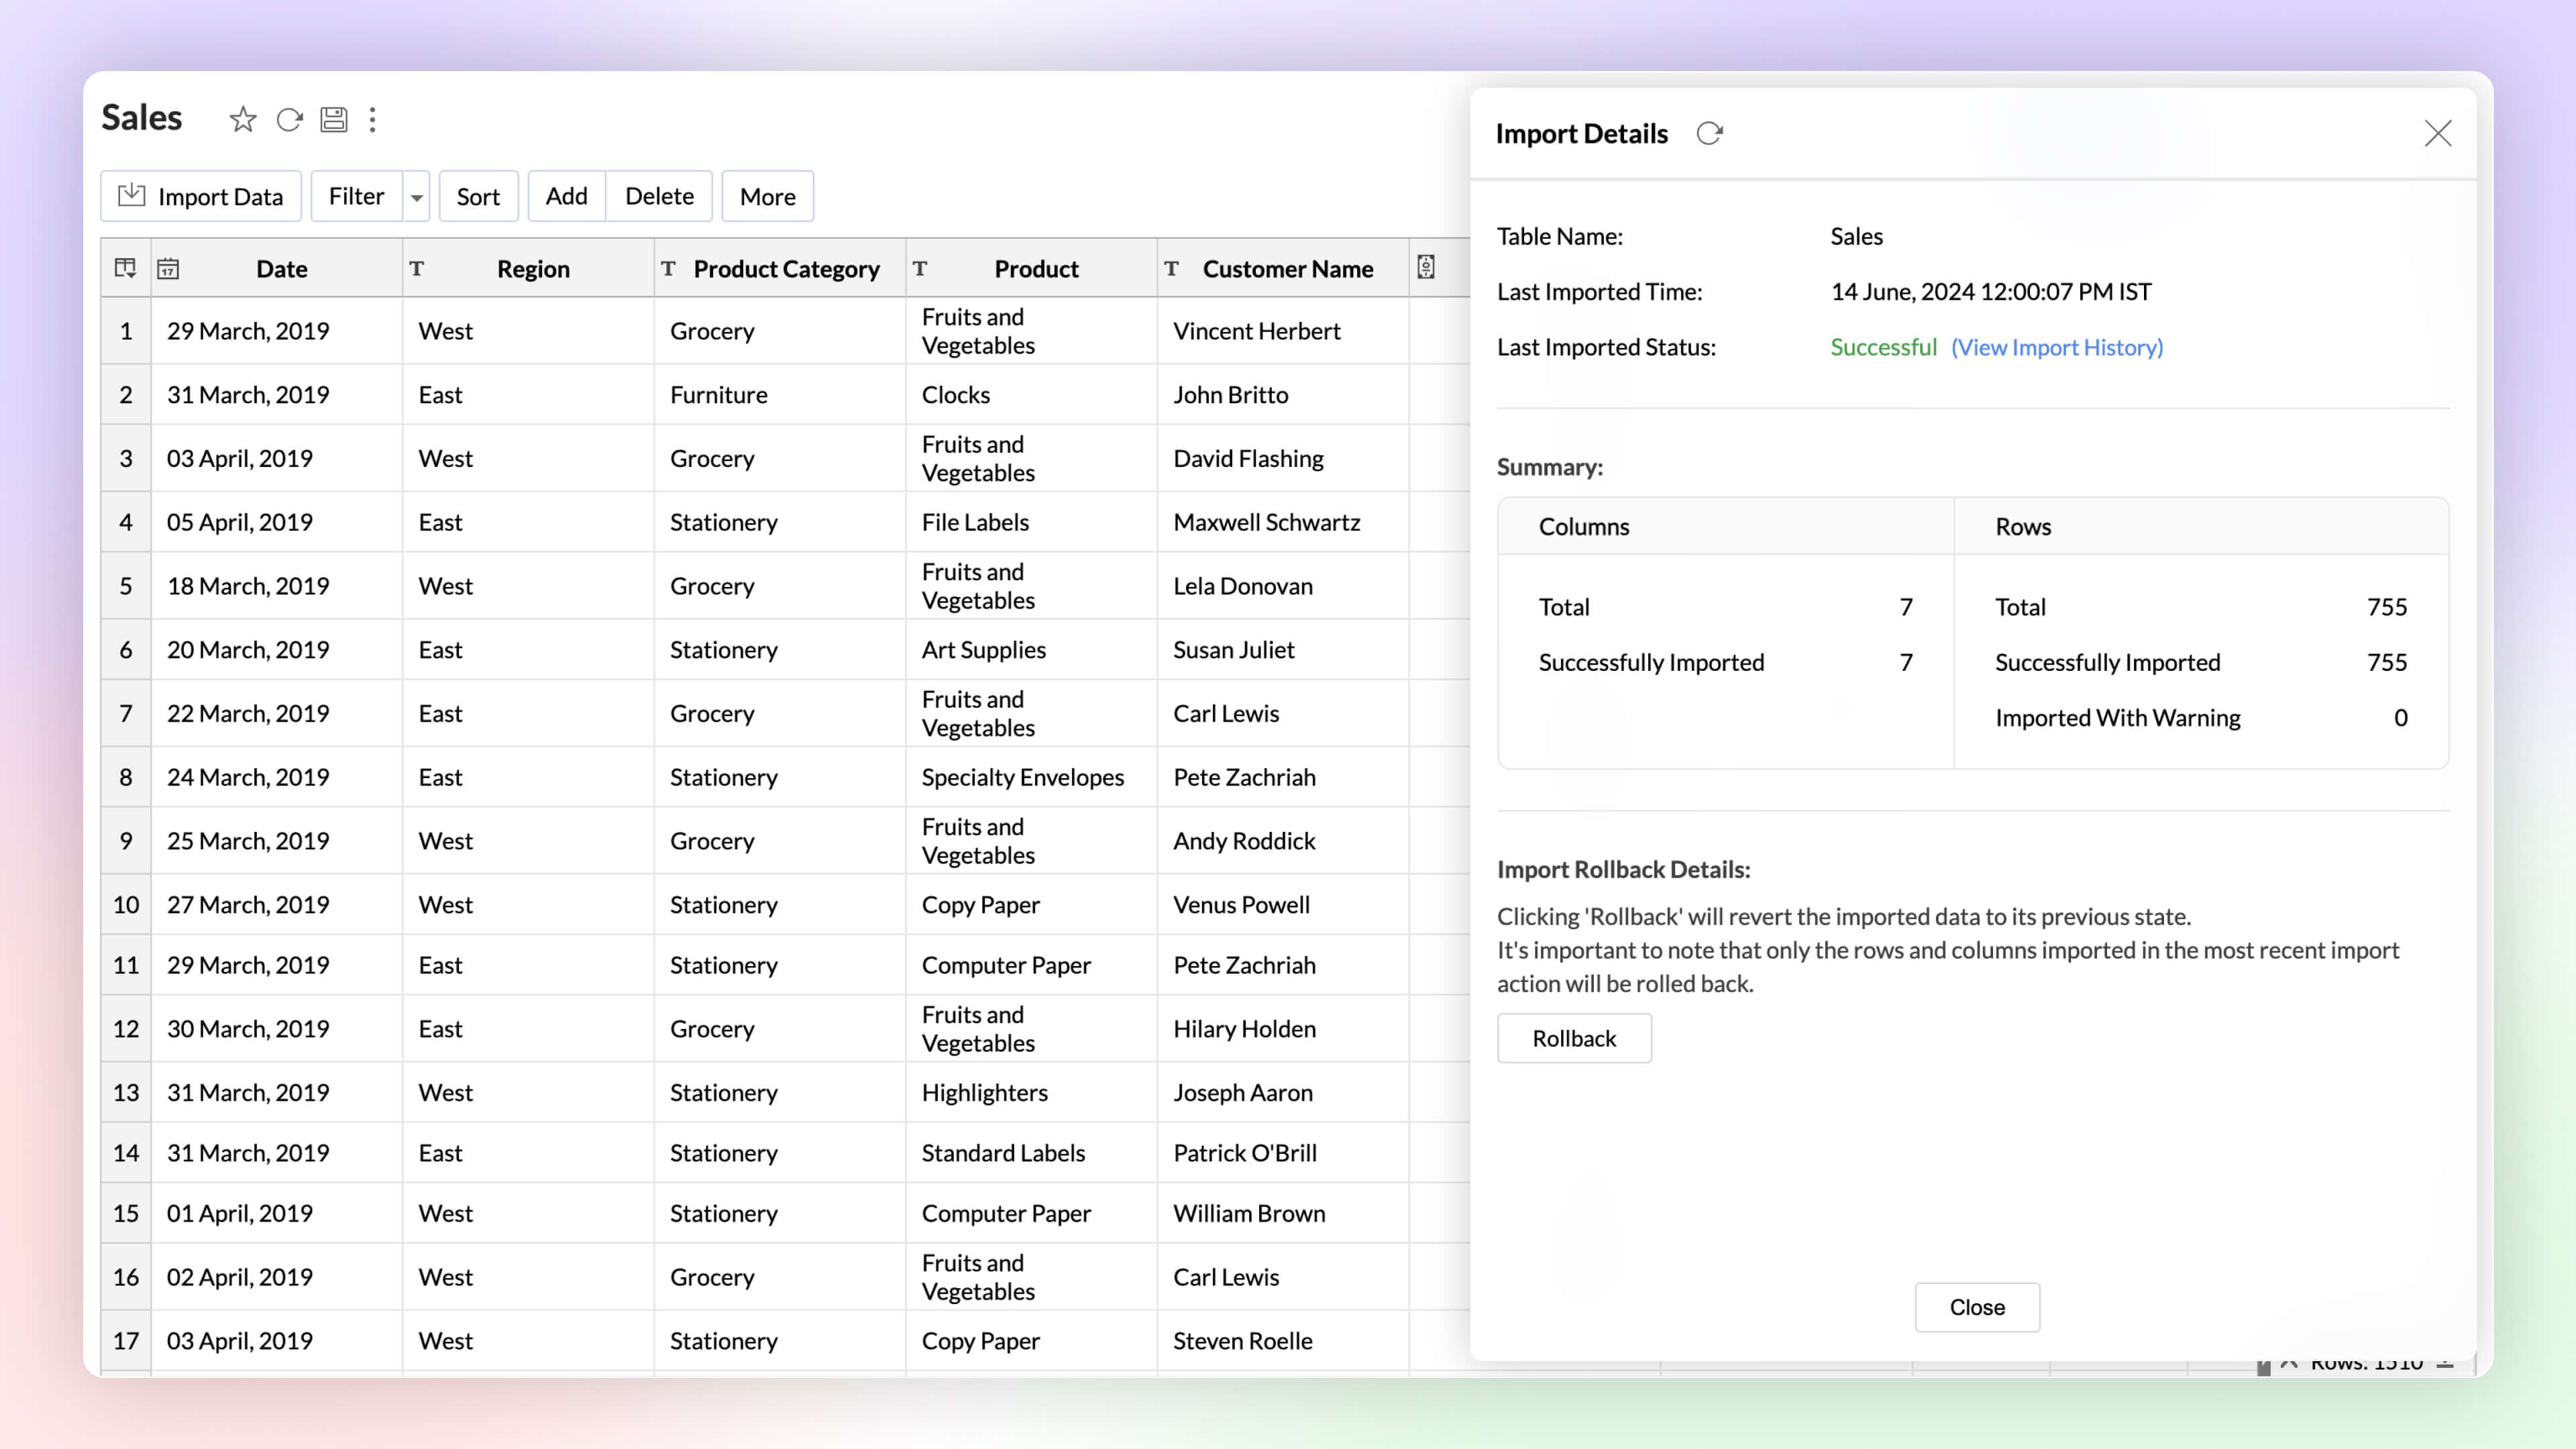
Automated imports can sometimes have errors and inconsistencies in data, and this can affect the data quality and the results. The import rollback capability reverts the current data import version to its previous version without affecting the existing data flow and analysis, ensuring data integrity.
Learn more.
Data Pipelines Premium Plan
Set up and create data pipelines to setup powerful transformations on your datasets. You can create data pipelines with the no-code visual pipeline builder and perform various transforms on your data like join, append, pivot, and unpivot.
Learn more.

With Zoho DataPrep license you can also setup end to end ETL (extract, transform and load) pipeline to move data from a variety of applications to Zoho Analytics or other sources.
Multiple Schedule Intervals for Tables
Syncing multiple tables at the same interval, just because they share a source, isn't always optimal. That's why we've introduced flexible scheduling options per connection. Now, each table can have its own unique sync interval, allowing you to better meet its specific requirements.
Learn more.

Supports Streaming Data Premium Plan
Now you can use Stream Analytics to analyze the data from live streams. The data can be streamed into Zoho Analytics using API and Google Pub-Sub Push Subscription and can be visualized using Zoho Analytics to get real-time insights.

Data Bucketing
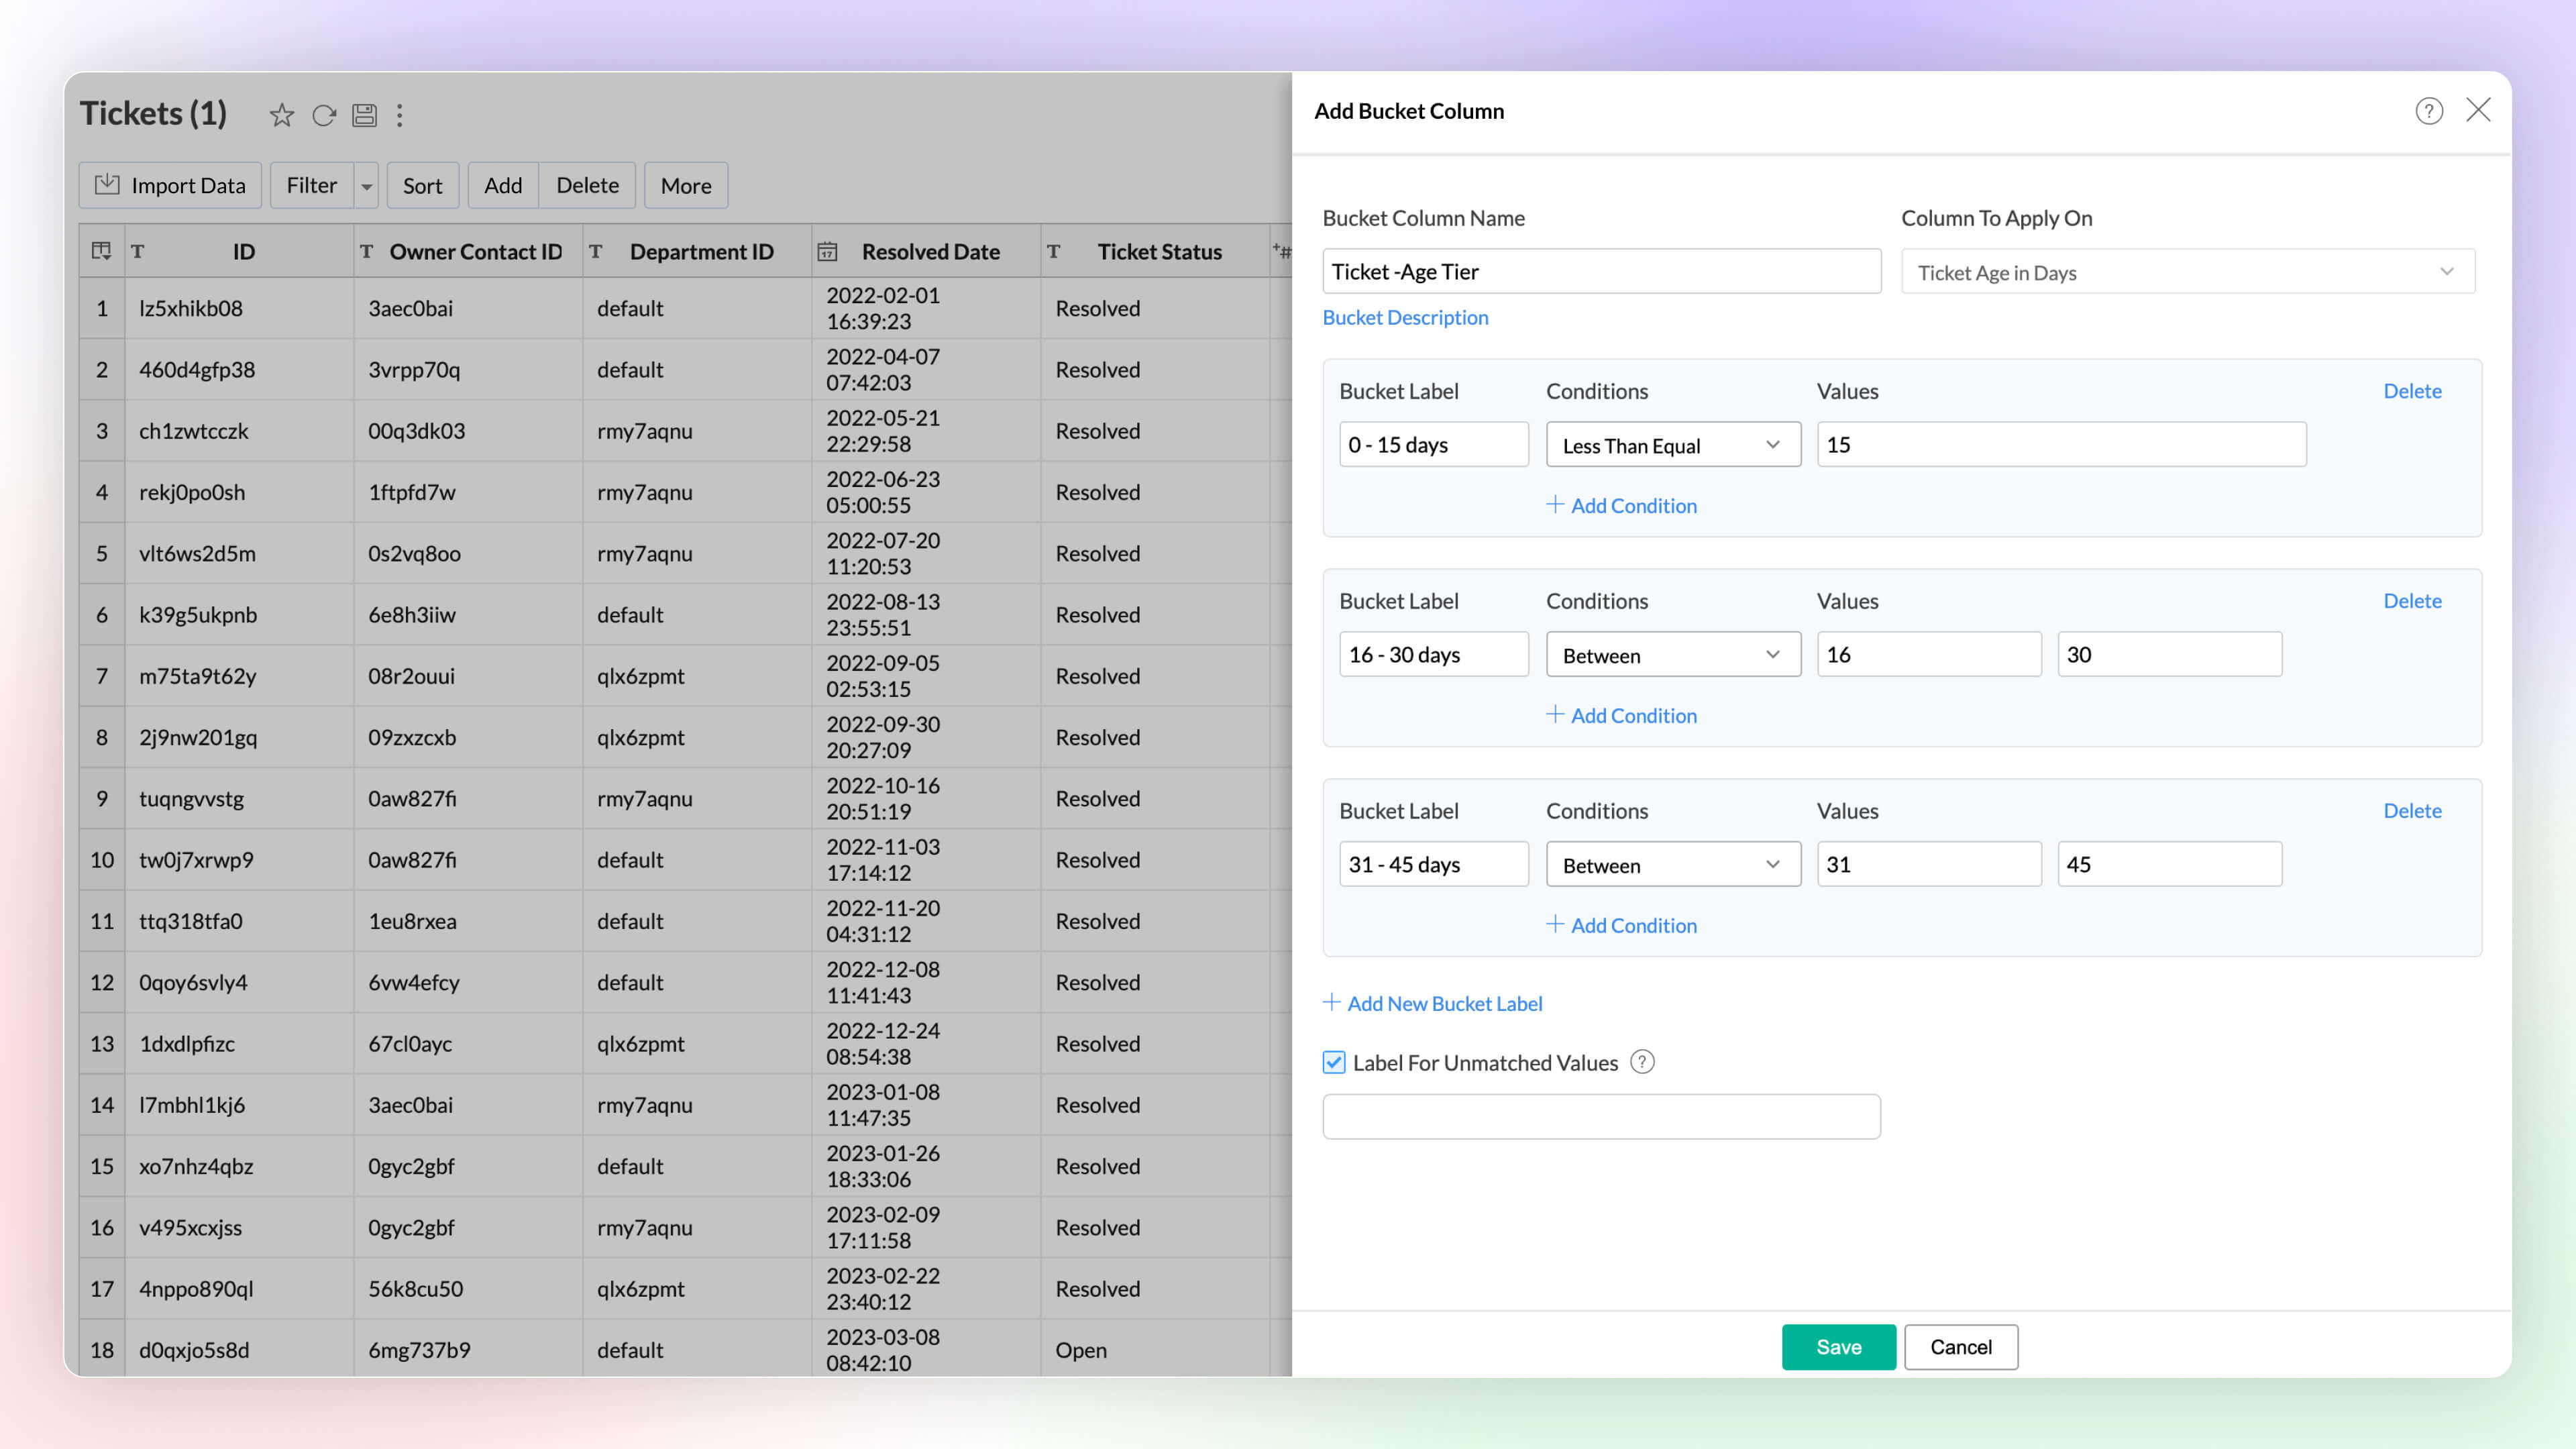
Data bucketing in Zoho Analytics allows you to transform your data into categorical bins, reducing distinct values and simplifying analysis. This feature, now built-in, replaces the need for complex formulas.
Learn more.
Dynamic Image / URL
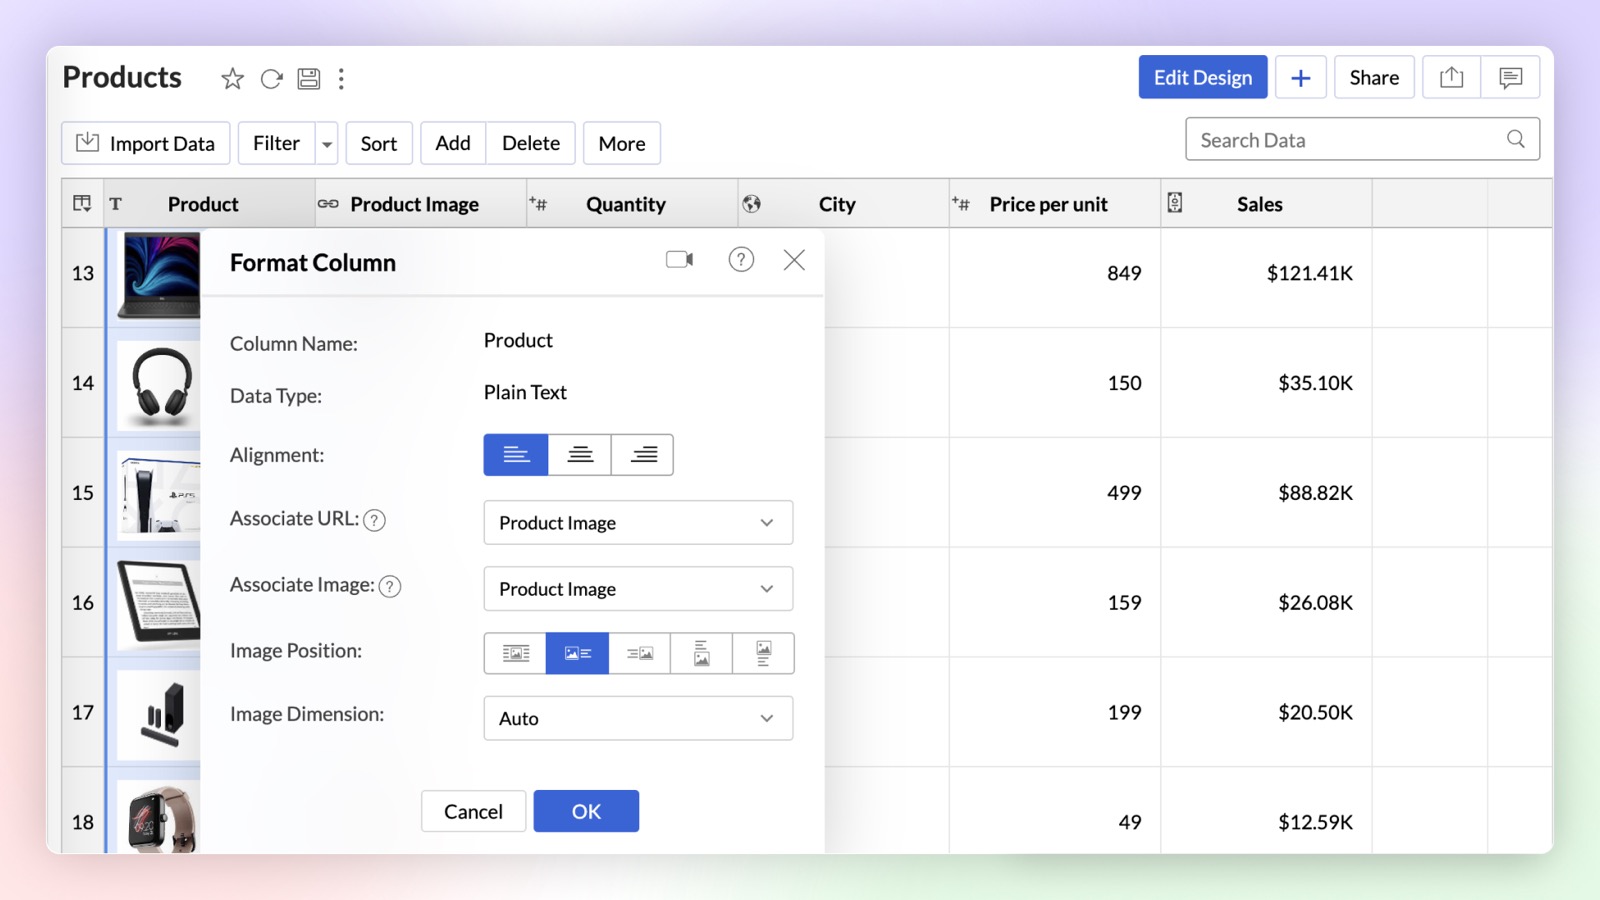
You can now dynamically associate a URL column with a text column in Zoho Analytics. On associating URL as a link or image, the text column will be either hyperlinked or an image will be displayed alongside the text.
Unified Metrics
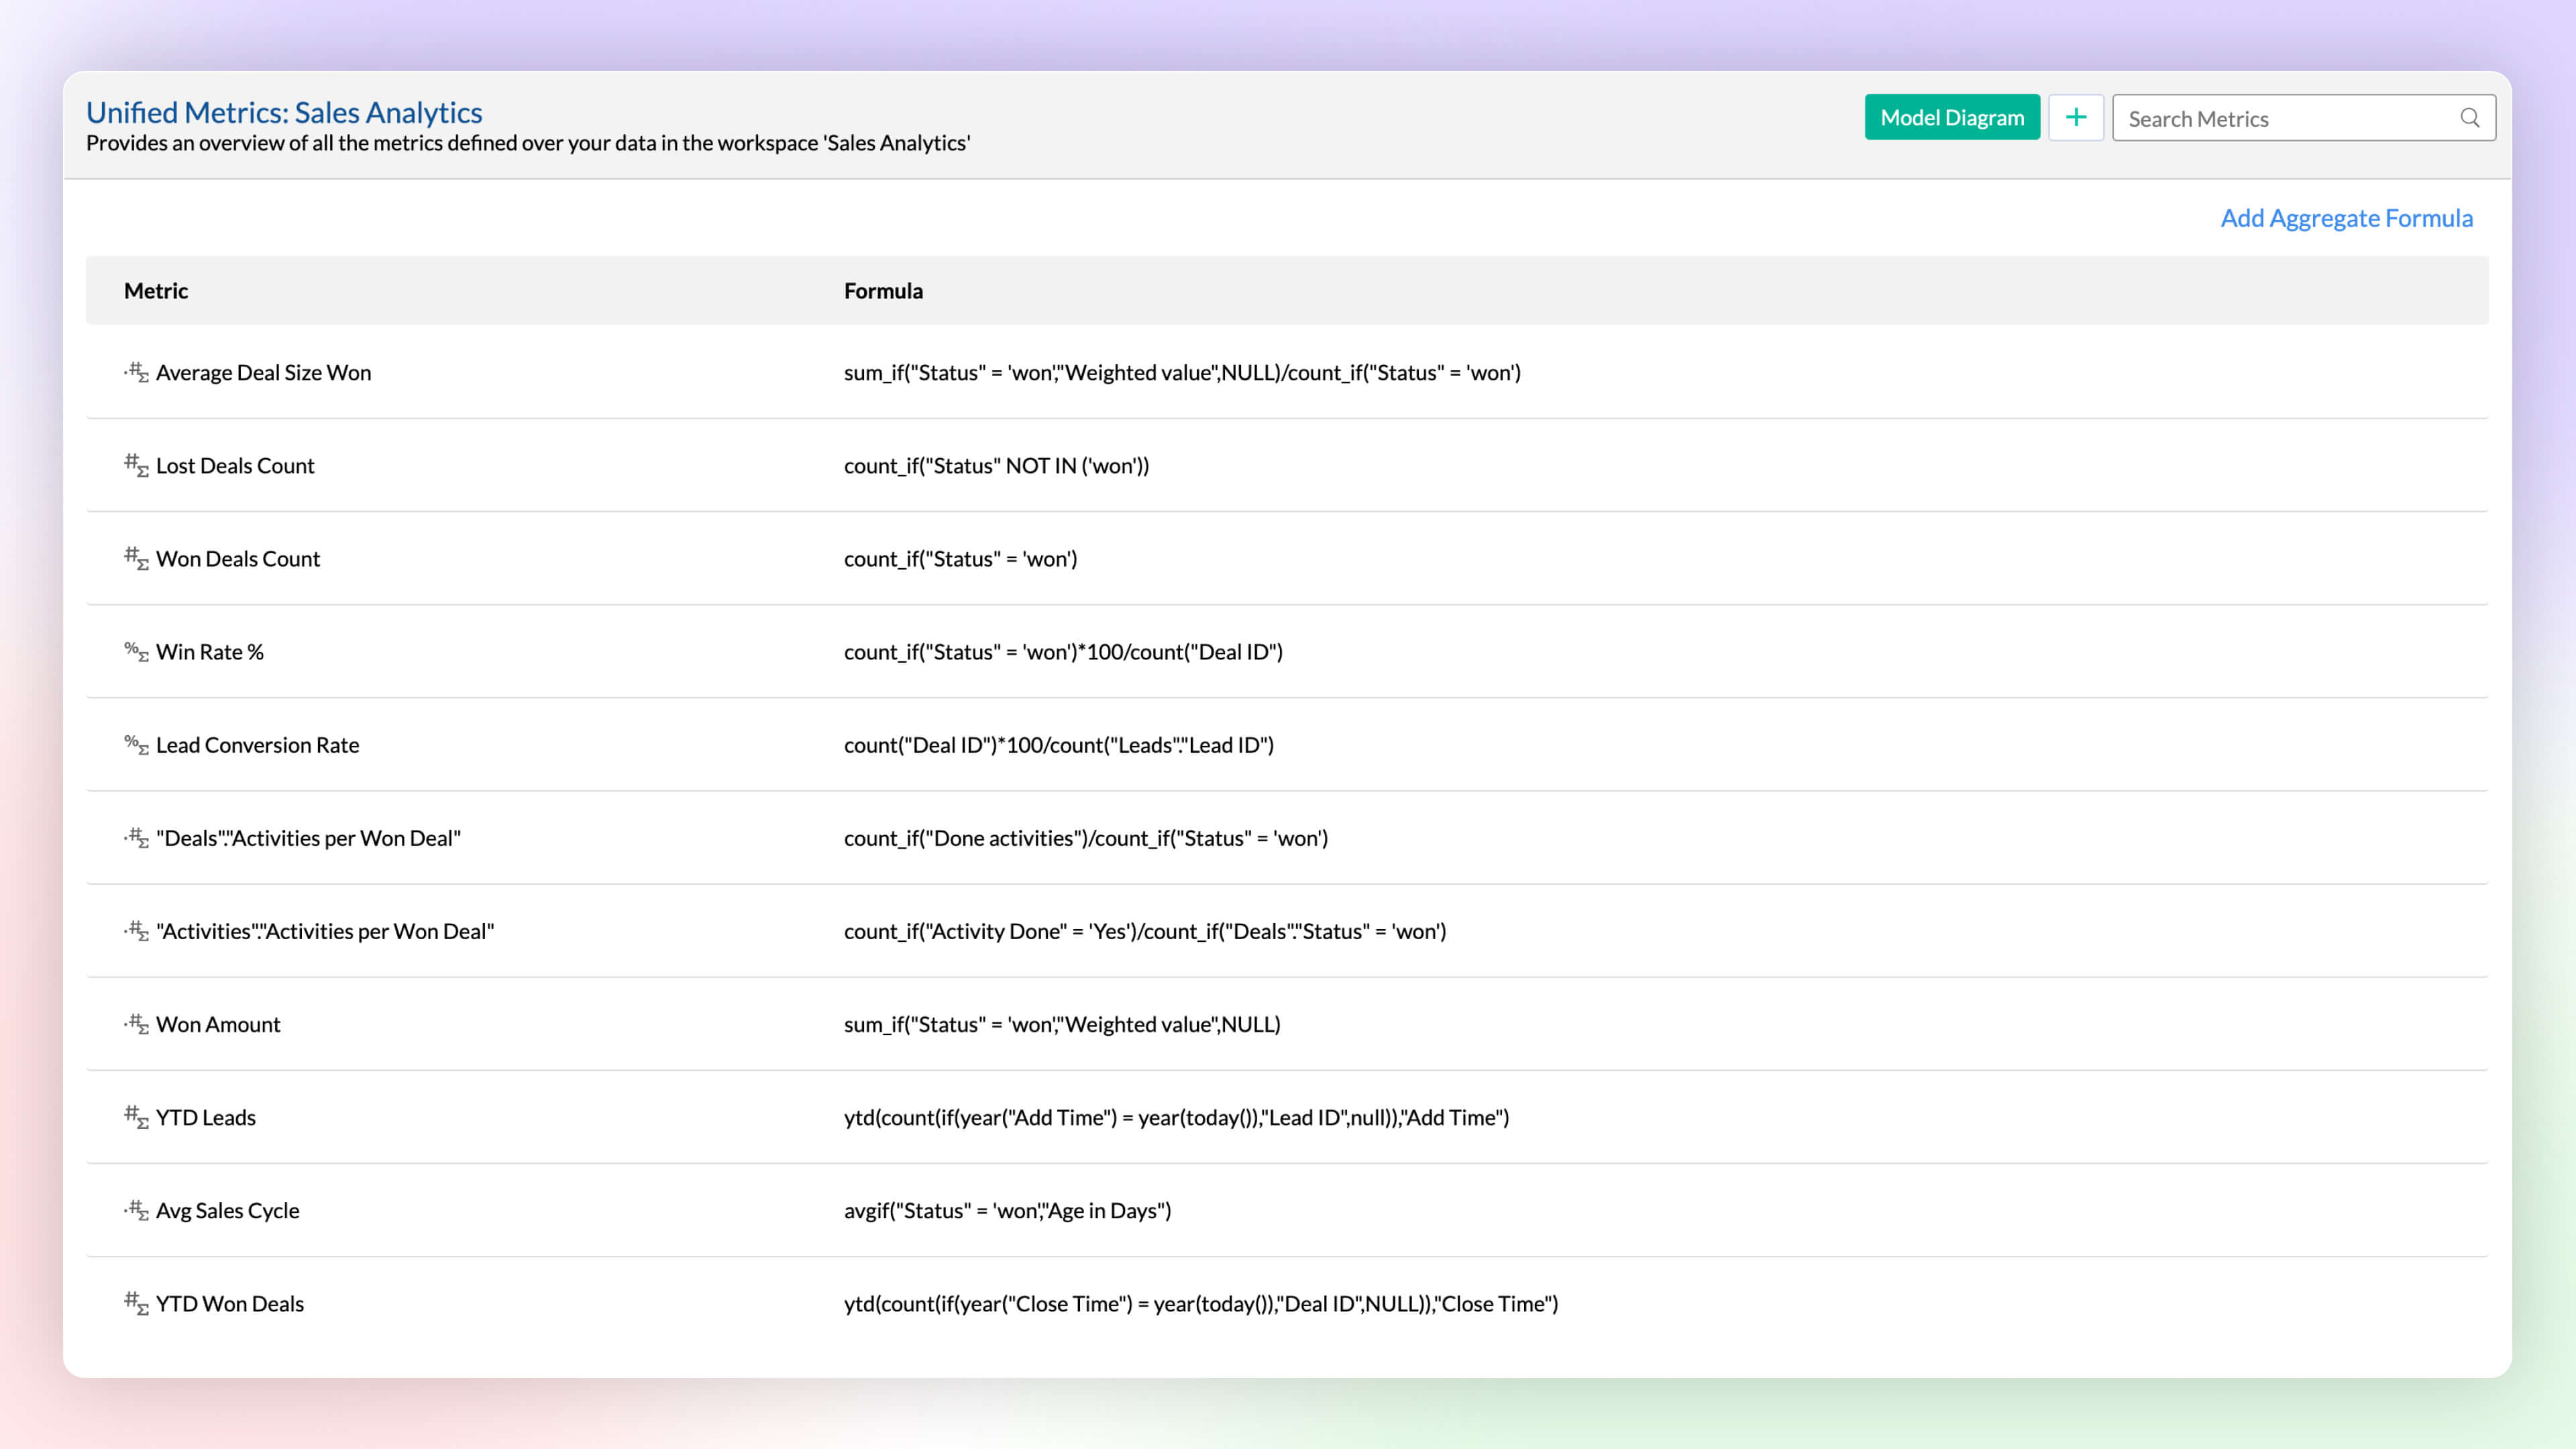
Unified Metrics in Zoho Analytics consolidates and standardizes all the metrics (aggregates) from different data sources/tables in a workspace. Now you can promote consistency and avoid duplication of metrics across the tables with ease.
Learn more.
Real-time data sync for Zoho CRM Enterprise Plan
You can now analyze up-to-the-minute CRM data in Zoho Analytics. Zoho CRM users can use the Advanced Analytic connector for Zoho CRM to analyze and visually present real-time data effortlessly.
Dataiku Plug-in
You can now analyze and visualize data in Dataiku ML models using the Zoho Analytics Plugin in Dataiku. Zoho Analytics plugin is now available in Dataiku Plugins page.
Enhancement in Live Connect
Zoho Analytics now allows data sources with Live Connect to be added to workspaces alongside other data sources. Previously, Live Connect sources could not be combined with other data sources in the same workspace.
Learn more.
Visual Analytics
Chart Enhancements
New Chart Types
Zoho Analytics supports 7 new chart types (on top of 50+ existing ones) with extensive customization options to enhance the presentation and interpretation of the data.
- Sankey charts Sankey charts are ideal for visualizing data flow between nodes and tracking event movement through connected lines. In Zoho Analytics, you can customize node and link colors, adjusting them individually or globally, and set link colors based on source or target nodes. You can choose a basic Sankey chart for simple flows or an Alluvial Chart for complex, multi-stage flows.
- Racing charts are animated views that are best suited for visualizing the changes in the data over a period of time where the relative ranking of categories is important. They highlight and help comprehend the fluctuations and progression in the data. These types of charts grab the user's attention instantly, providing an immersive experience and helping craft a compelling story about the data.
- Spark lines are compact charts that show the trends and variations in the data without taking up much space. They are widely used alongside pivot tables and help grasp trends and allow quick comparison of metrics across different fields. Zoho Analytics supports three variations that includes line chart, area chart, and bar chart.
- Geo Map Layering, add multiple data layers to the geo map to visualize various dimensions of information. This feature includes interactive options for enhanced data exploration.
- Sunburst charts represent hierarchical data through a series of rings, or concentric circles. Each ring corresponds to a level in the hierarchy. The central or innermost circle represents the root node, or the top-level category. Moving outwards, each subsequent ring represents a subcategory, where the outermost ring is the leaf node. The size of each arc in the ring is proportional to the value of the data.
- Conversion bar charts show the connected stages of a process and the gradual decrease in data as it moves through different stages of the process. Each stage is represented by a bar, with a step or stair case pattern indicating the shift in values (along with conversion percentage) at each stage.
- Tree Map is a visualization composed of differently-sized rectangles that represent your data values. This is beneficial when you want to depict the part to whole relationship among various categories.

Interactive Chart Customizations
Experience real-time updates as you customize your chart with the new Chart Settings interface, now available on the right side pane. It provides enhanced customization options with live visual feedback.
Learn more.
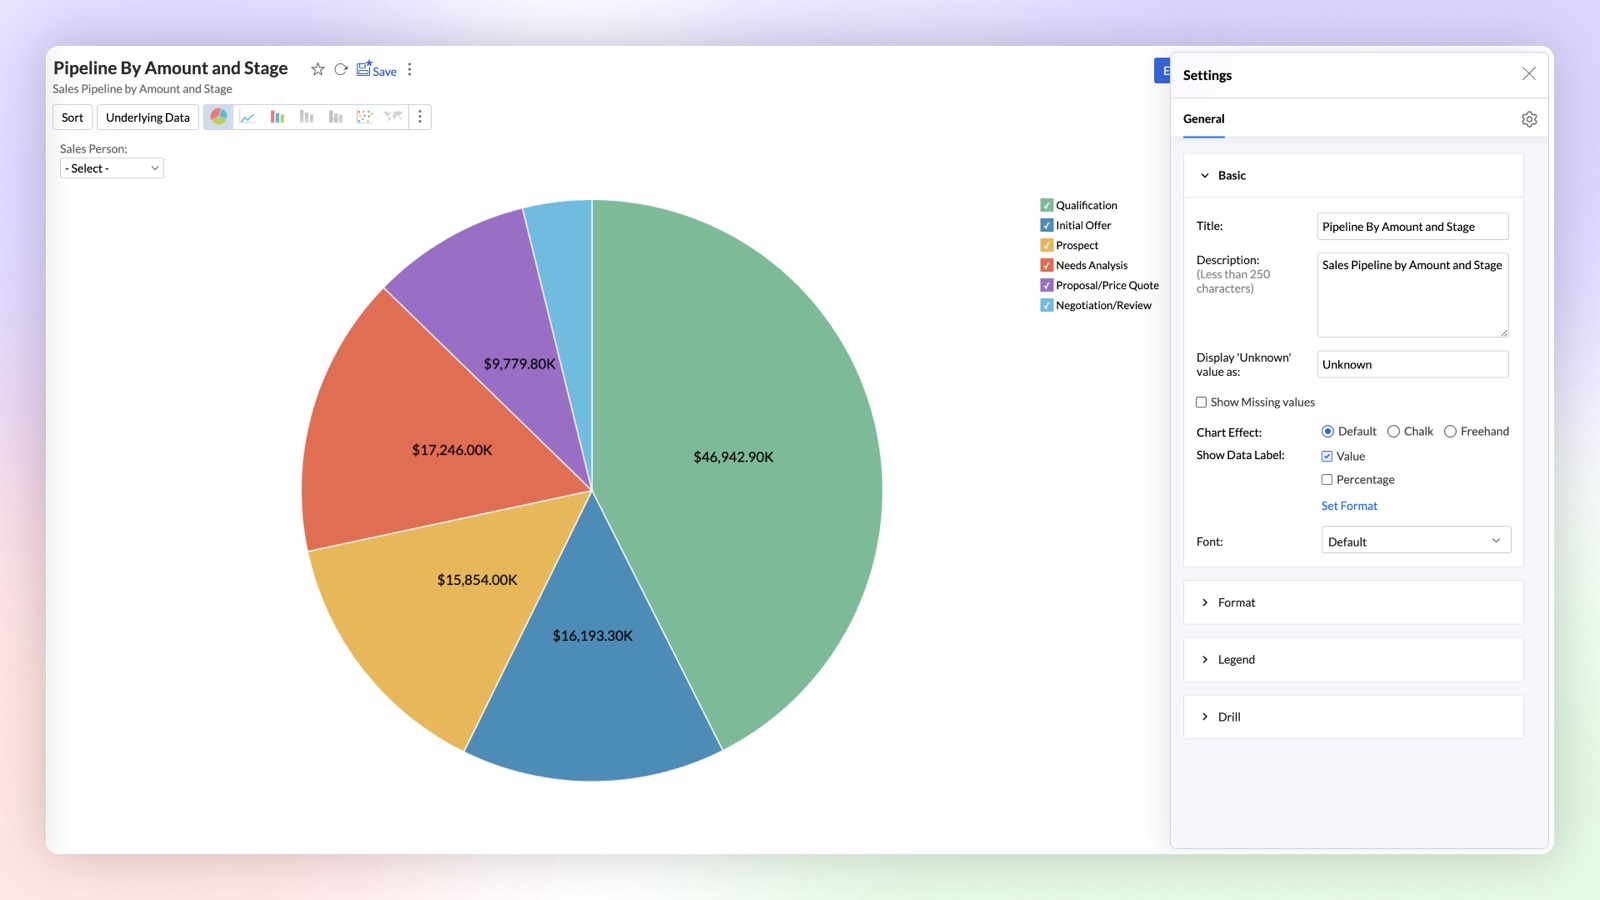
Chart Creation as API
Chart creation APIs in Zoho Analytics allow you to programmatically generate various types of charts by customizing data inputs, applying filters, and configuring chart properties. These APIs offer flexibility to create dynamic visual reports directly through code.
Pivot enhancements
Conditional Formatting over other columns in Pivot
This enhancement empowers you to create more dynamic and insightful Pivot Tables by allowing you to apply conditional formatting rules over any column based on the values of another column.
Learn more.
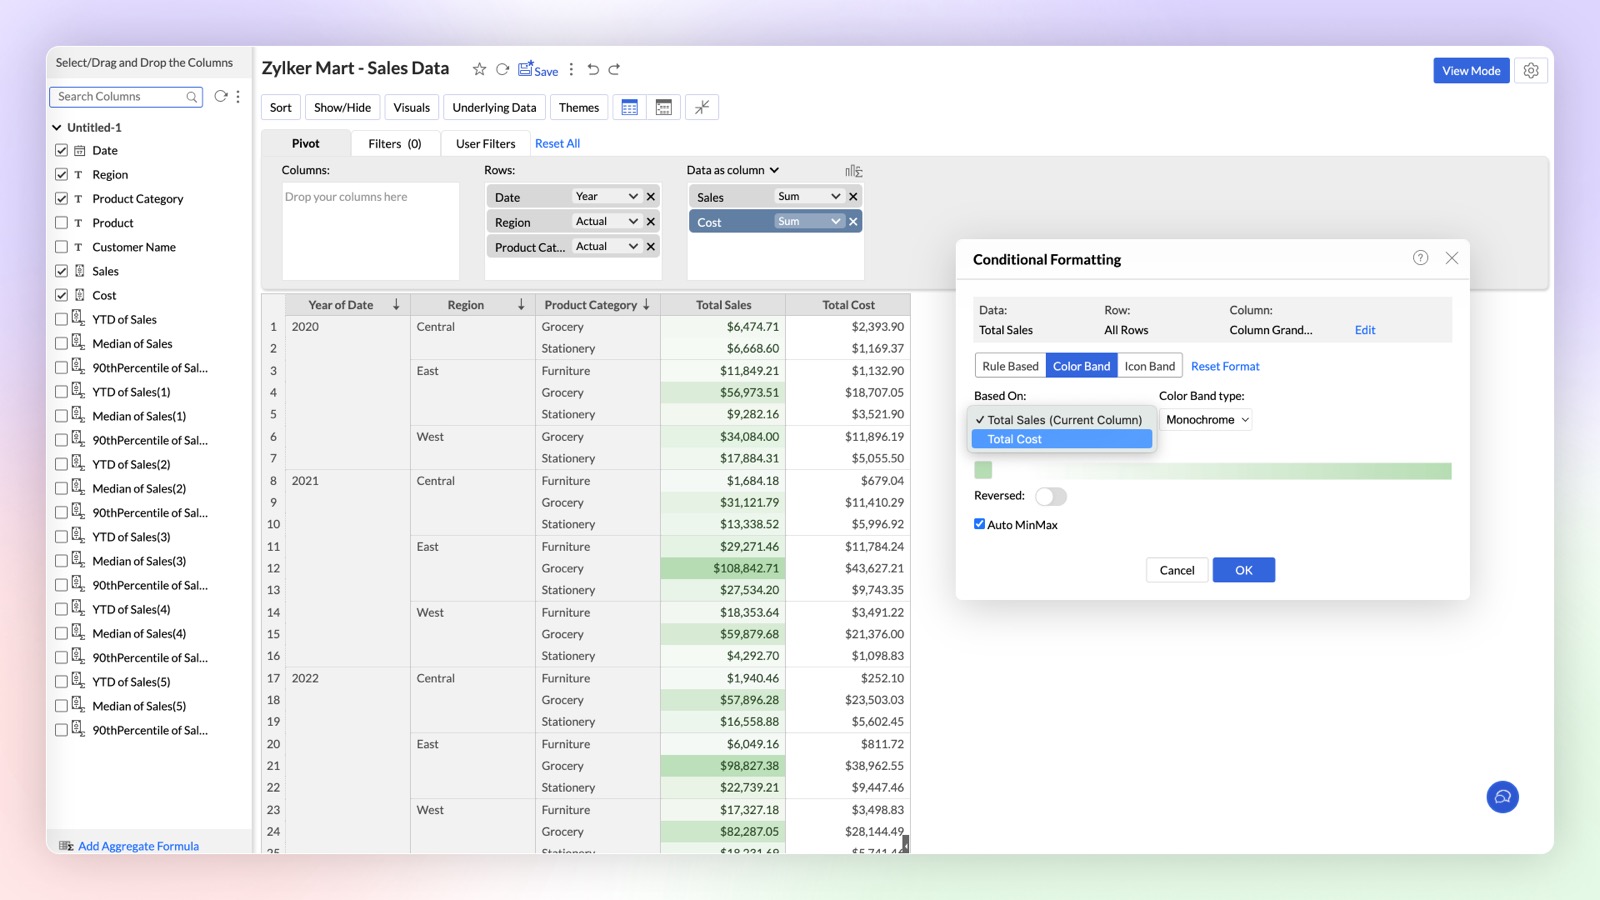
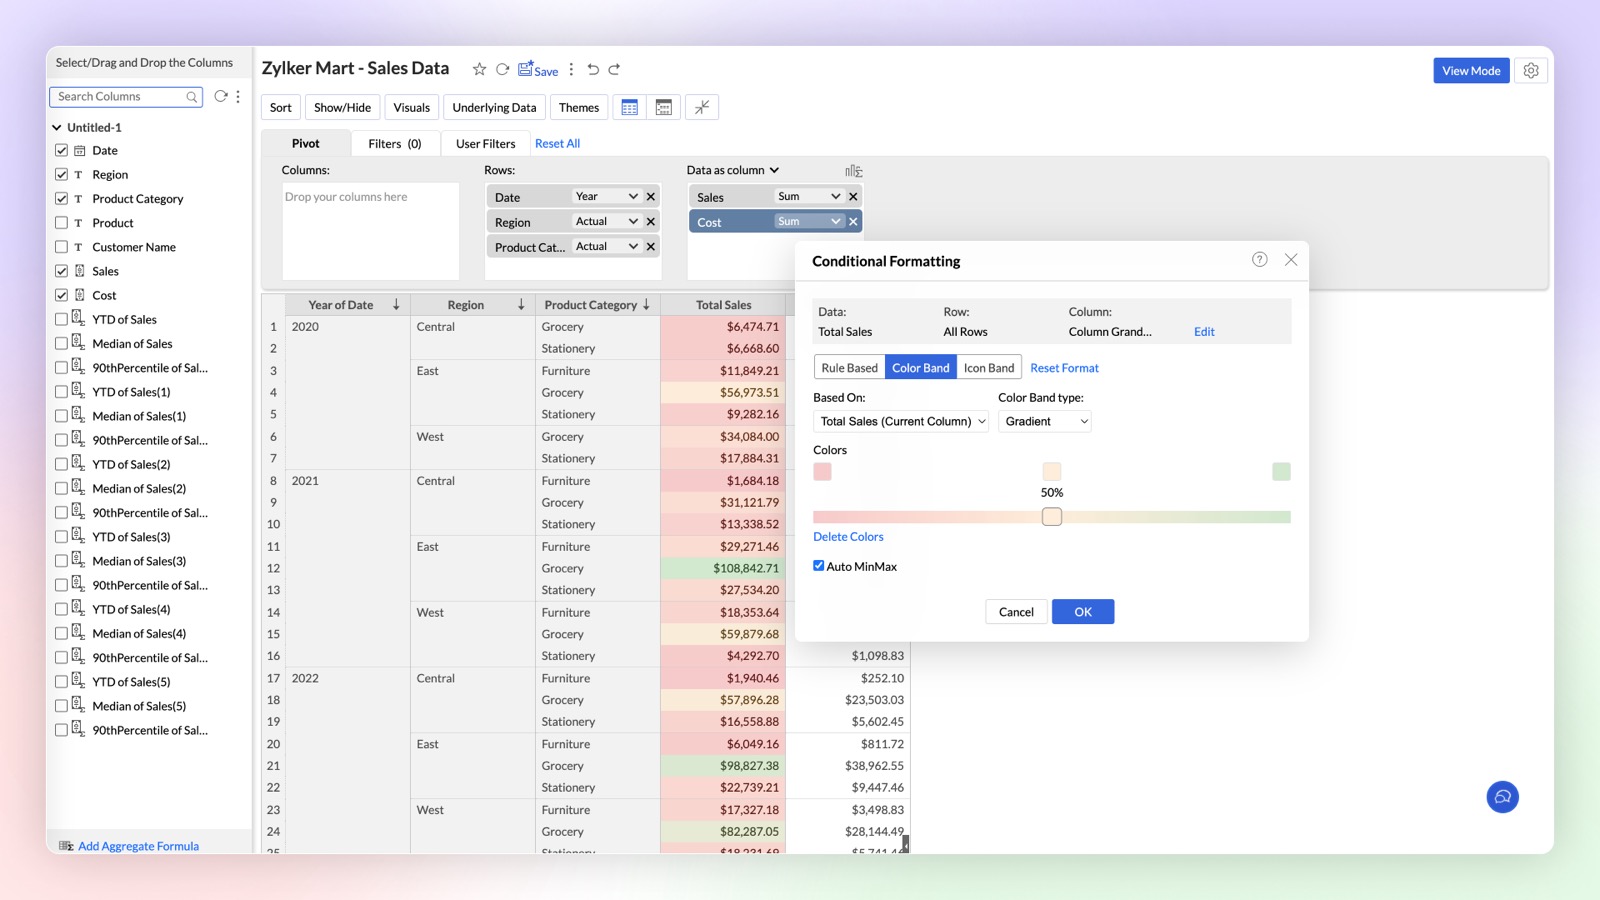
New Conditional Formatting: Color Bands & Icons
Zoho Analytics introduces enhanced Conditional Formatting with Color Bands and Icons in Pivot Tables.This update brings a new level of visual customization, allowing you to highlight critical data points and enhance data comprehension directly within your Pivot Tables.
Learn more.
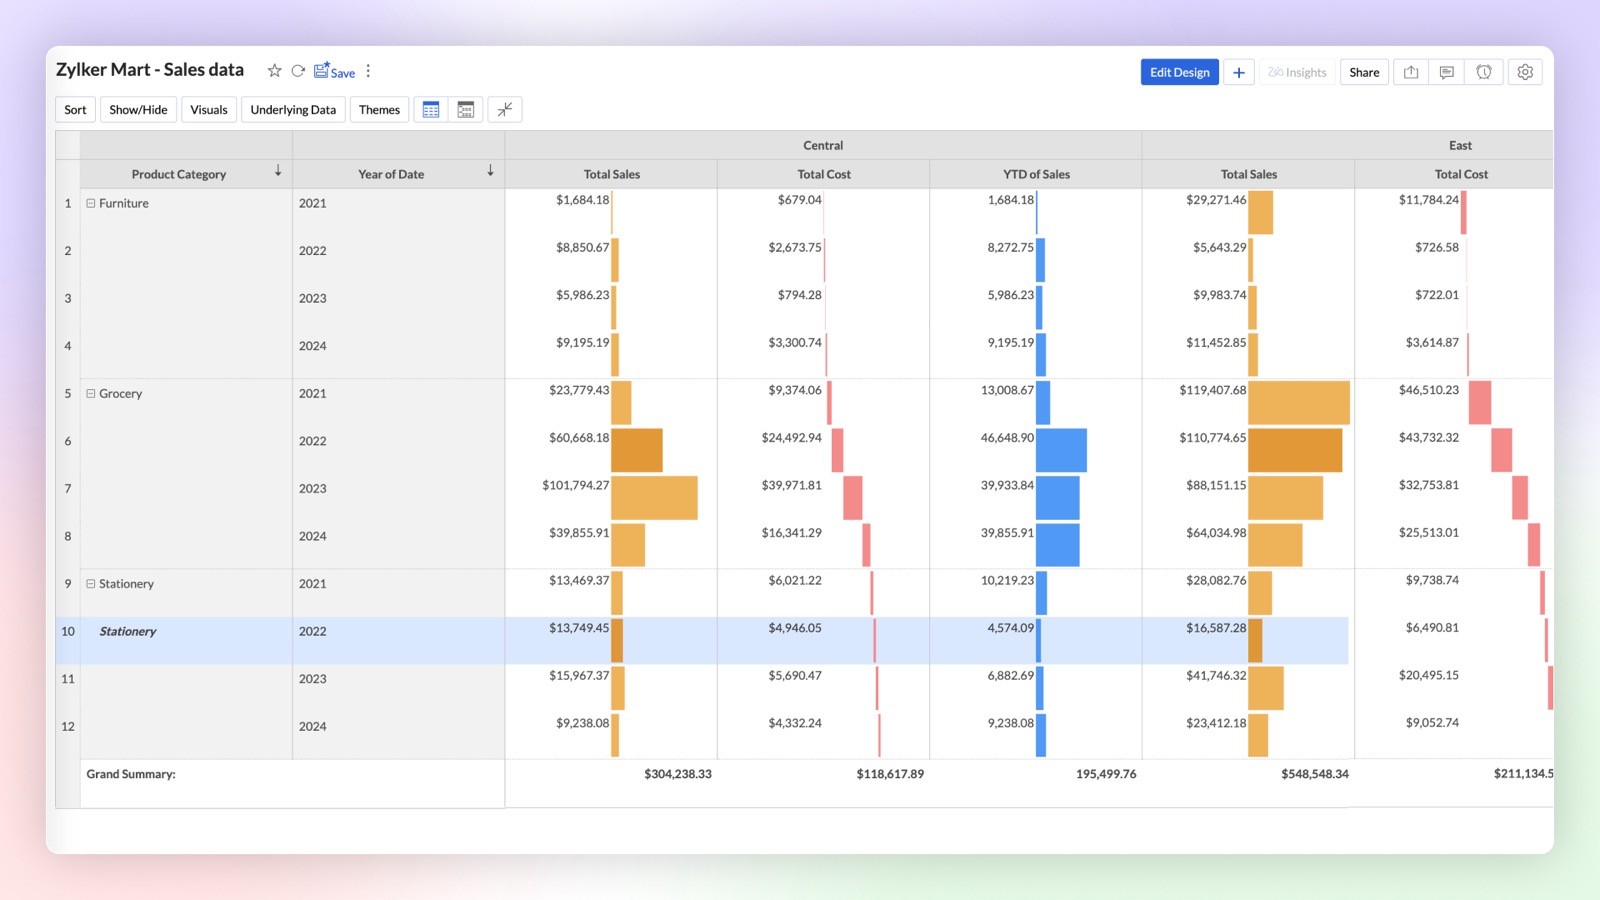
Data Bars & Waterfall Charts in Pivot
Introducing Data Bars and Waterfall (Bar Range) Charts in pivot tables to analyze complex data sets and highlight key insights directly within your pivot tables. Upgrade your data visualization game with Data Bars and Waterfall Charts in Zoho Analytics. Start transforming your Pivot Tables into powerful storytelling tools today!
Learn more.
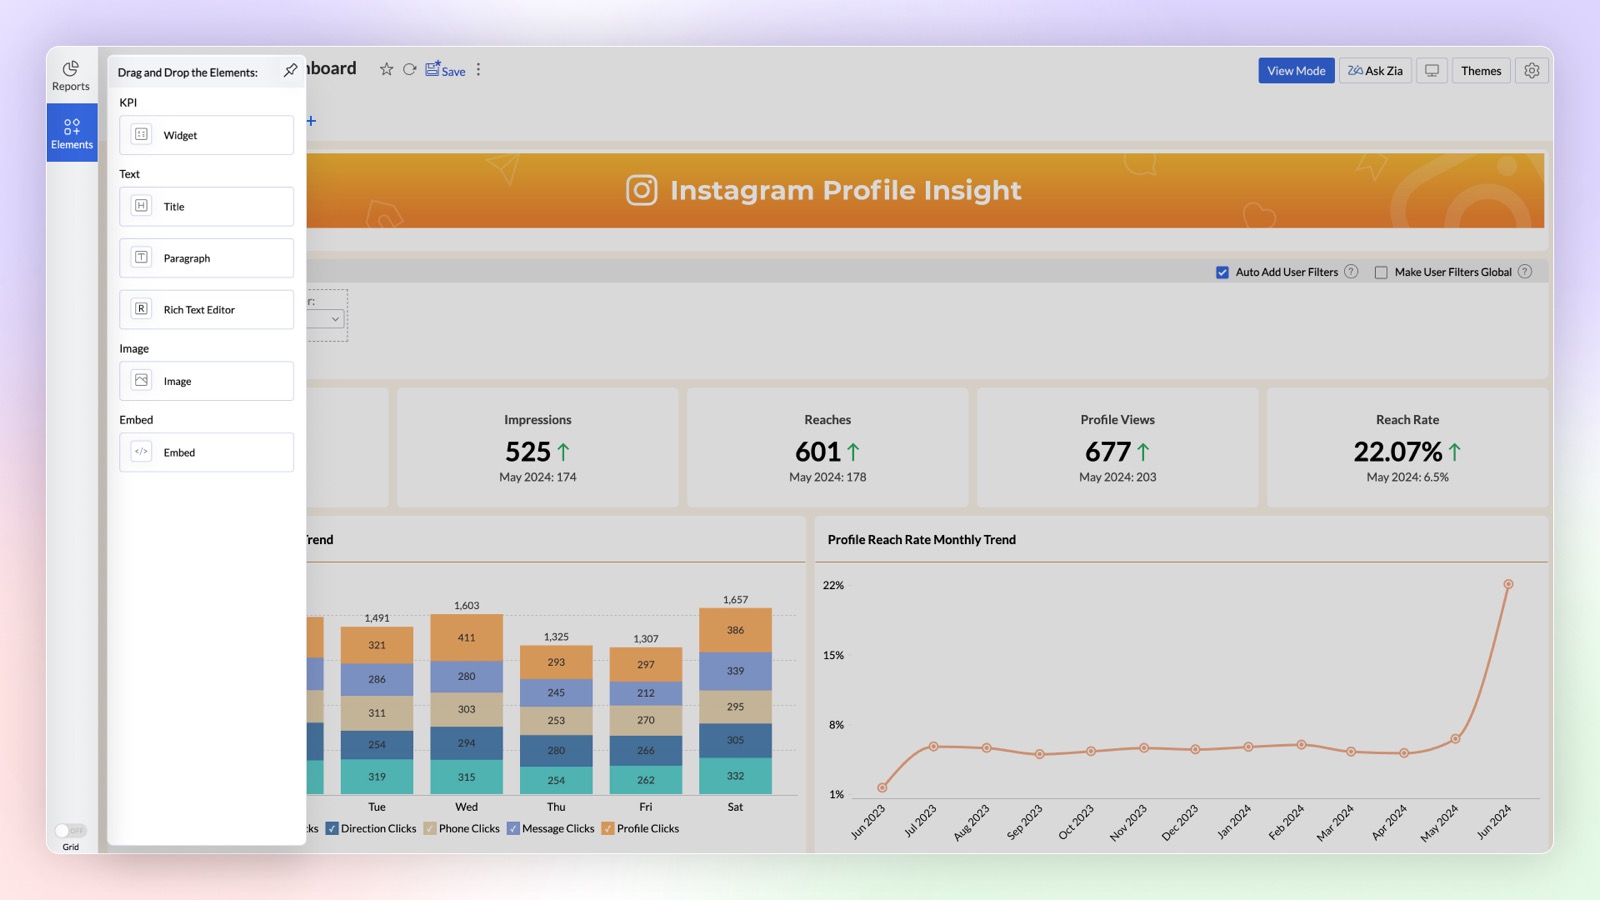
Dashboard Enhancements
Add Elements in Dashboard
The Dashboard Designer interface now includes an "Add Elements" section for easily incorporating widgets, text, images, and embedded URLs into your dashboard. Simply drag and drop these elements to add them. The Text element offers enhanced formatting options, while the Image element features a built-in editor for direct image customization.
Enhanced Themes and Background in Dashboard
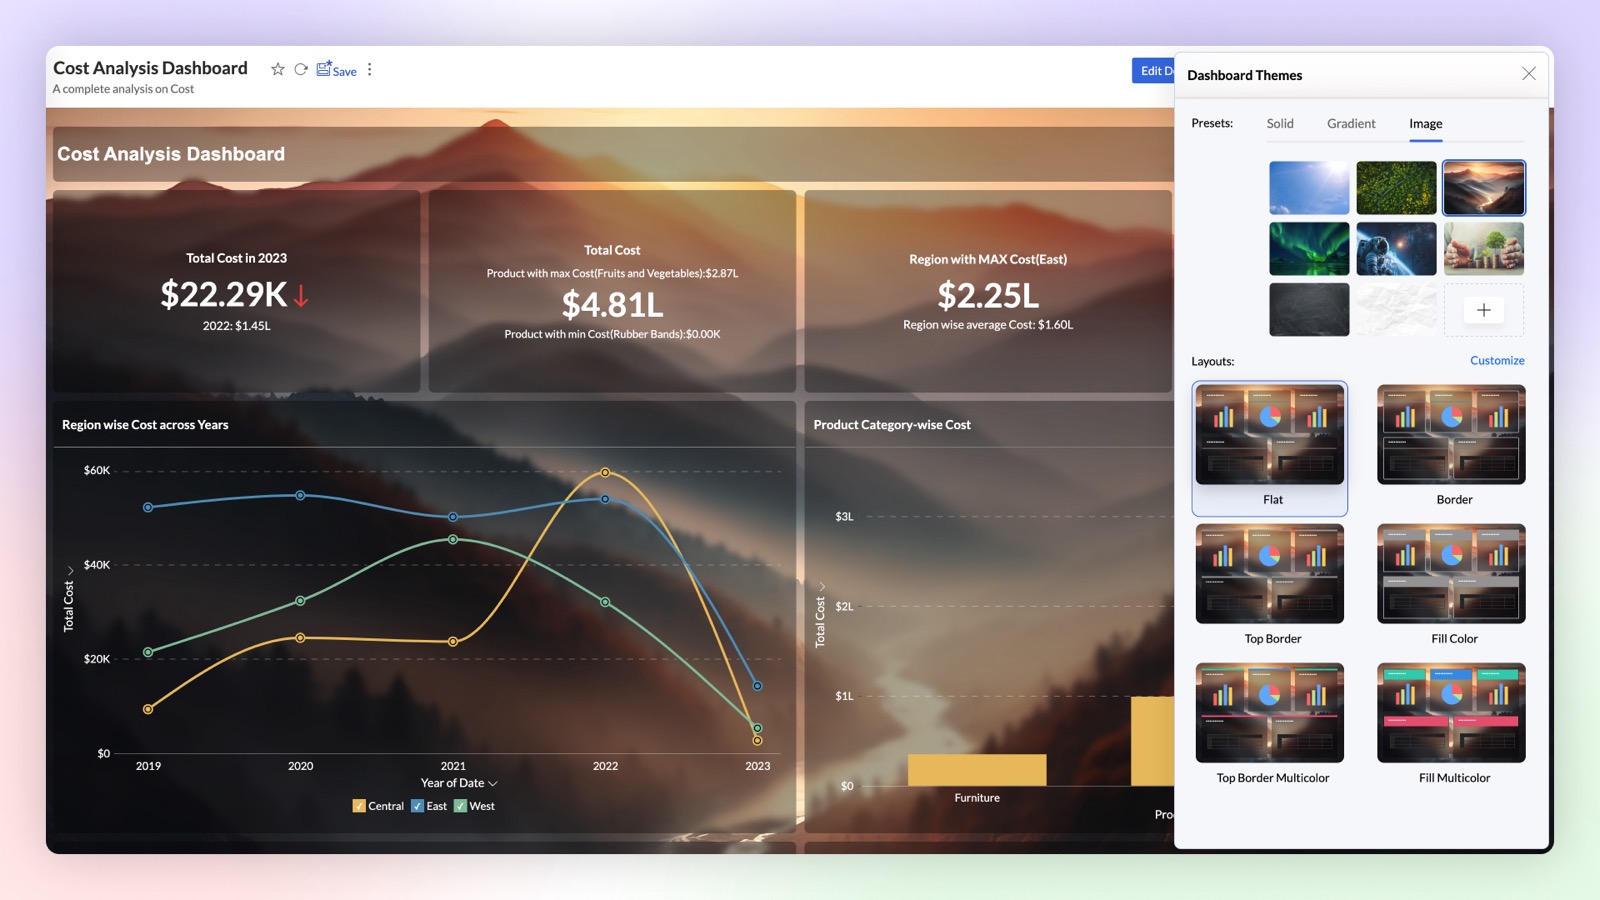
Want to create stunning dashboards with reports over transparent cards and an image as background? Try our new themes and background card effect feature. With wide customization options to improve the visual aesthetics, this helps enhance the clarity of the reports and widgets.
Changing date functions based on Time Slicer
Enhance user interaction on your dashboard by dynamically adjusting the date functions of reports based on the applied Time Slicer. The selected date function and interval in the Time Slicer will automatically update the date functions across all reports within the dashboard.

Customizing the width of Dashboard Designer Area
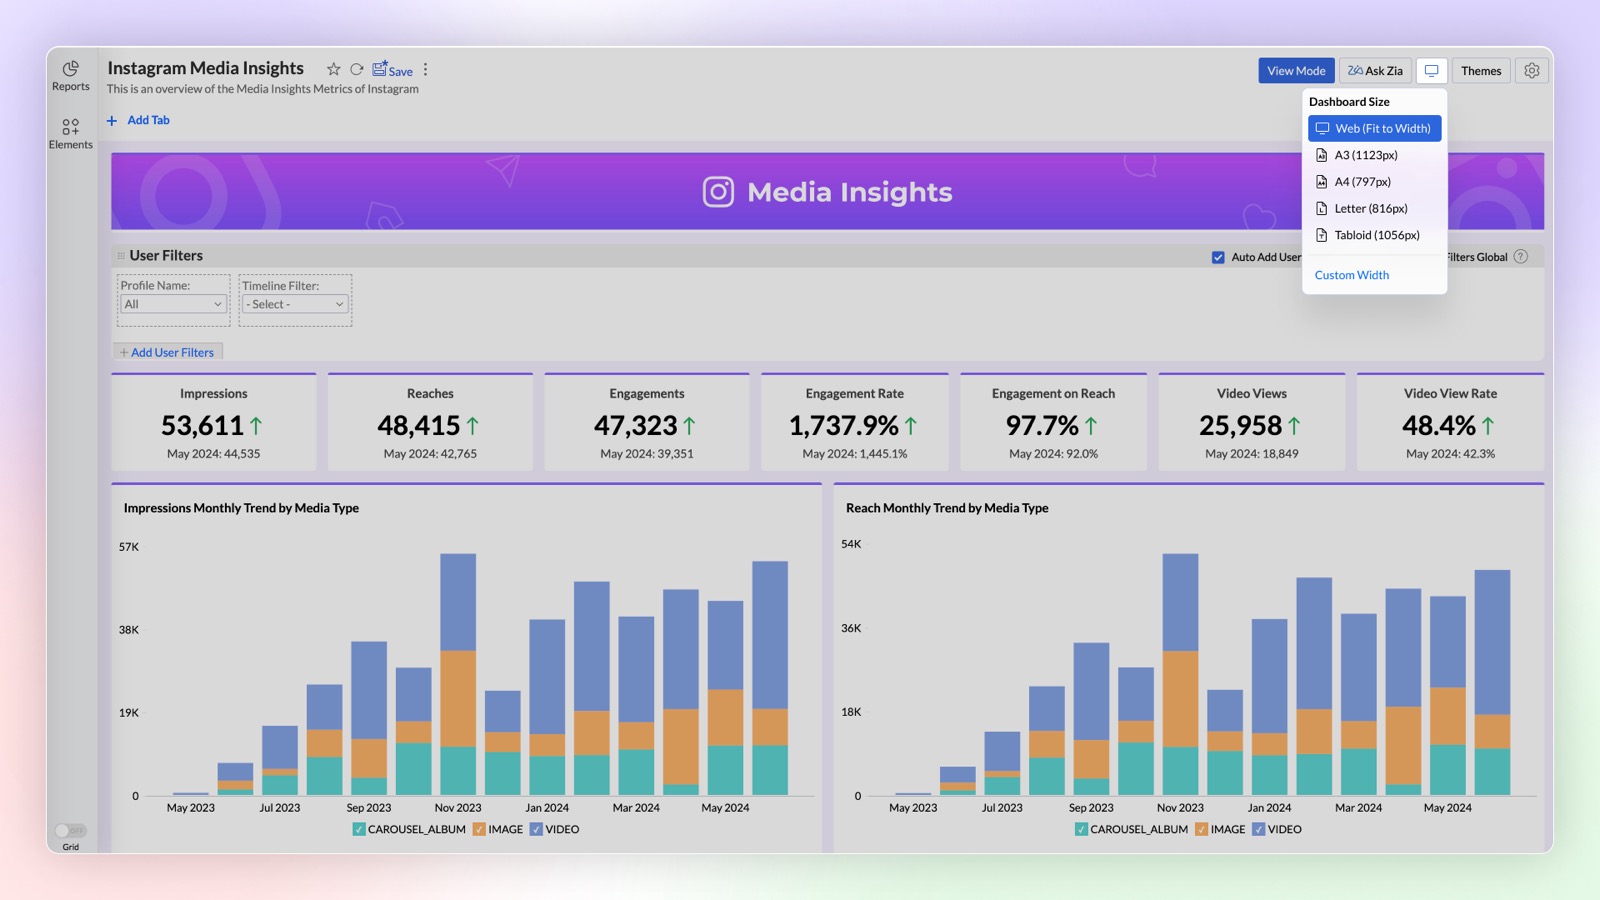
You can now customize the width of the Dashboard Designer Area, allowing you to easily design dashboards for embedding in websites or blogs with a specific size. By setting the desired width, you can design your dashboard and directly embed it, ensuring a visually appealing layout.
Widget Enhancements
- Image support in widgets: Enhance your dashboard’s visual appeal and user engagement by adding custom icons to KPI widgets to convey information at a glance, without lengthy descriptions. You can use the in-built image customization options like changing color, cropping, etc., to cater your needs.
- Widgets with forecast: Based on your current data trend, get a better understanding of how close you are to your goals by adding forecast value to your widgets.
Export as PPT
You can now export a dashboard as a Microsoft PowerPoint file. The snapshot of each view in the dashboard will be exported as an individual slide.
Copy and Paste Reports in Dashboard
Now you can easily copy and paste the reports in your dashboard from one tab to another.
Interactive Customizations
Global User Filter
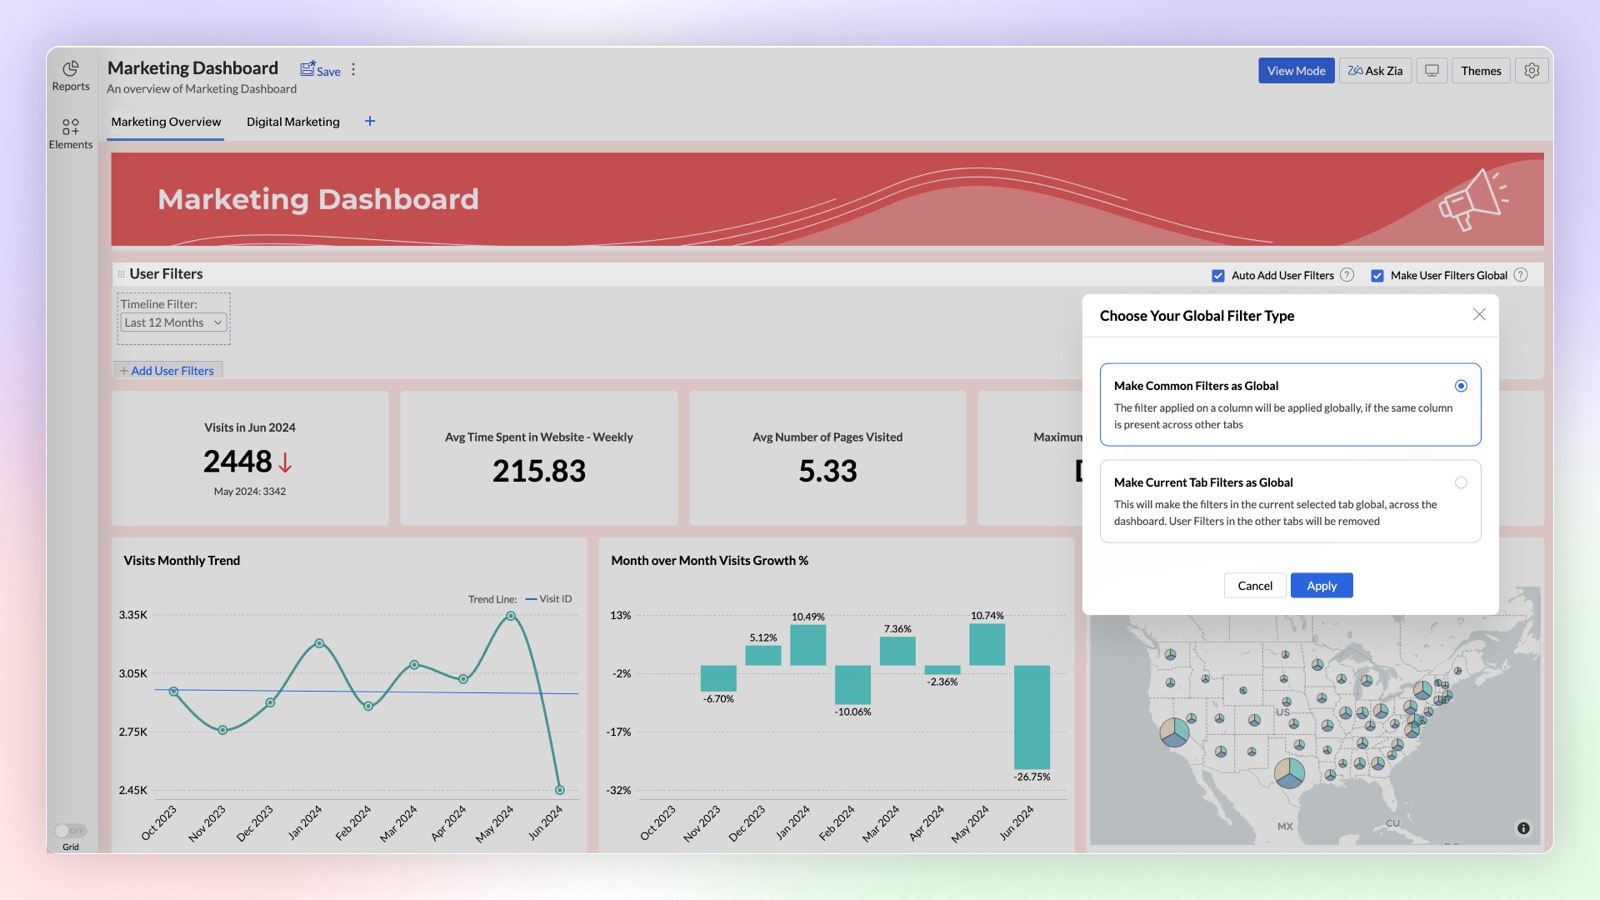
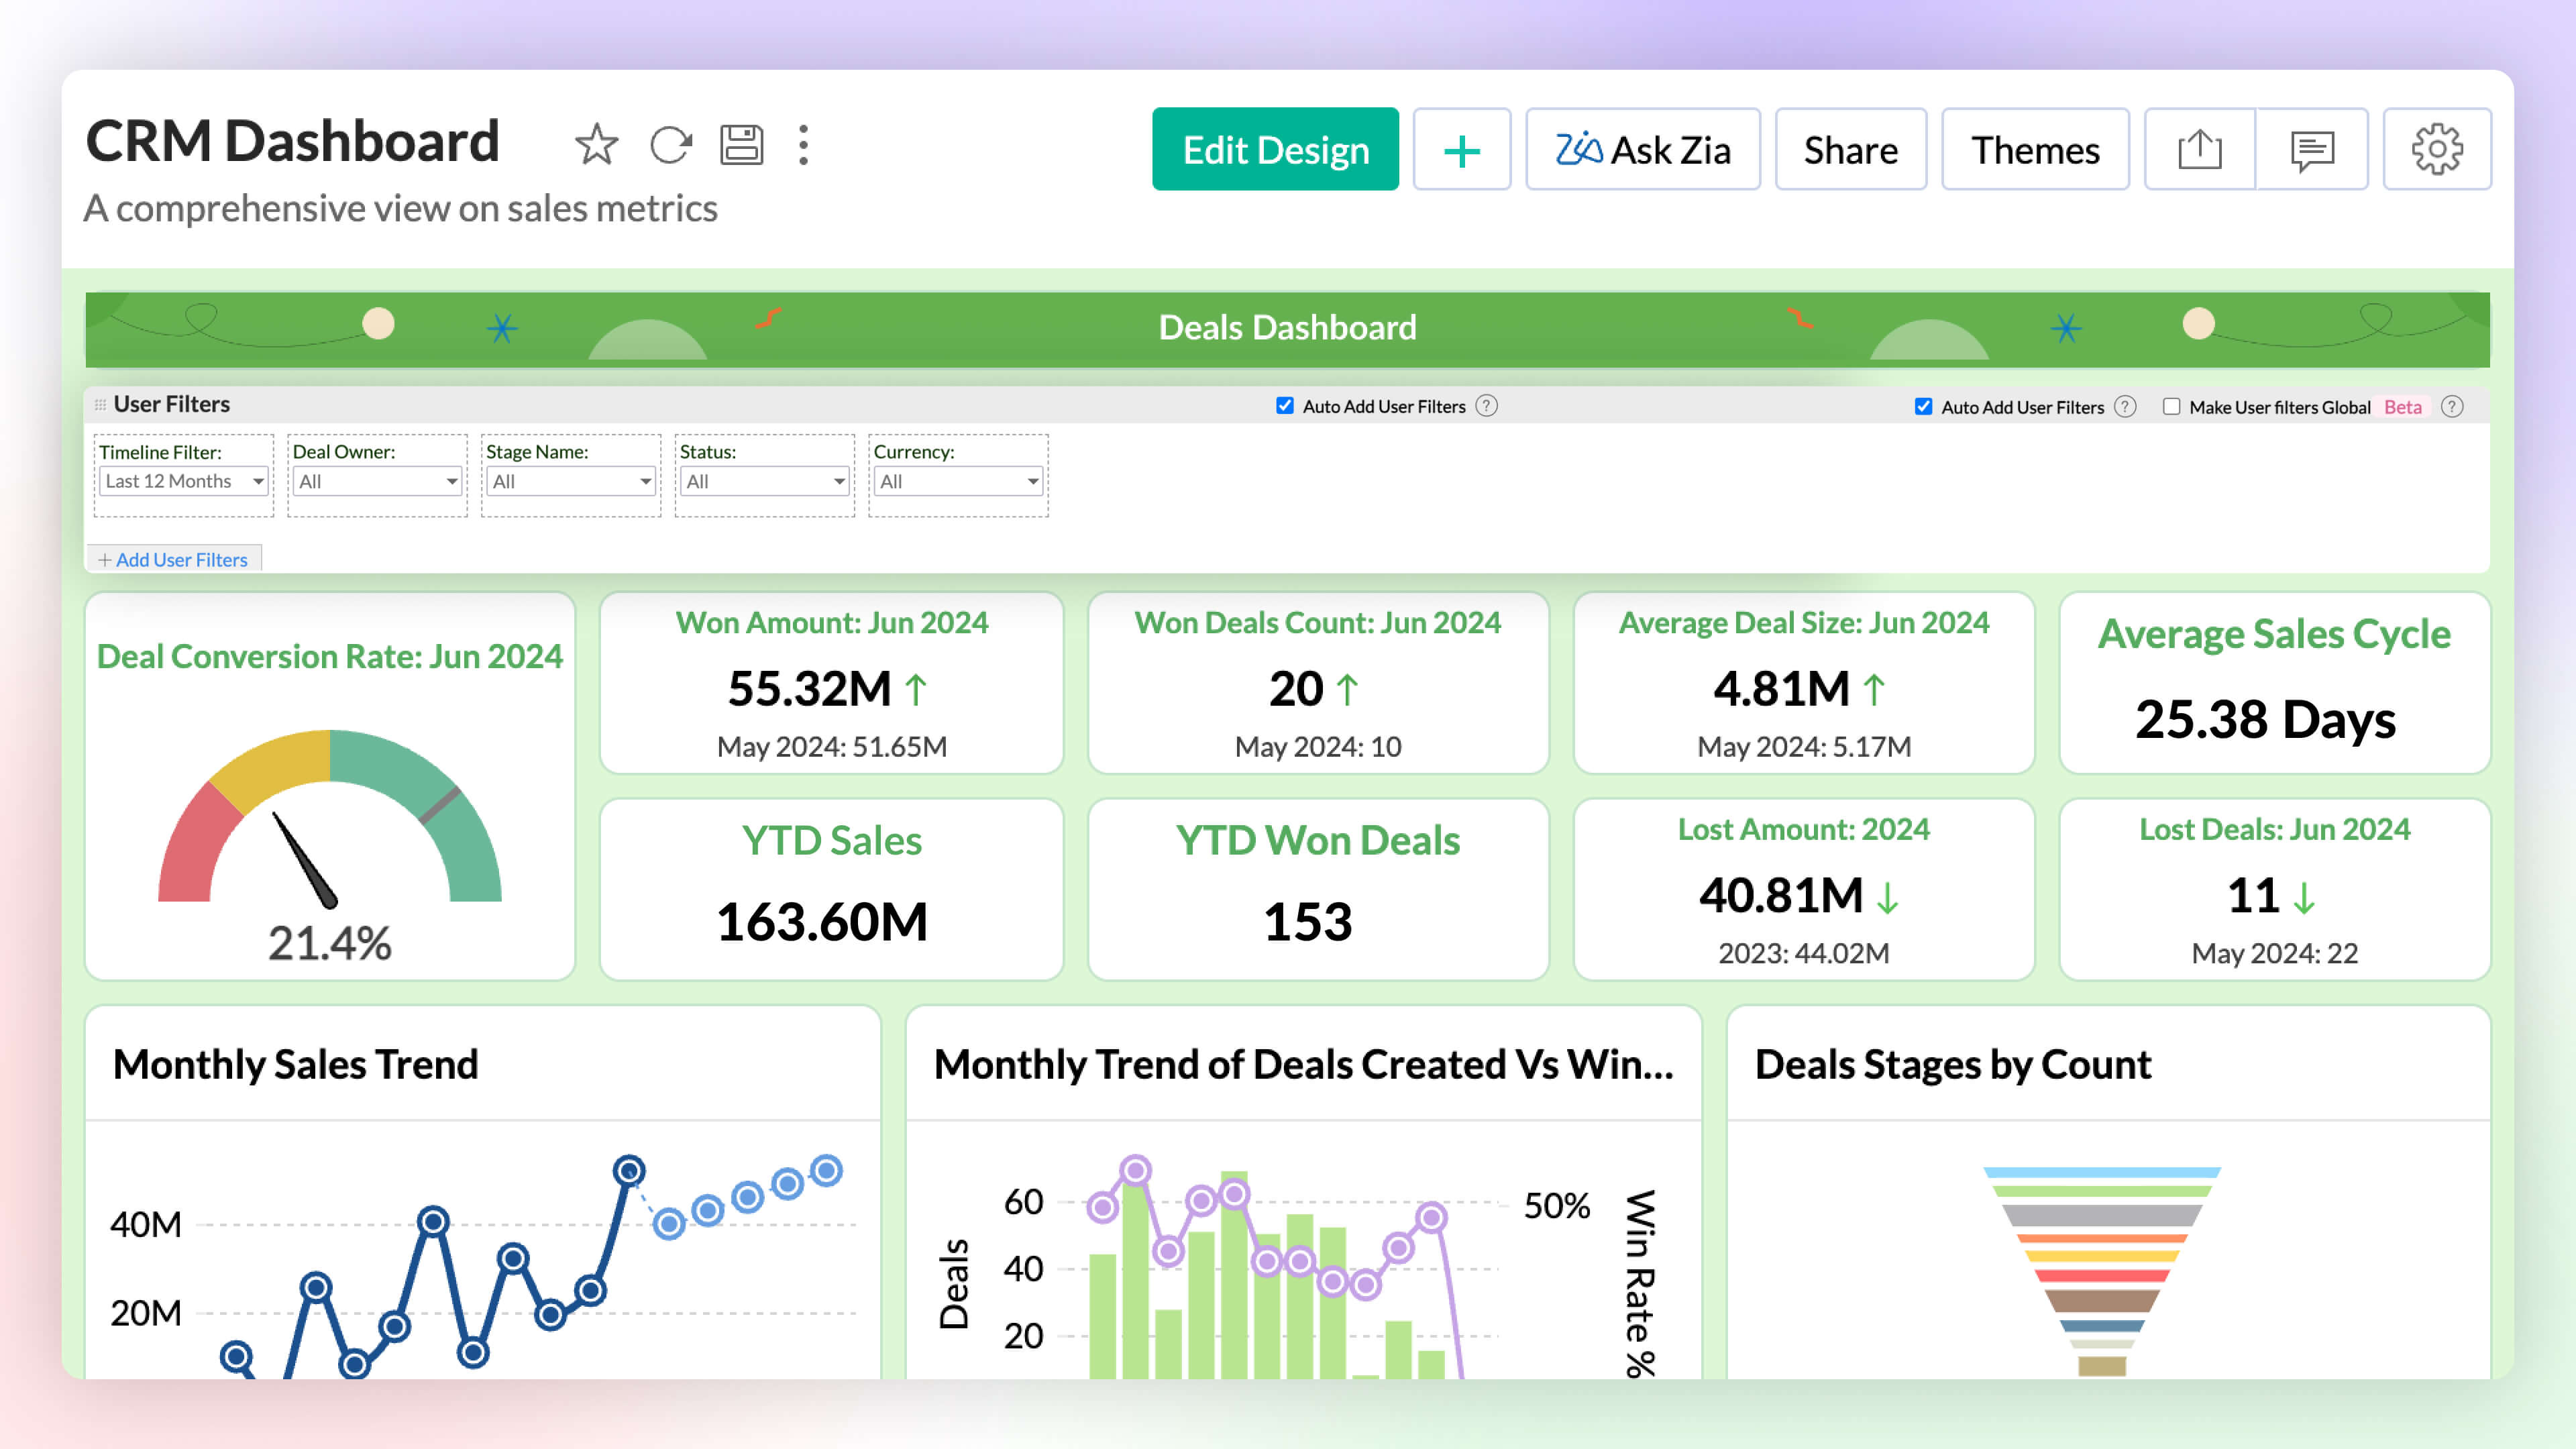
Expand the functionality of Global User Filters in your dashboard for deeper analysis with our latest enhancement. You can either select common filters across tabs as global filters or apply the same filter to all tabs when they share the same base data.
Learn more.
Sharing User Filter Presets
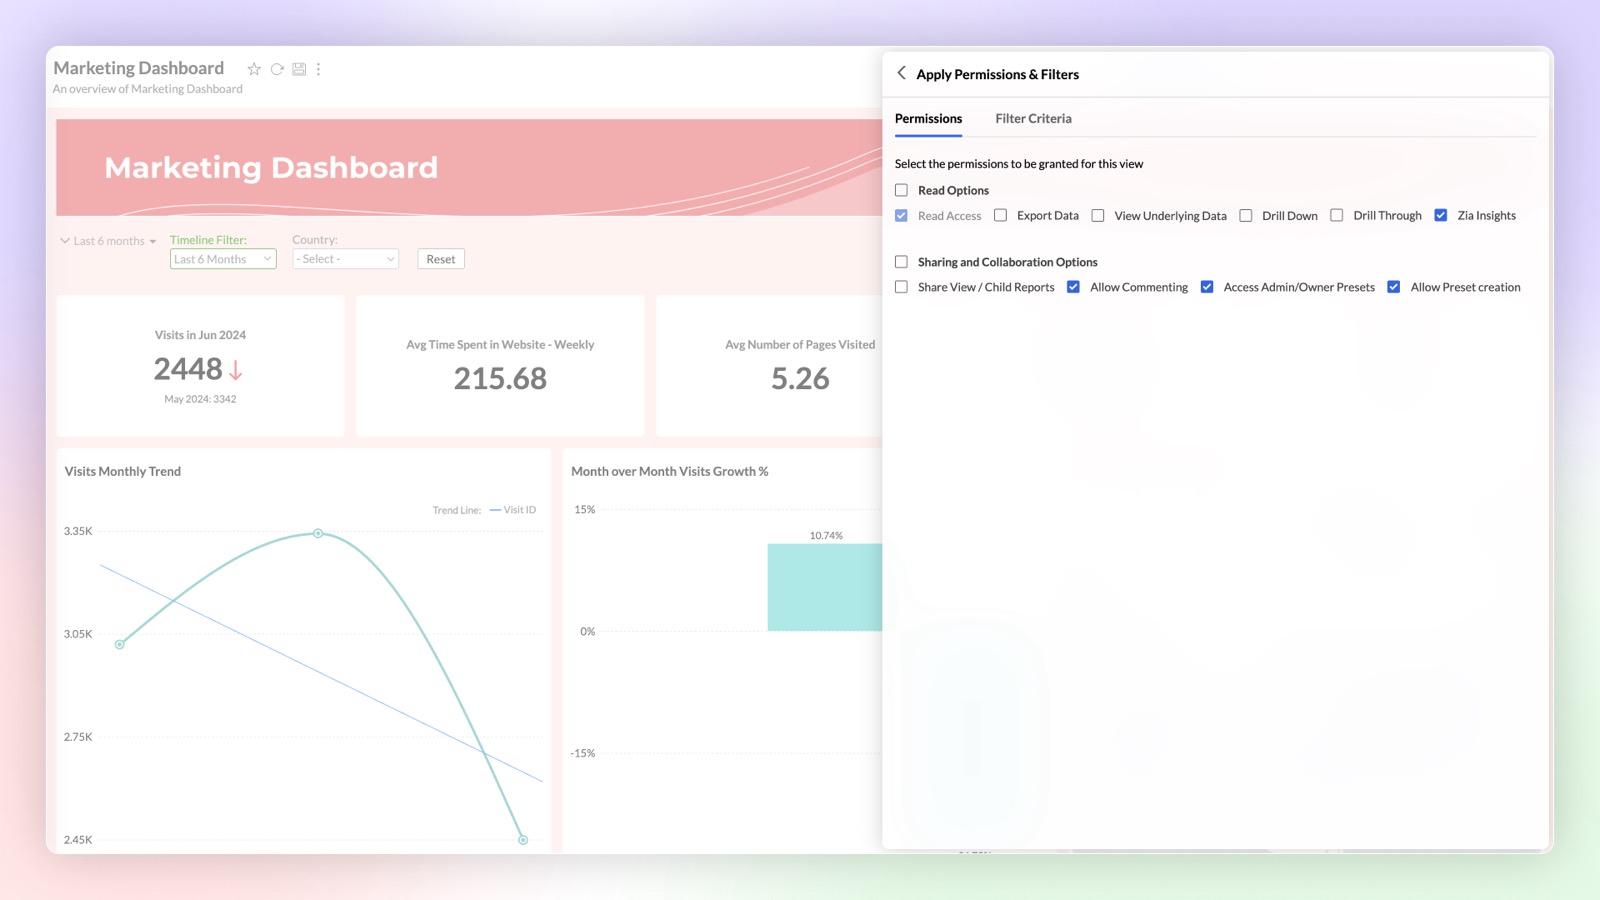
You can now share saved user filter presets with others alongside the dashboard. Dashboard users can utilize the shared presets or create their own custom presets.
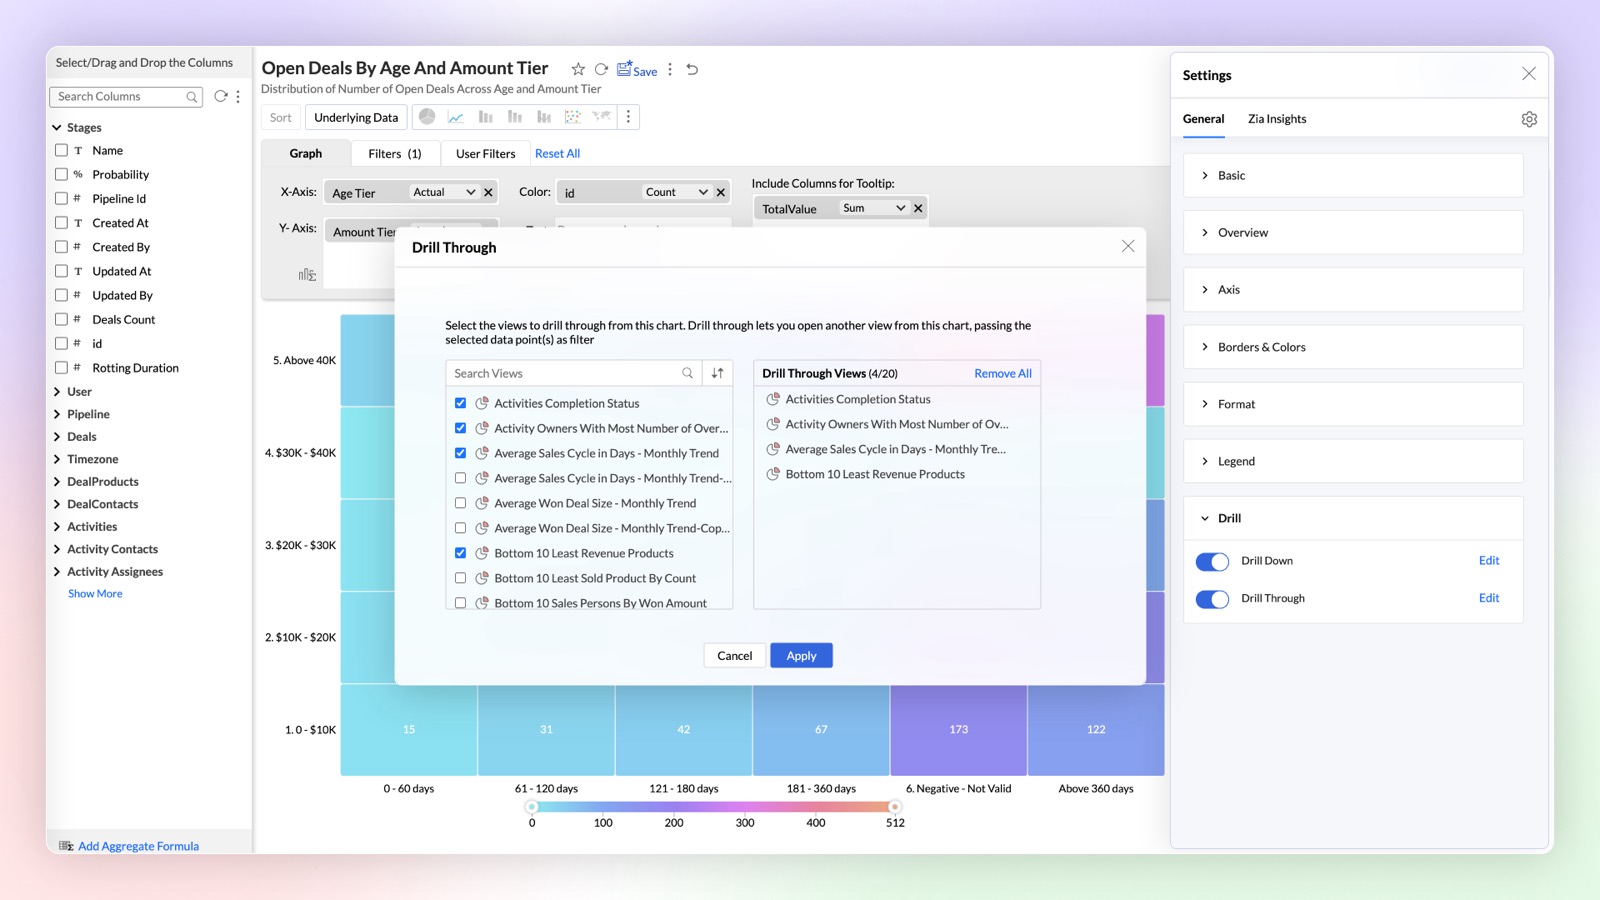
Drill Through
Navigate and view the reports related to the specific data points using the drill through function. You can easily link all the related reports specific to a metric or dimension.
Learn more.
Generative AI Infused Analytics
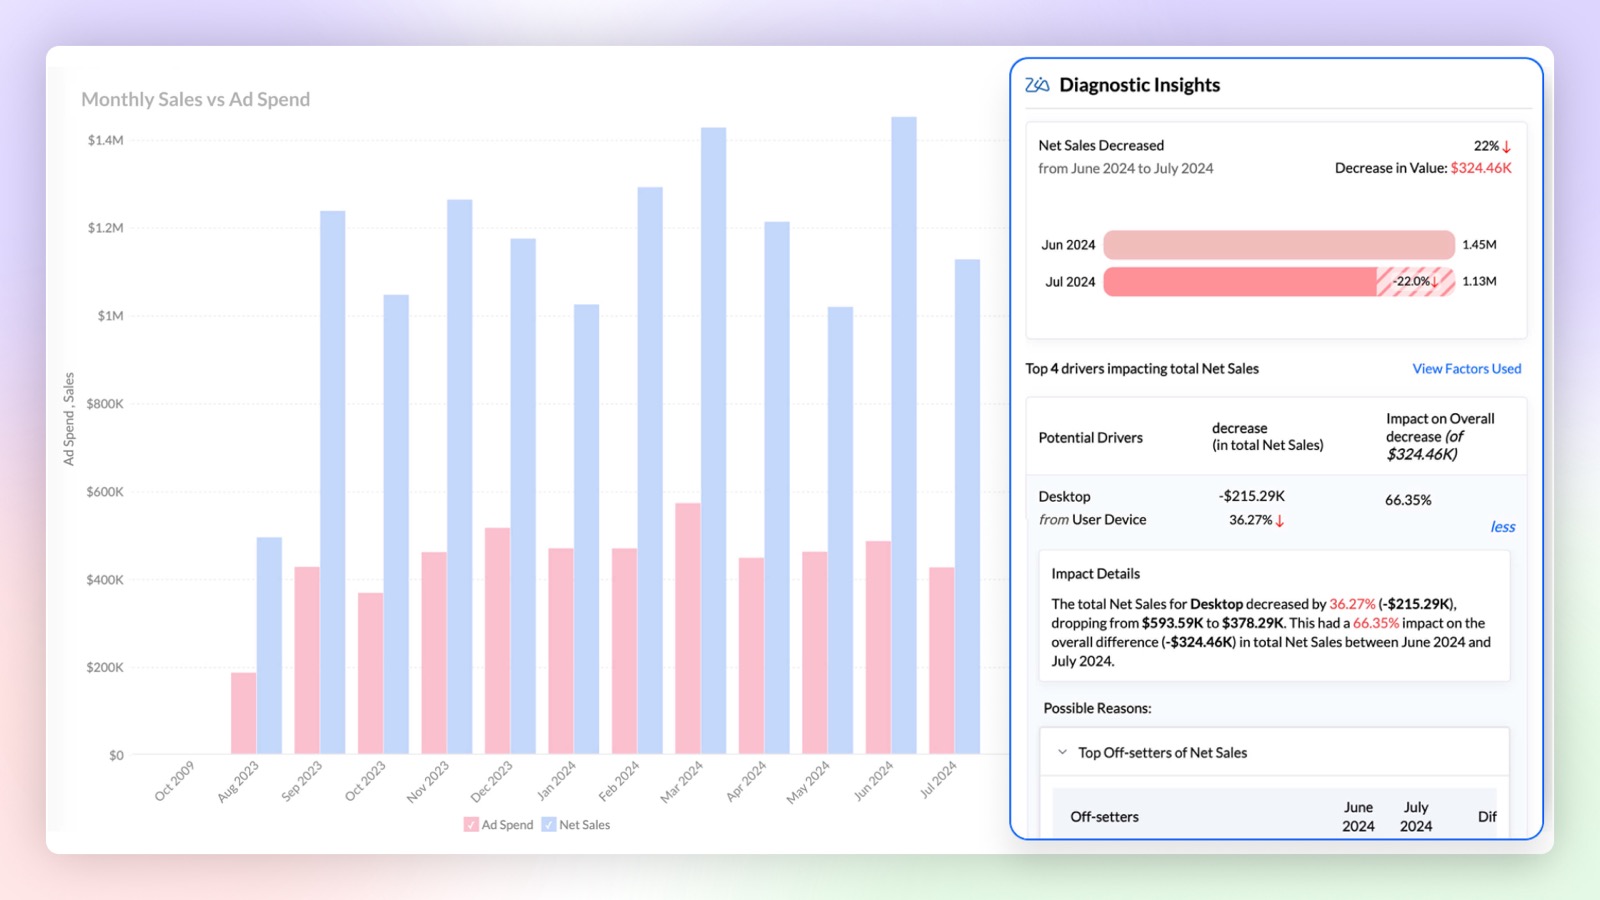
Diagnostics Insights
Find out the reason 'Why' behind any insight with diagnostic insights. Analyze the key drivers with significant impact and take informed actions based on these insights.
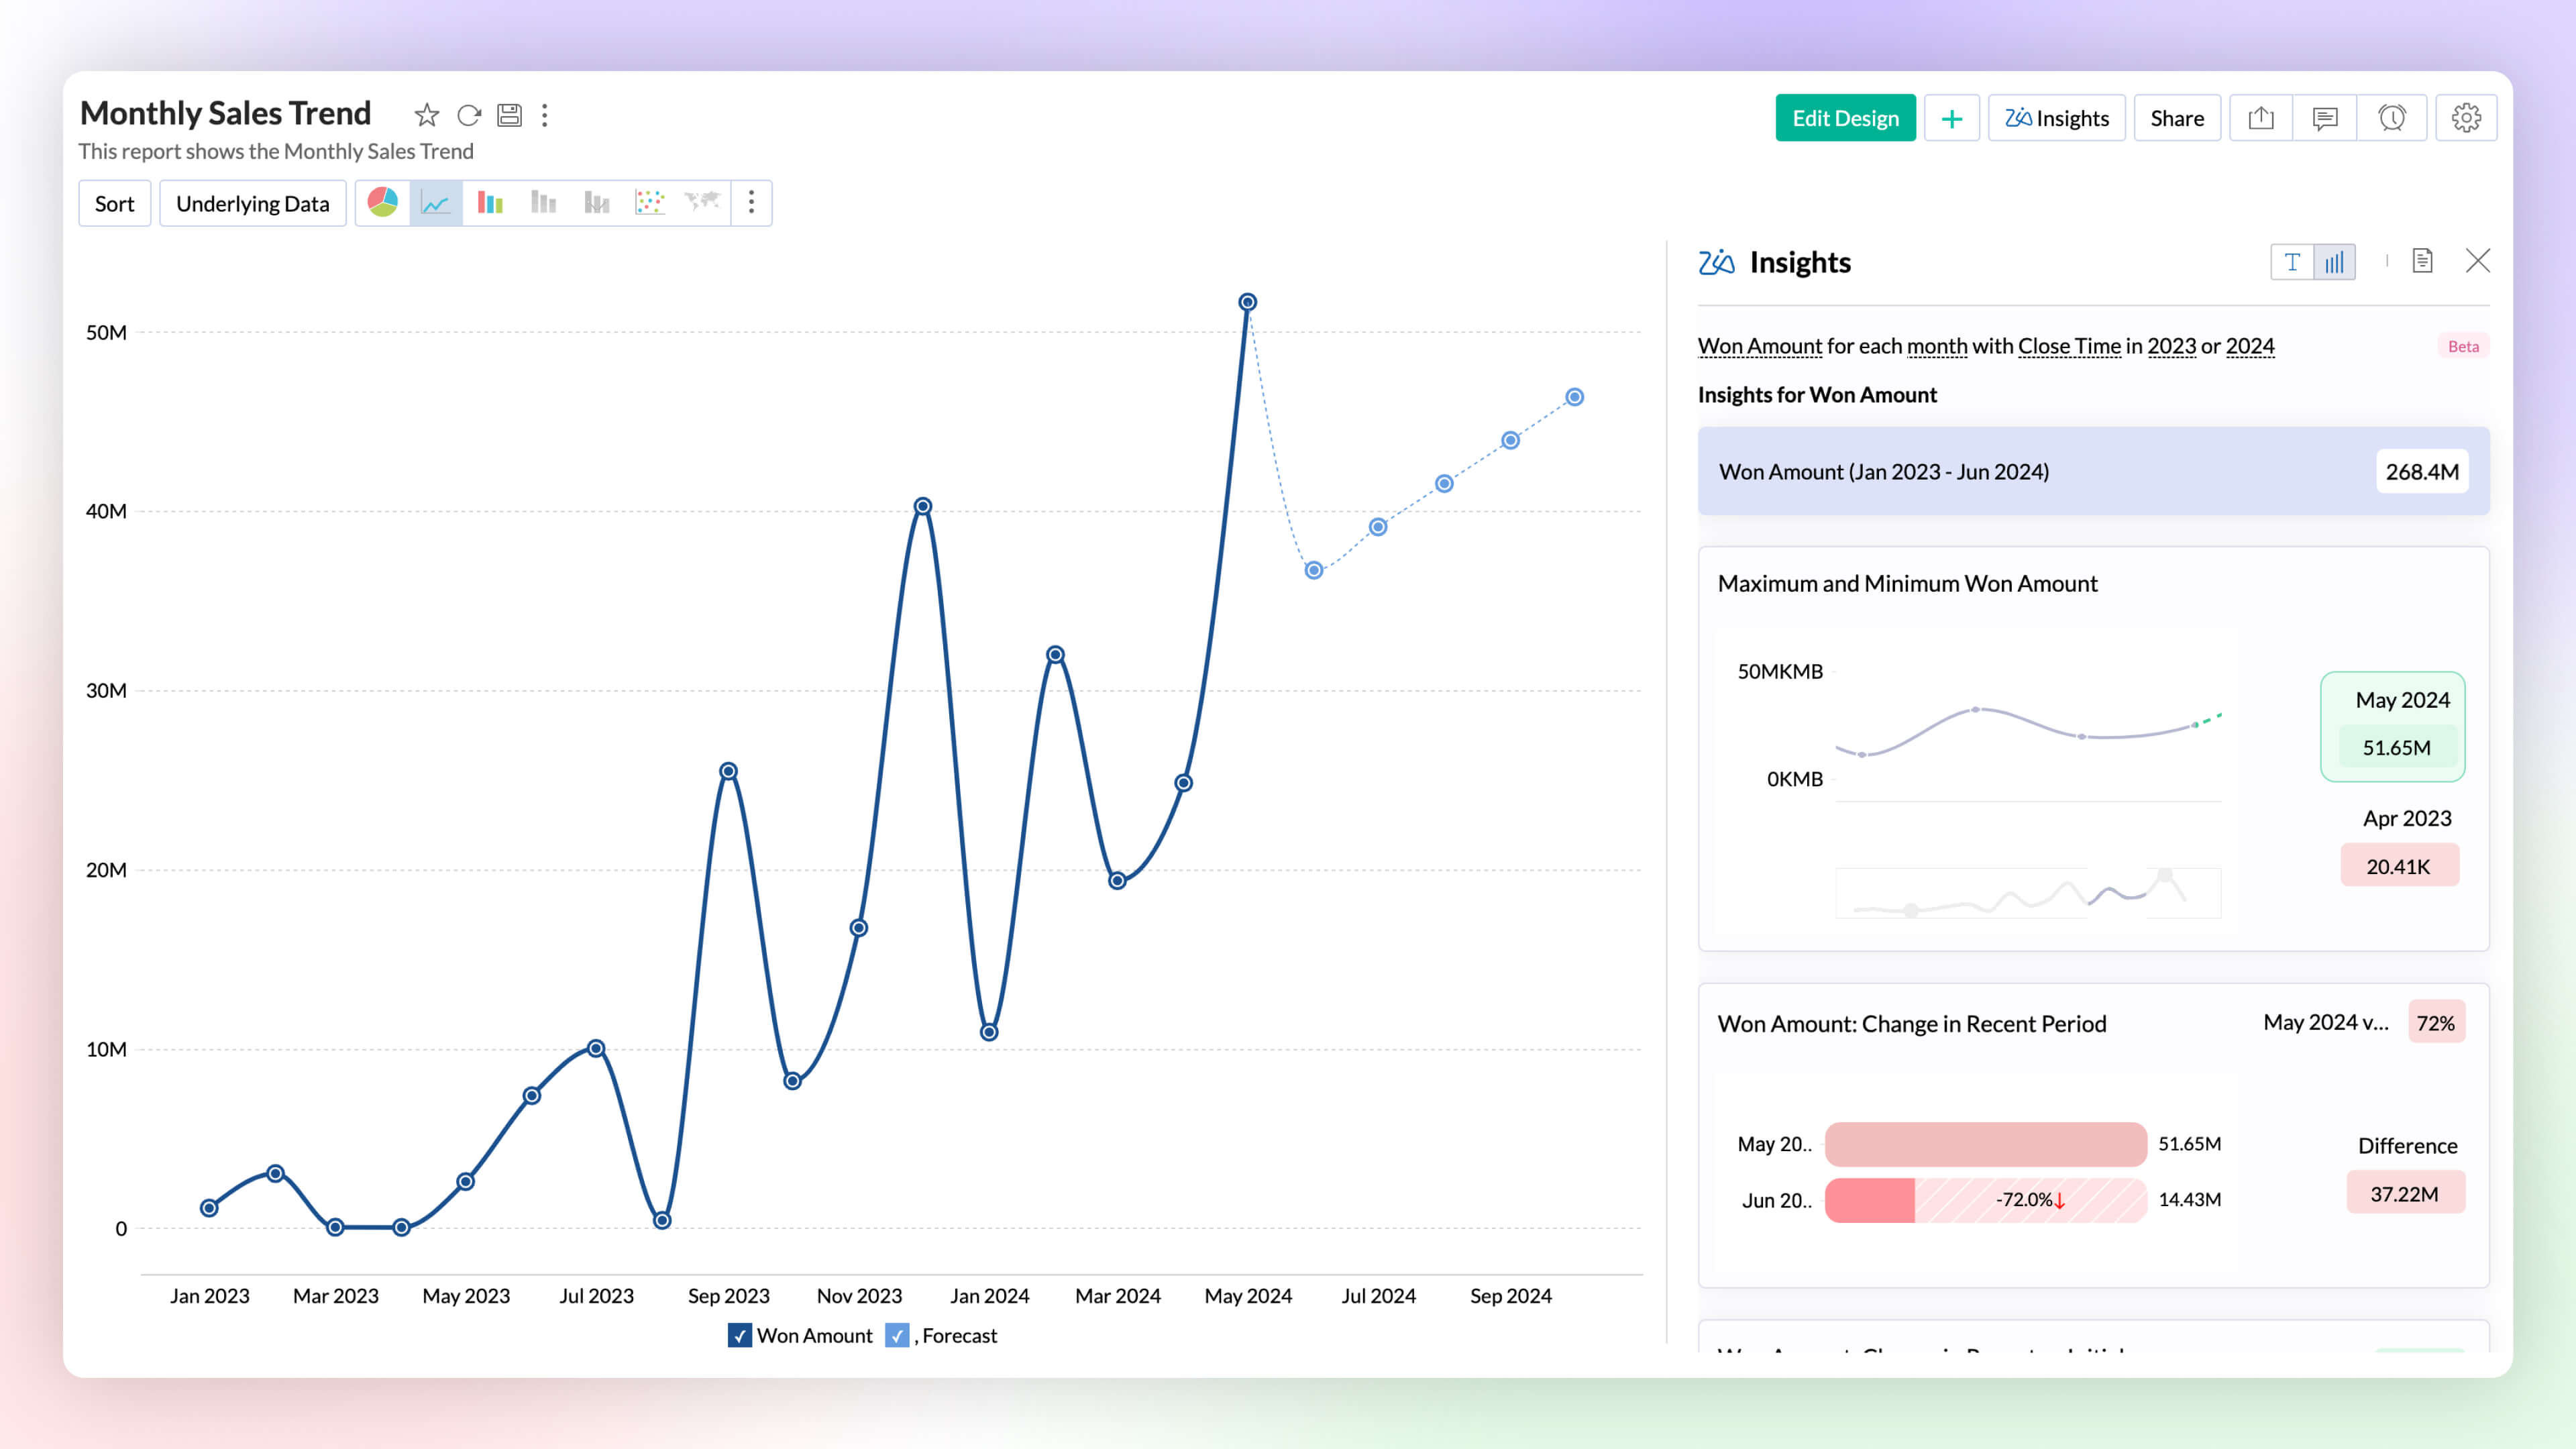
Visual Zia Insights
Zia Insights now provides visual narratives! Visuals help process information far more efficiently than lengthy text descriptions. These visuals facilitate multi-dimensional interpretations like comparison, contribution, distribution, trends and proportions.
Learn more.
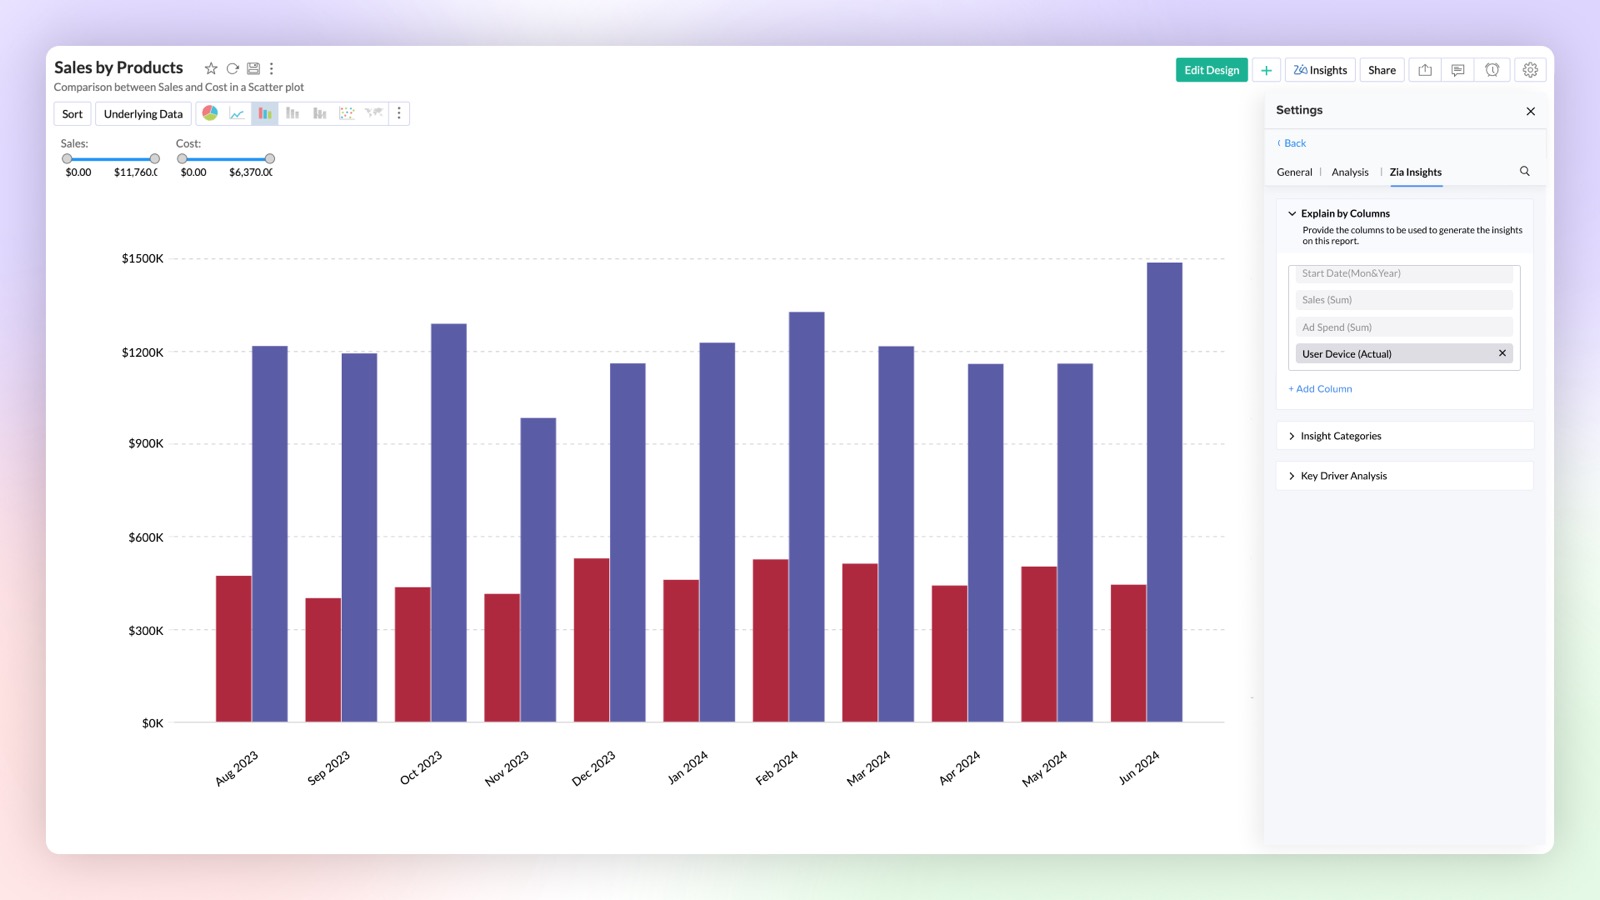
Configurable Insights
Customize the insights generated by Ask Zia to focus on the columns of your choice. This feature provides configurable insights tailored to your selected data.
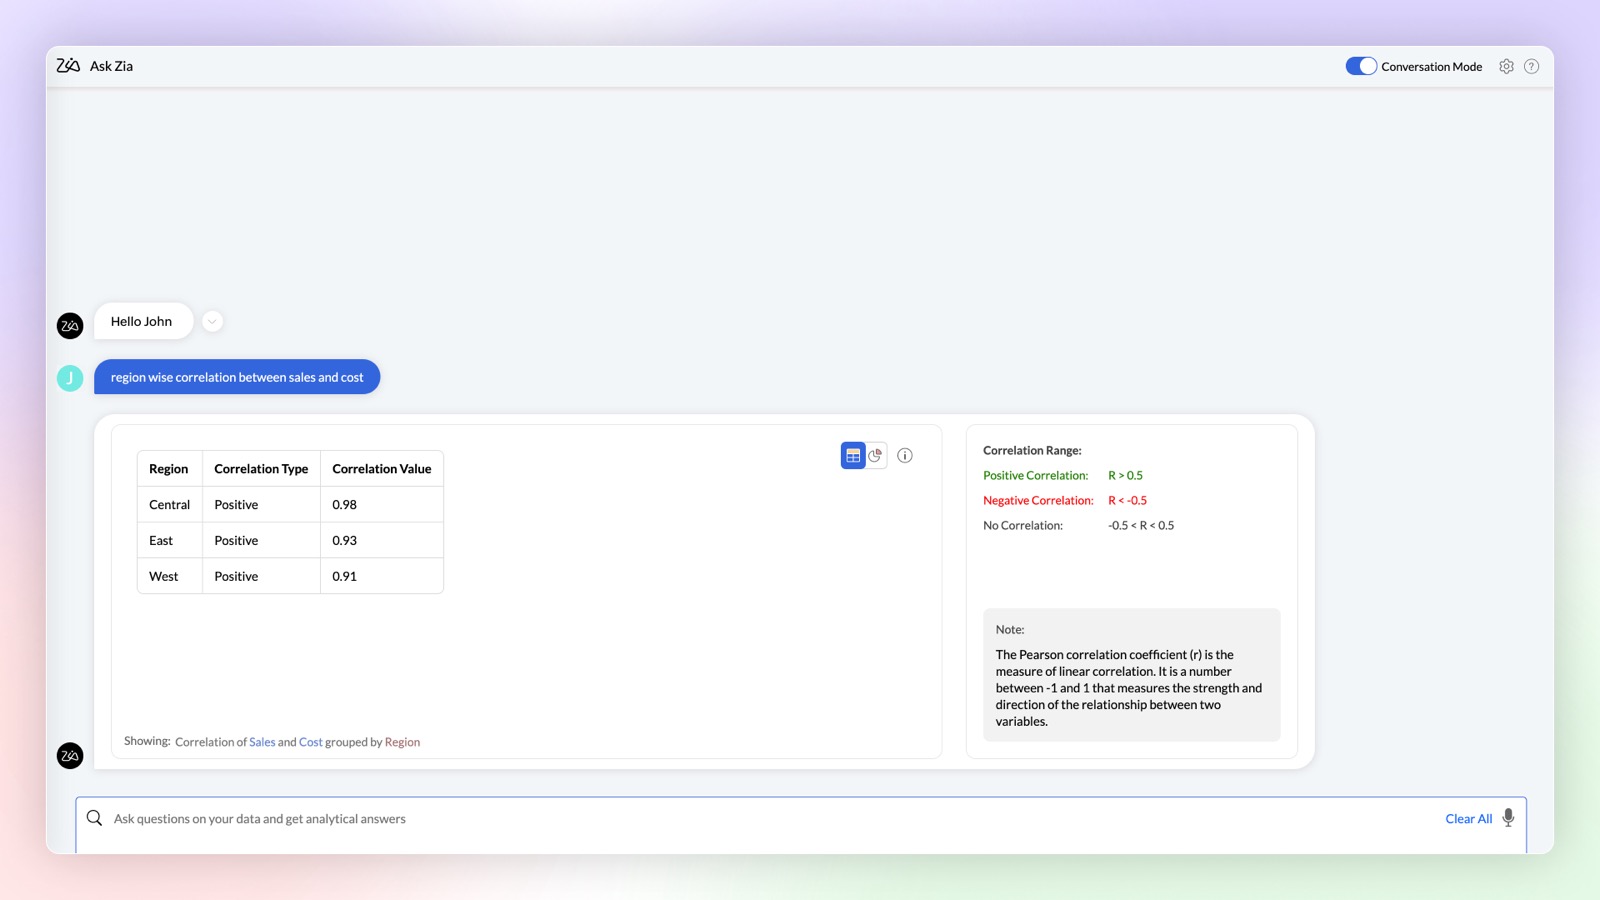
Complex Queries
Ask Zia in conversation mode can now provide you with results for complex mathematical queries to find correlation and trend strength in your data.
Learn more.
Enhancements in OpenAI Integration
- Increase the accuracy of your OpenAI results in Ask Zia by using your workspace metadata. This can be done by enabling the OpenAI RAG (Retrieval-Augmented Generation) feature in Organization Settings.
- You can now use OpenAI in Ask Zia conversation mode to create formulas and make data preparation easier by helping you build complex queries. Type your needs in simple language and get answers instantly.
- Workspace Admins can also use OpenAI integration in Ask Zia.
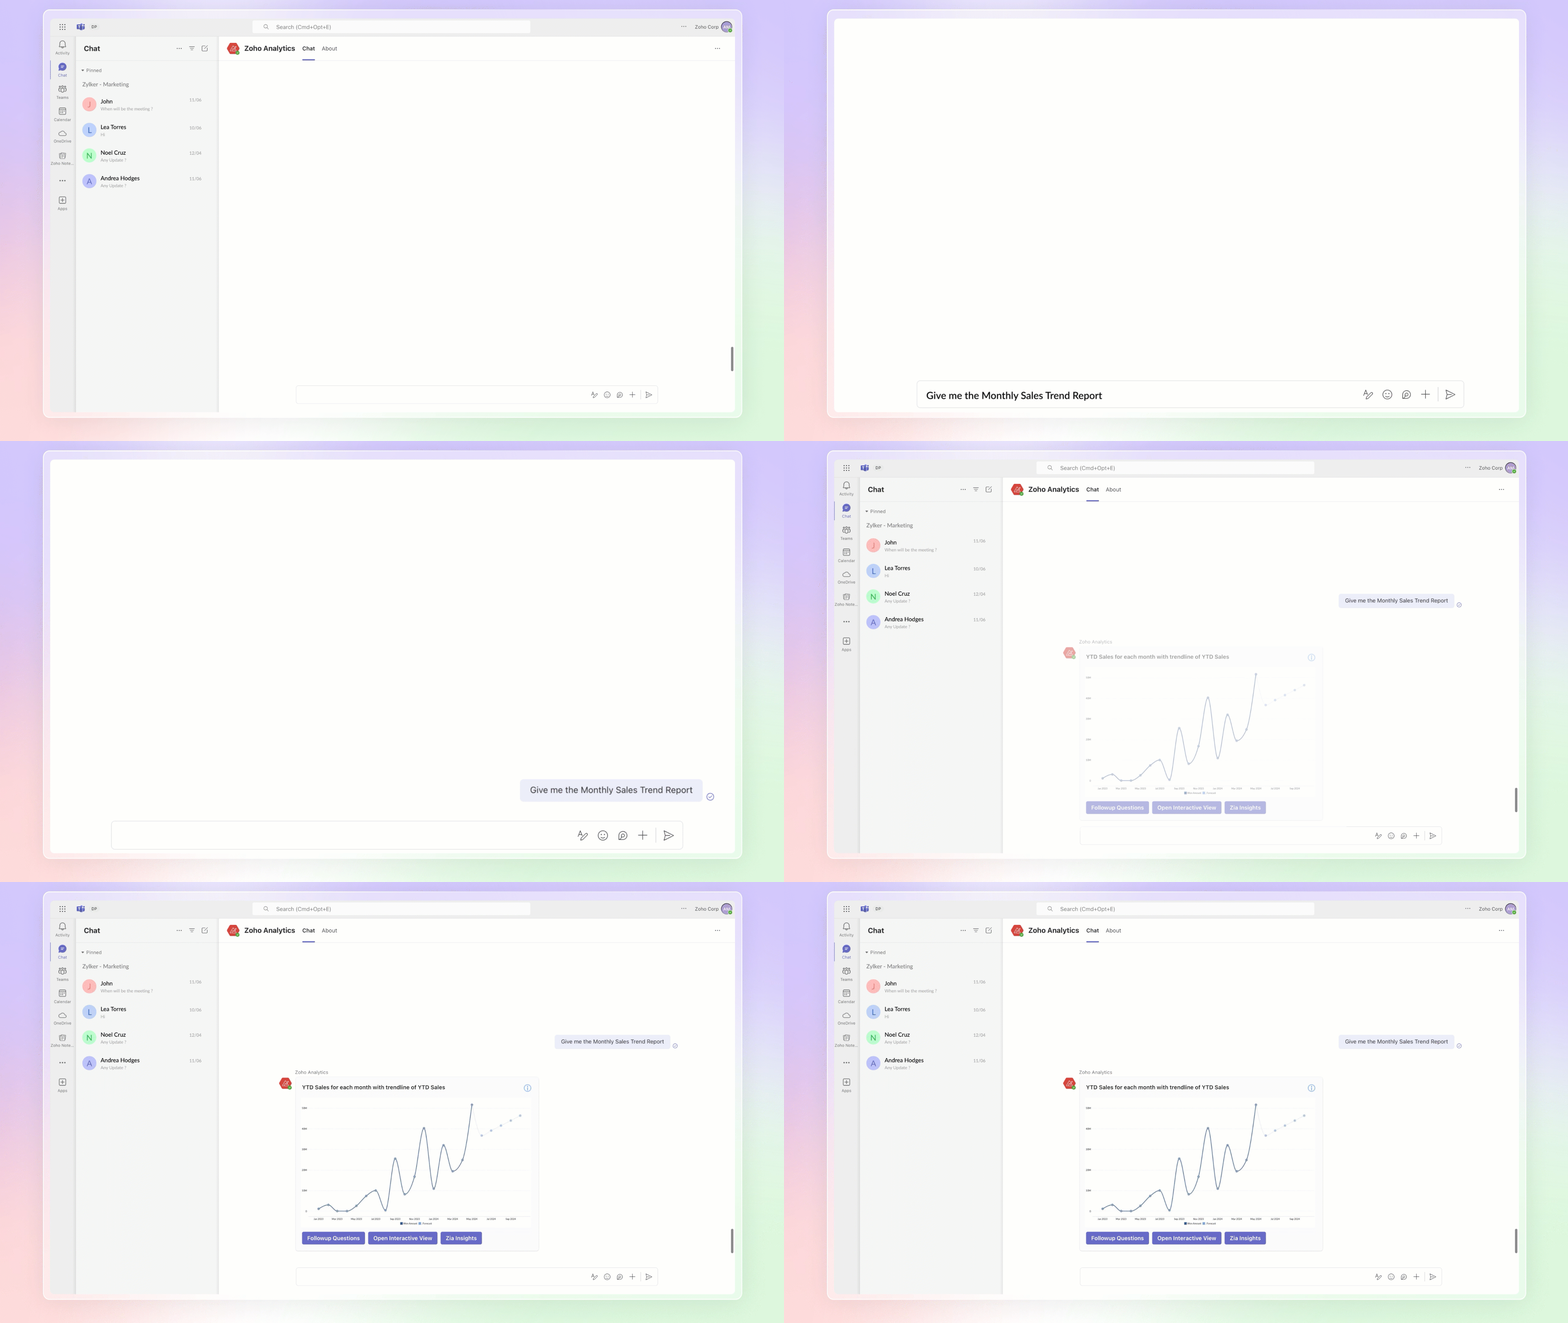
Ask Zia Bot in Microsoft Teams
Combine the generative AI capabilities of Zoho Analytics' Ask Zia with Microsoft Teams. Get answers to your data queries, access key business insights quickly, predict future trends, and build reports right from within Microsoft Teams with Ask Zia bot.
Learn more.
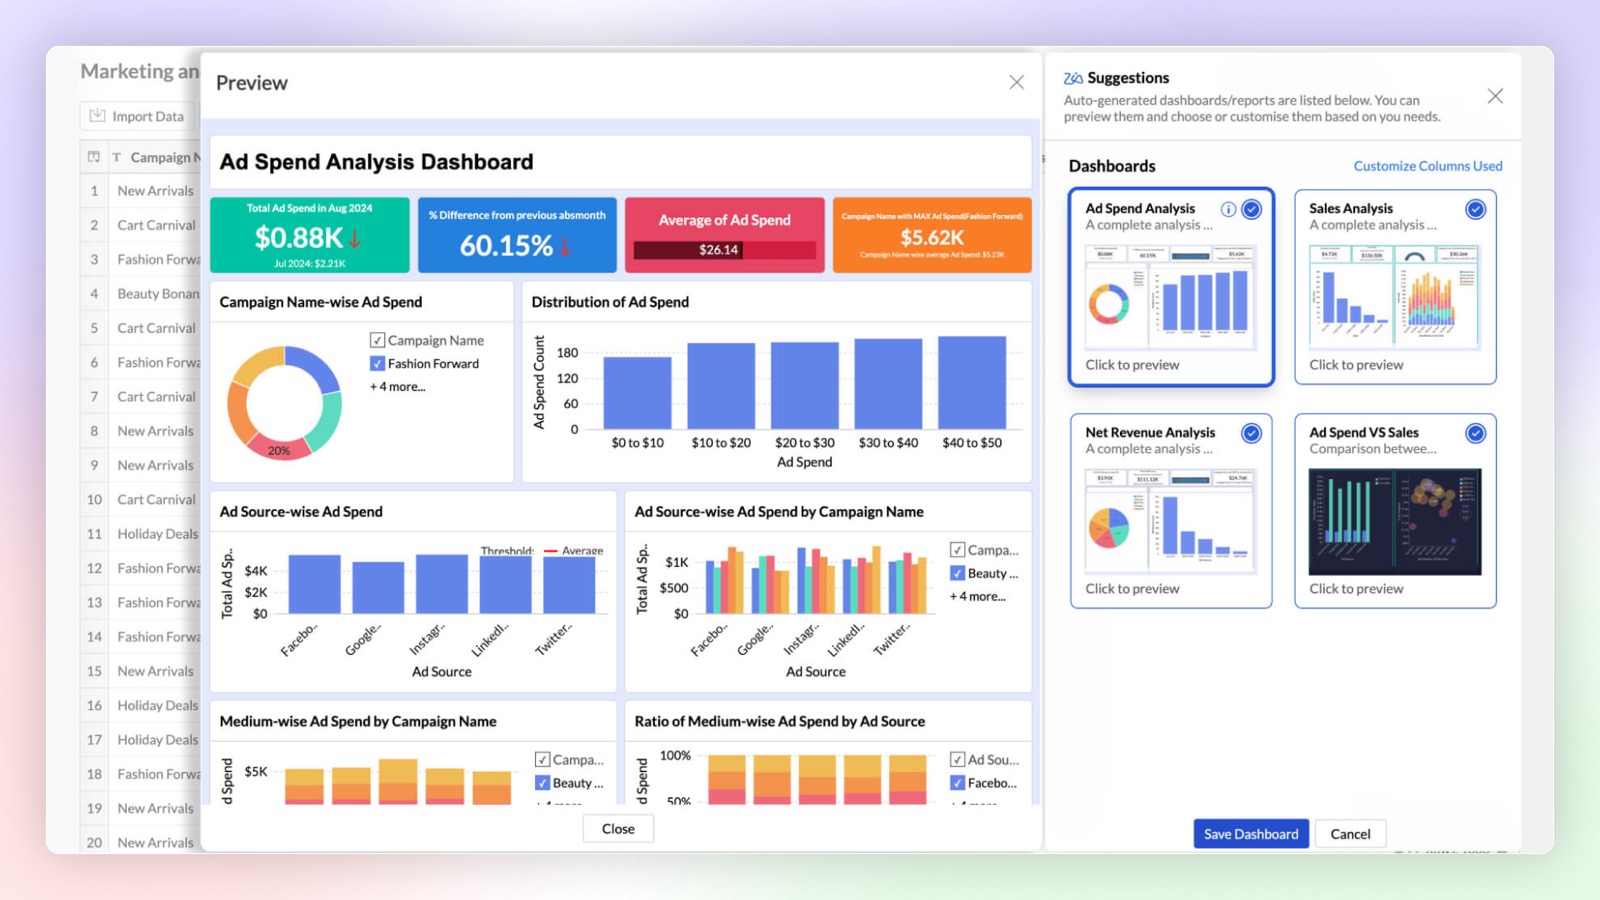
Auto Analyze 2.0
Zoho Analytics offers enhanced control over auto-generated reports and dashboards. You can choose from a list of generated reports and dashboards before adding them, and also select which columns should be auto-analyzed.
Learn more.
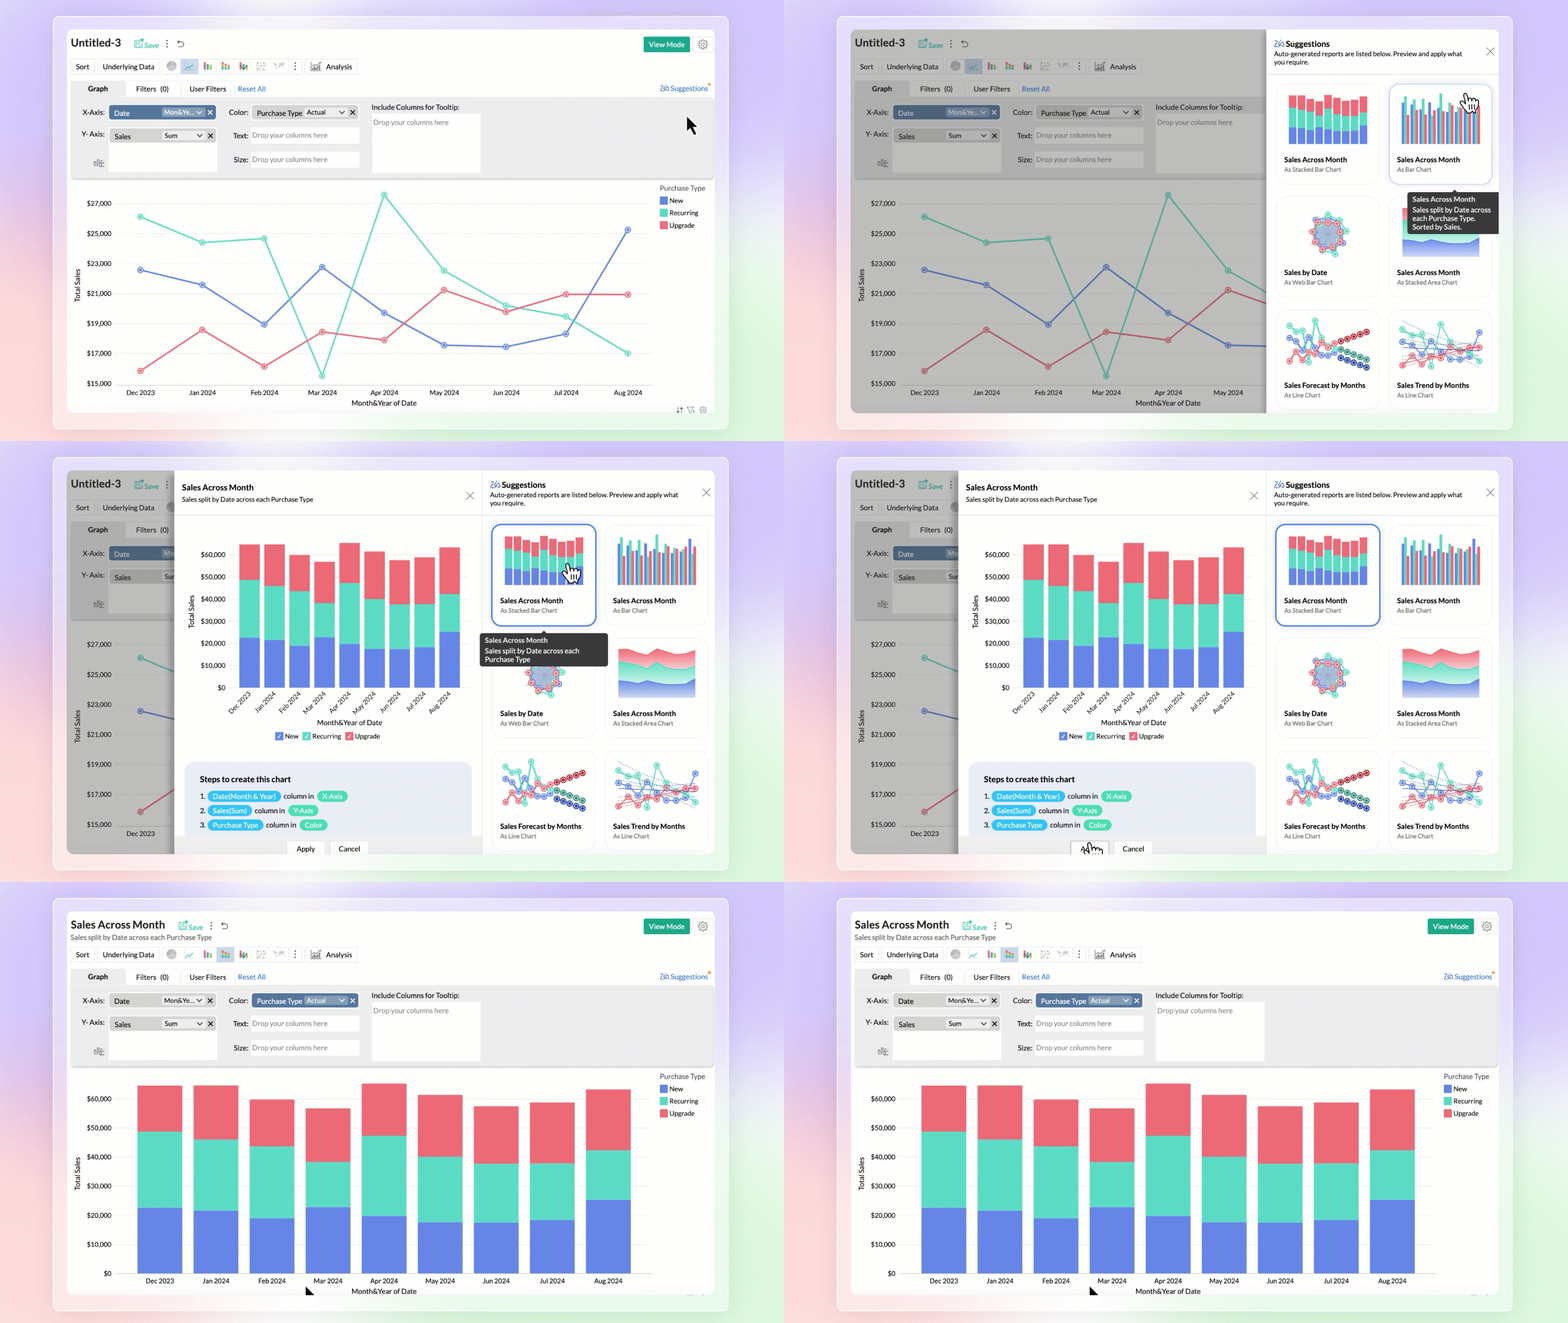
Zia Suggestions
Introducing the new Zia Suggestions, where you can receive smart chart recommendations during the creation process. Zia provides tailored chart options based on your data, allowing you to preview and apply them with a single click.
Learn more.
Predictive AI
Anomaly detection
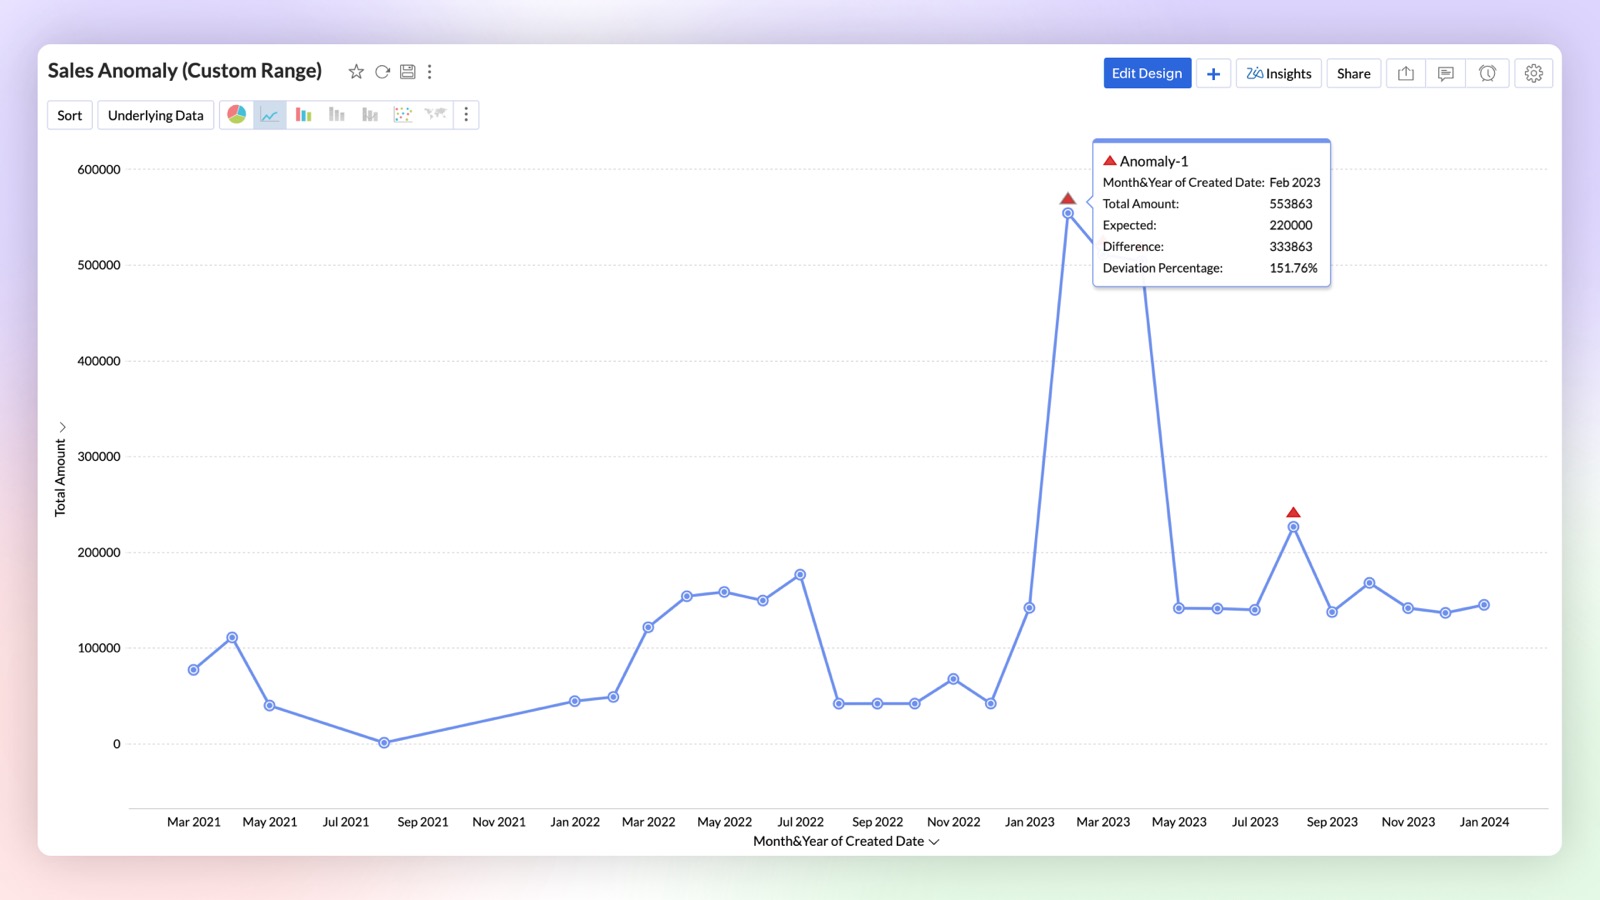
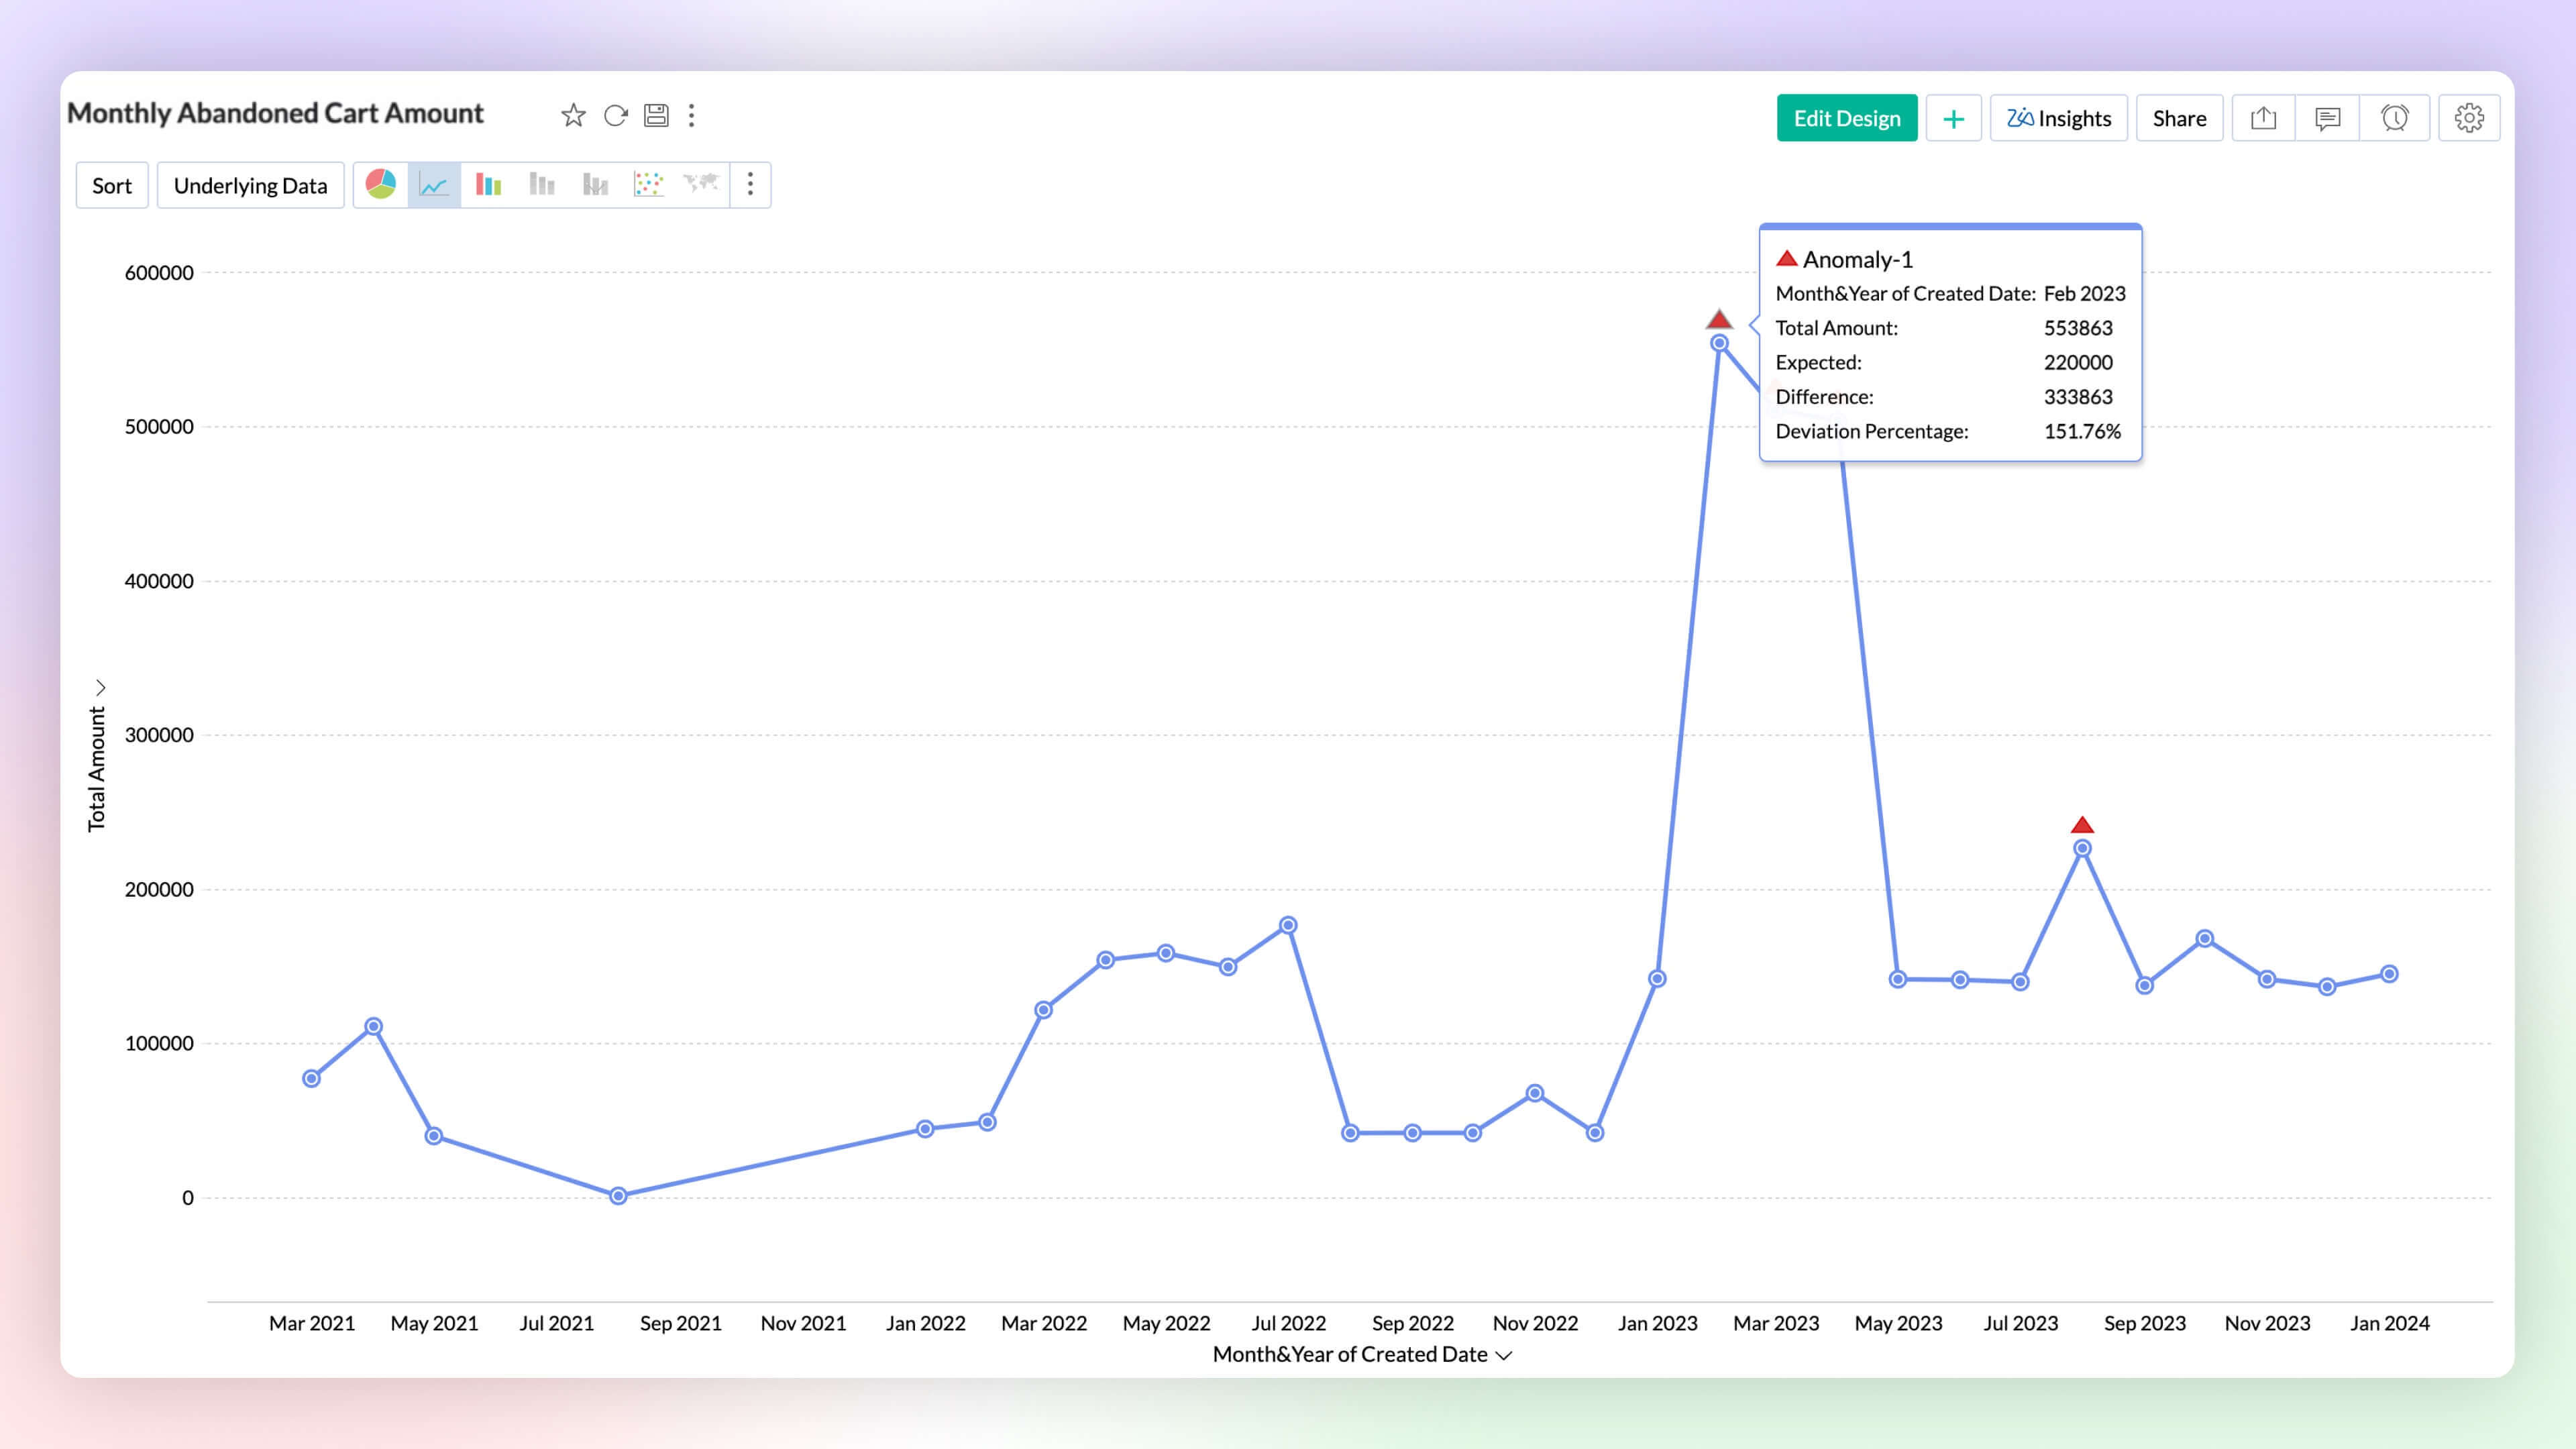
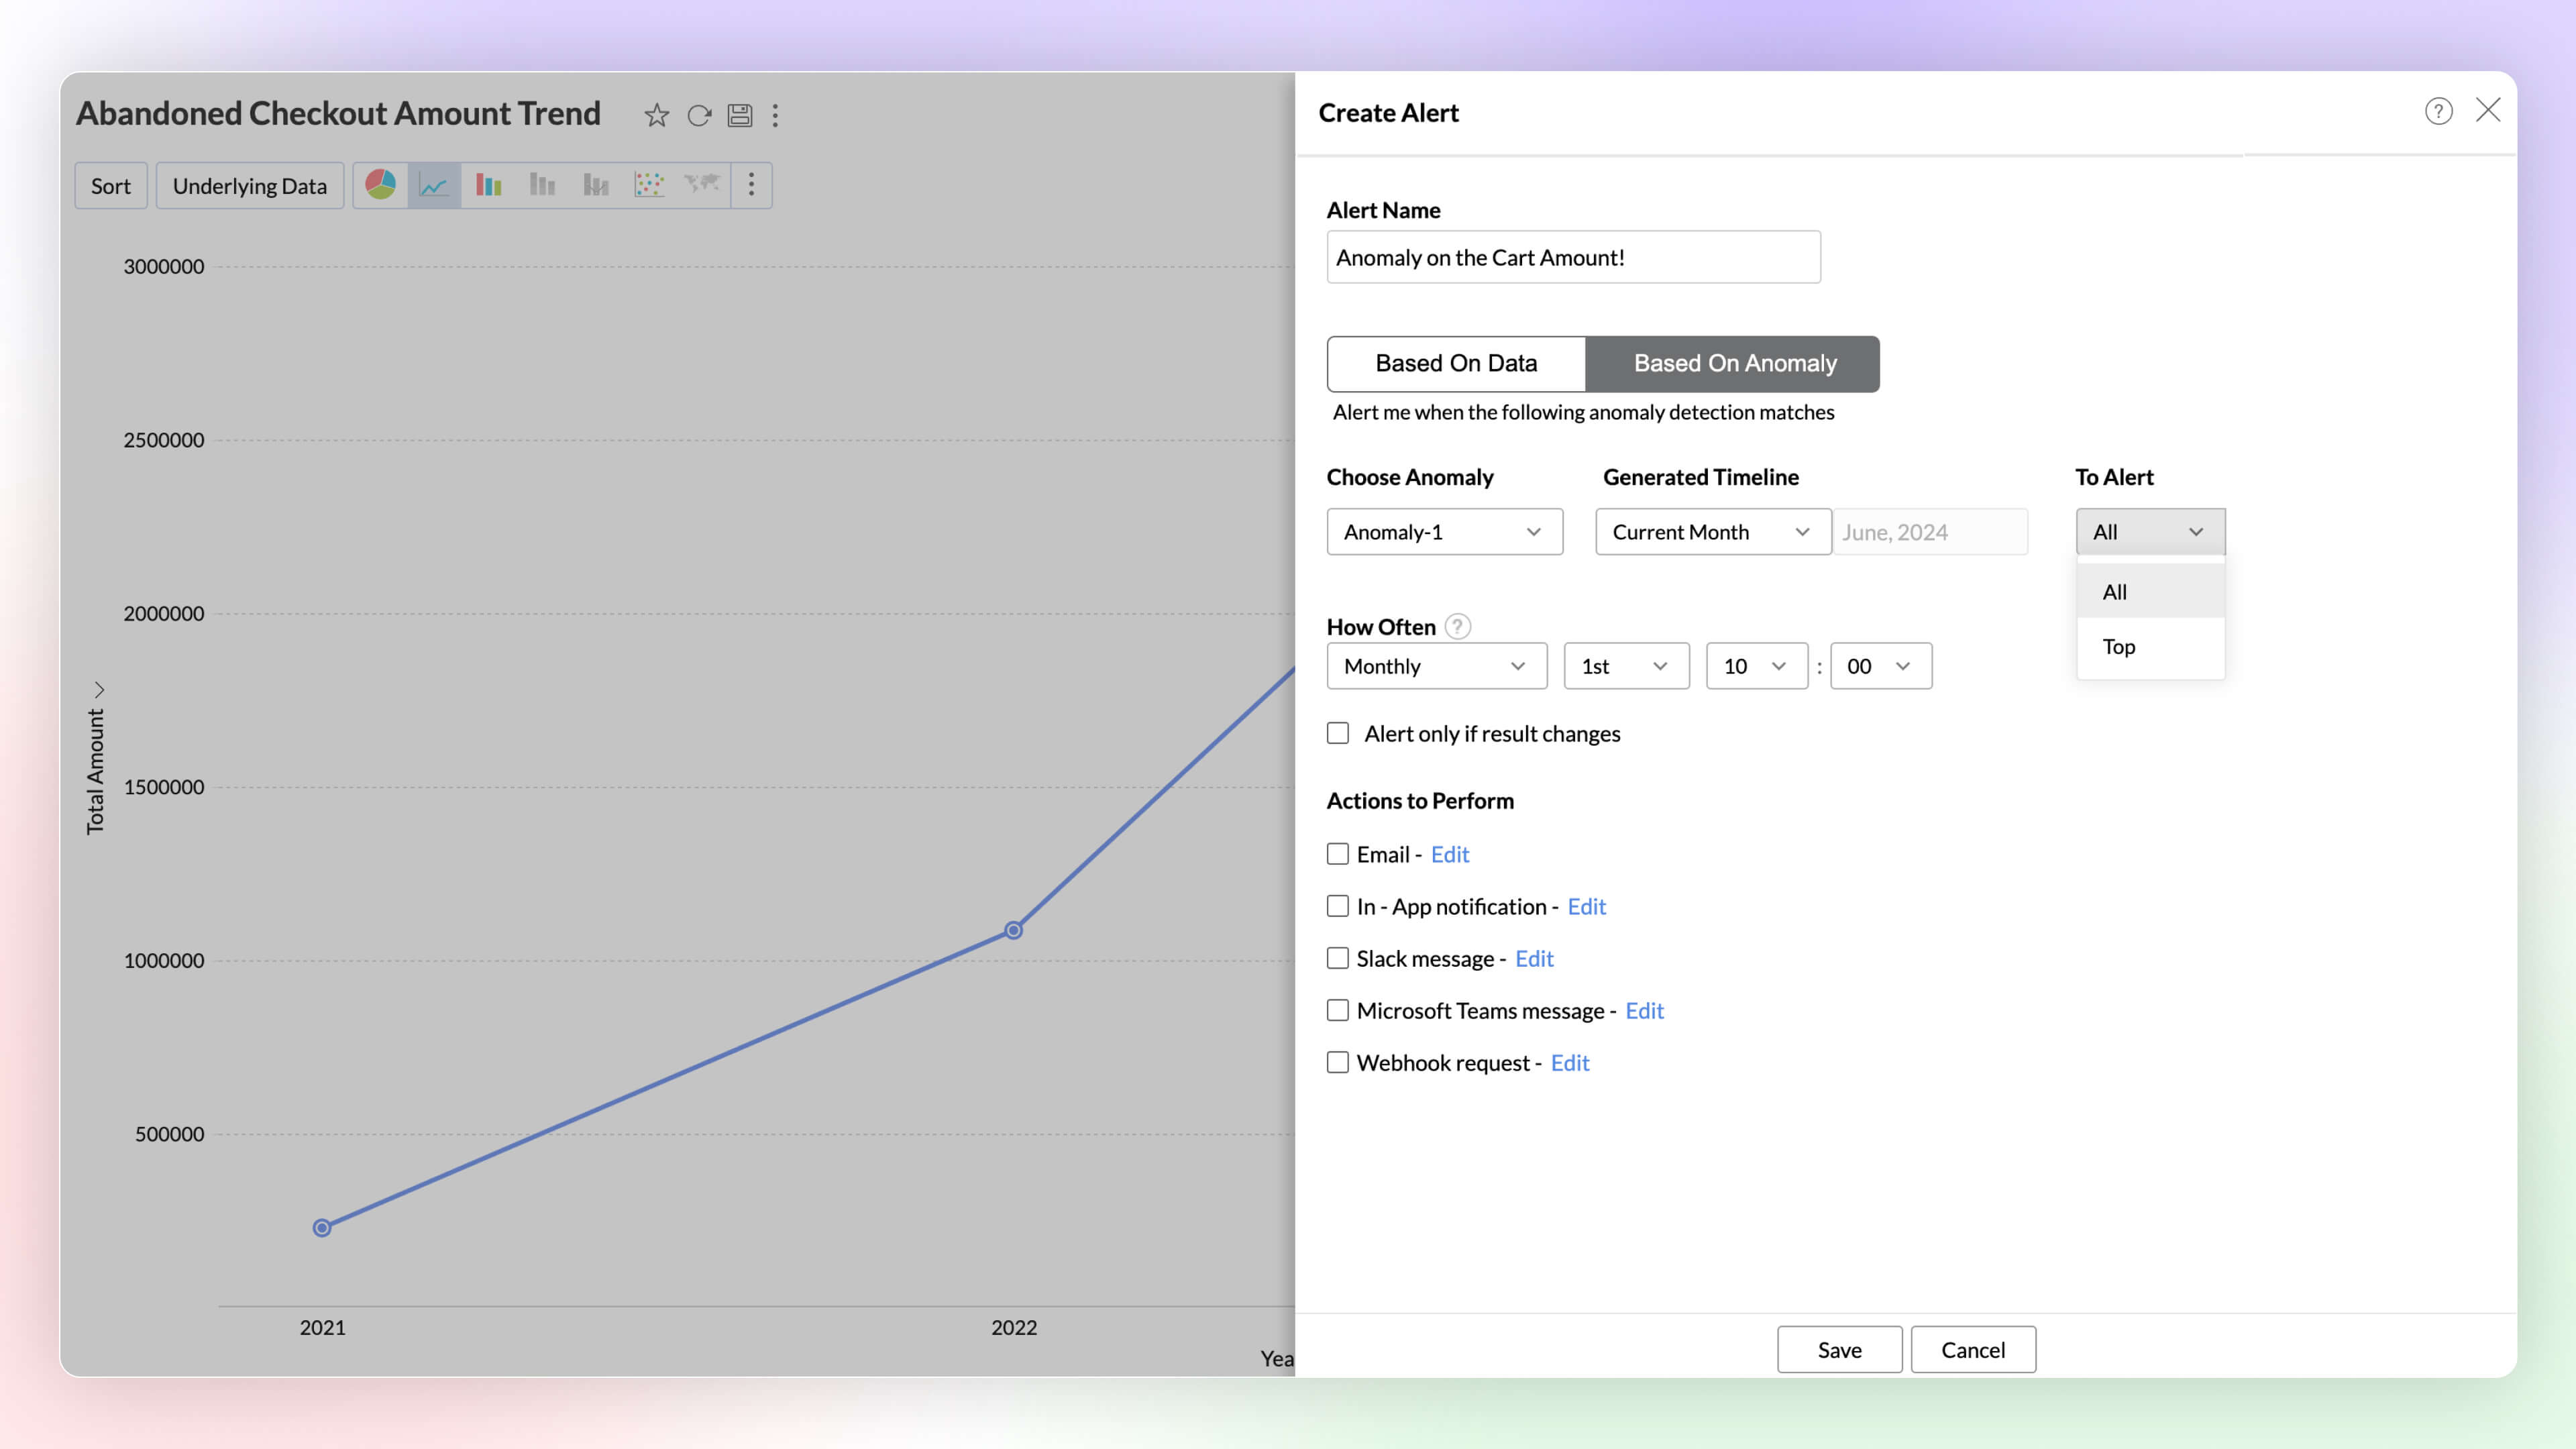
Anomaly detection allows you to easily identify outliers in your data or metrics. You can now create charts that visually highlight these anomalies for quick attention and action. Zoho Analytics uses advanced machine learning algorithms and statistical models to detect outliers. You can also set data alerts based on anomalies to ensure timely identification of vital change in the key business metrics and potential issues.
Learn more.
Influencing Factors in Forecasting (Multi-variate forecasting)
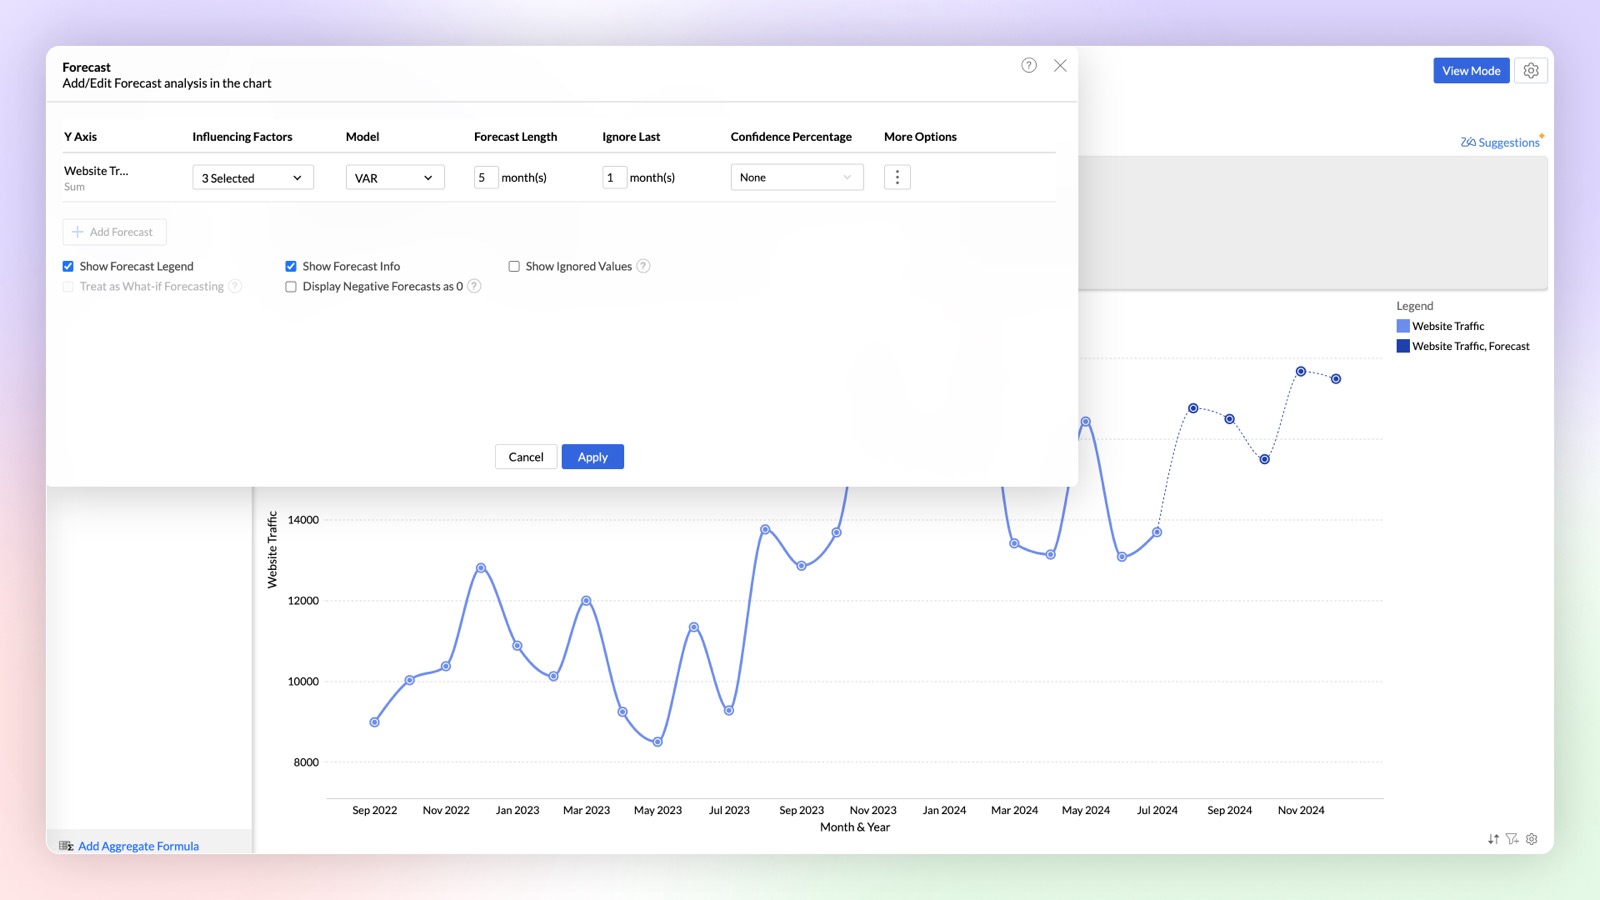
Try our new influencing factors option in forecasting, that enables you to provide dependent factors for accurate prediction of outcomes. For example, when you forecast a sales metric it will just predict purely based on historical data, but you can get more accurate predictions in forecast by considering influencing (dependent) factors like marketing spending, sign ups, etc.,
Learn more.
Cluster Analysis Premium Plan
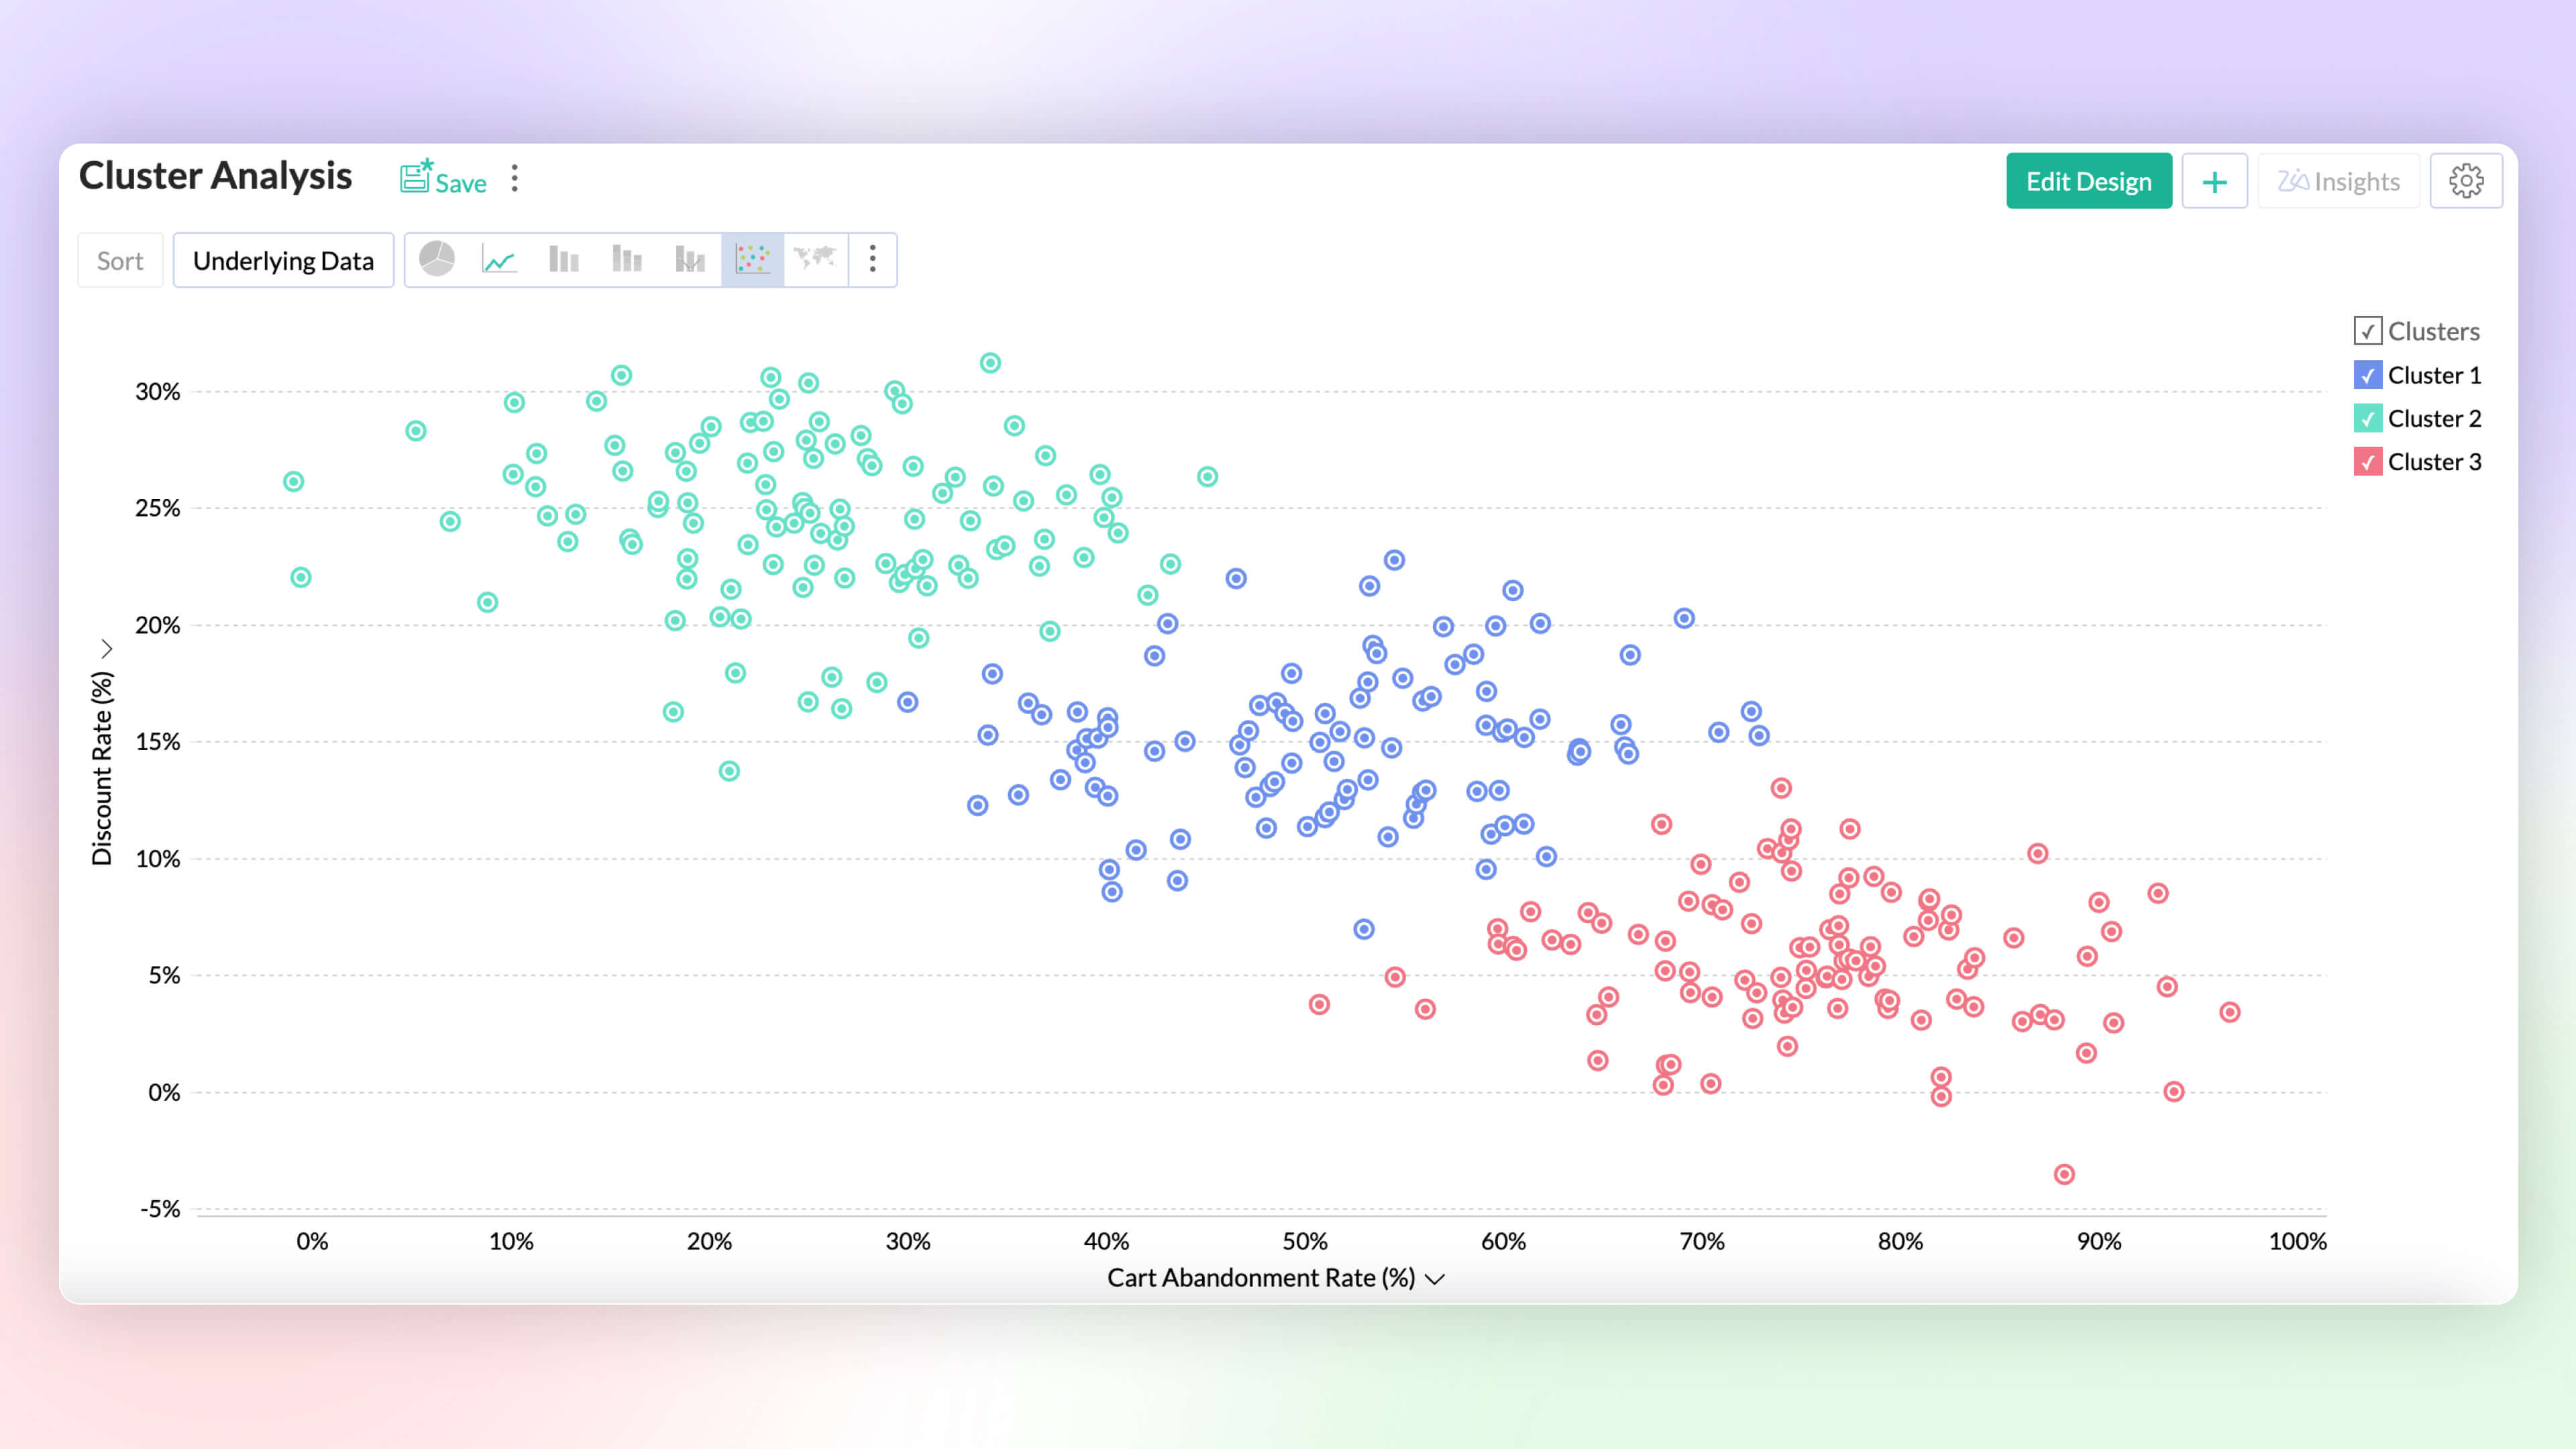
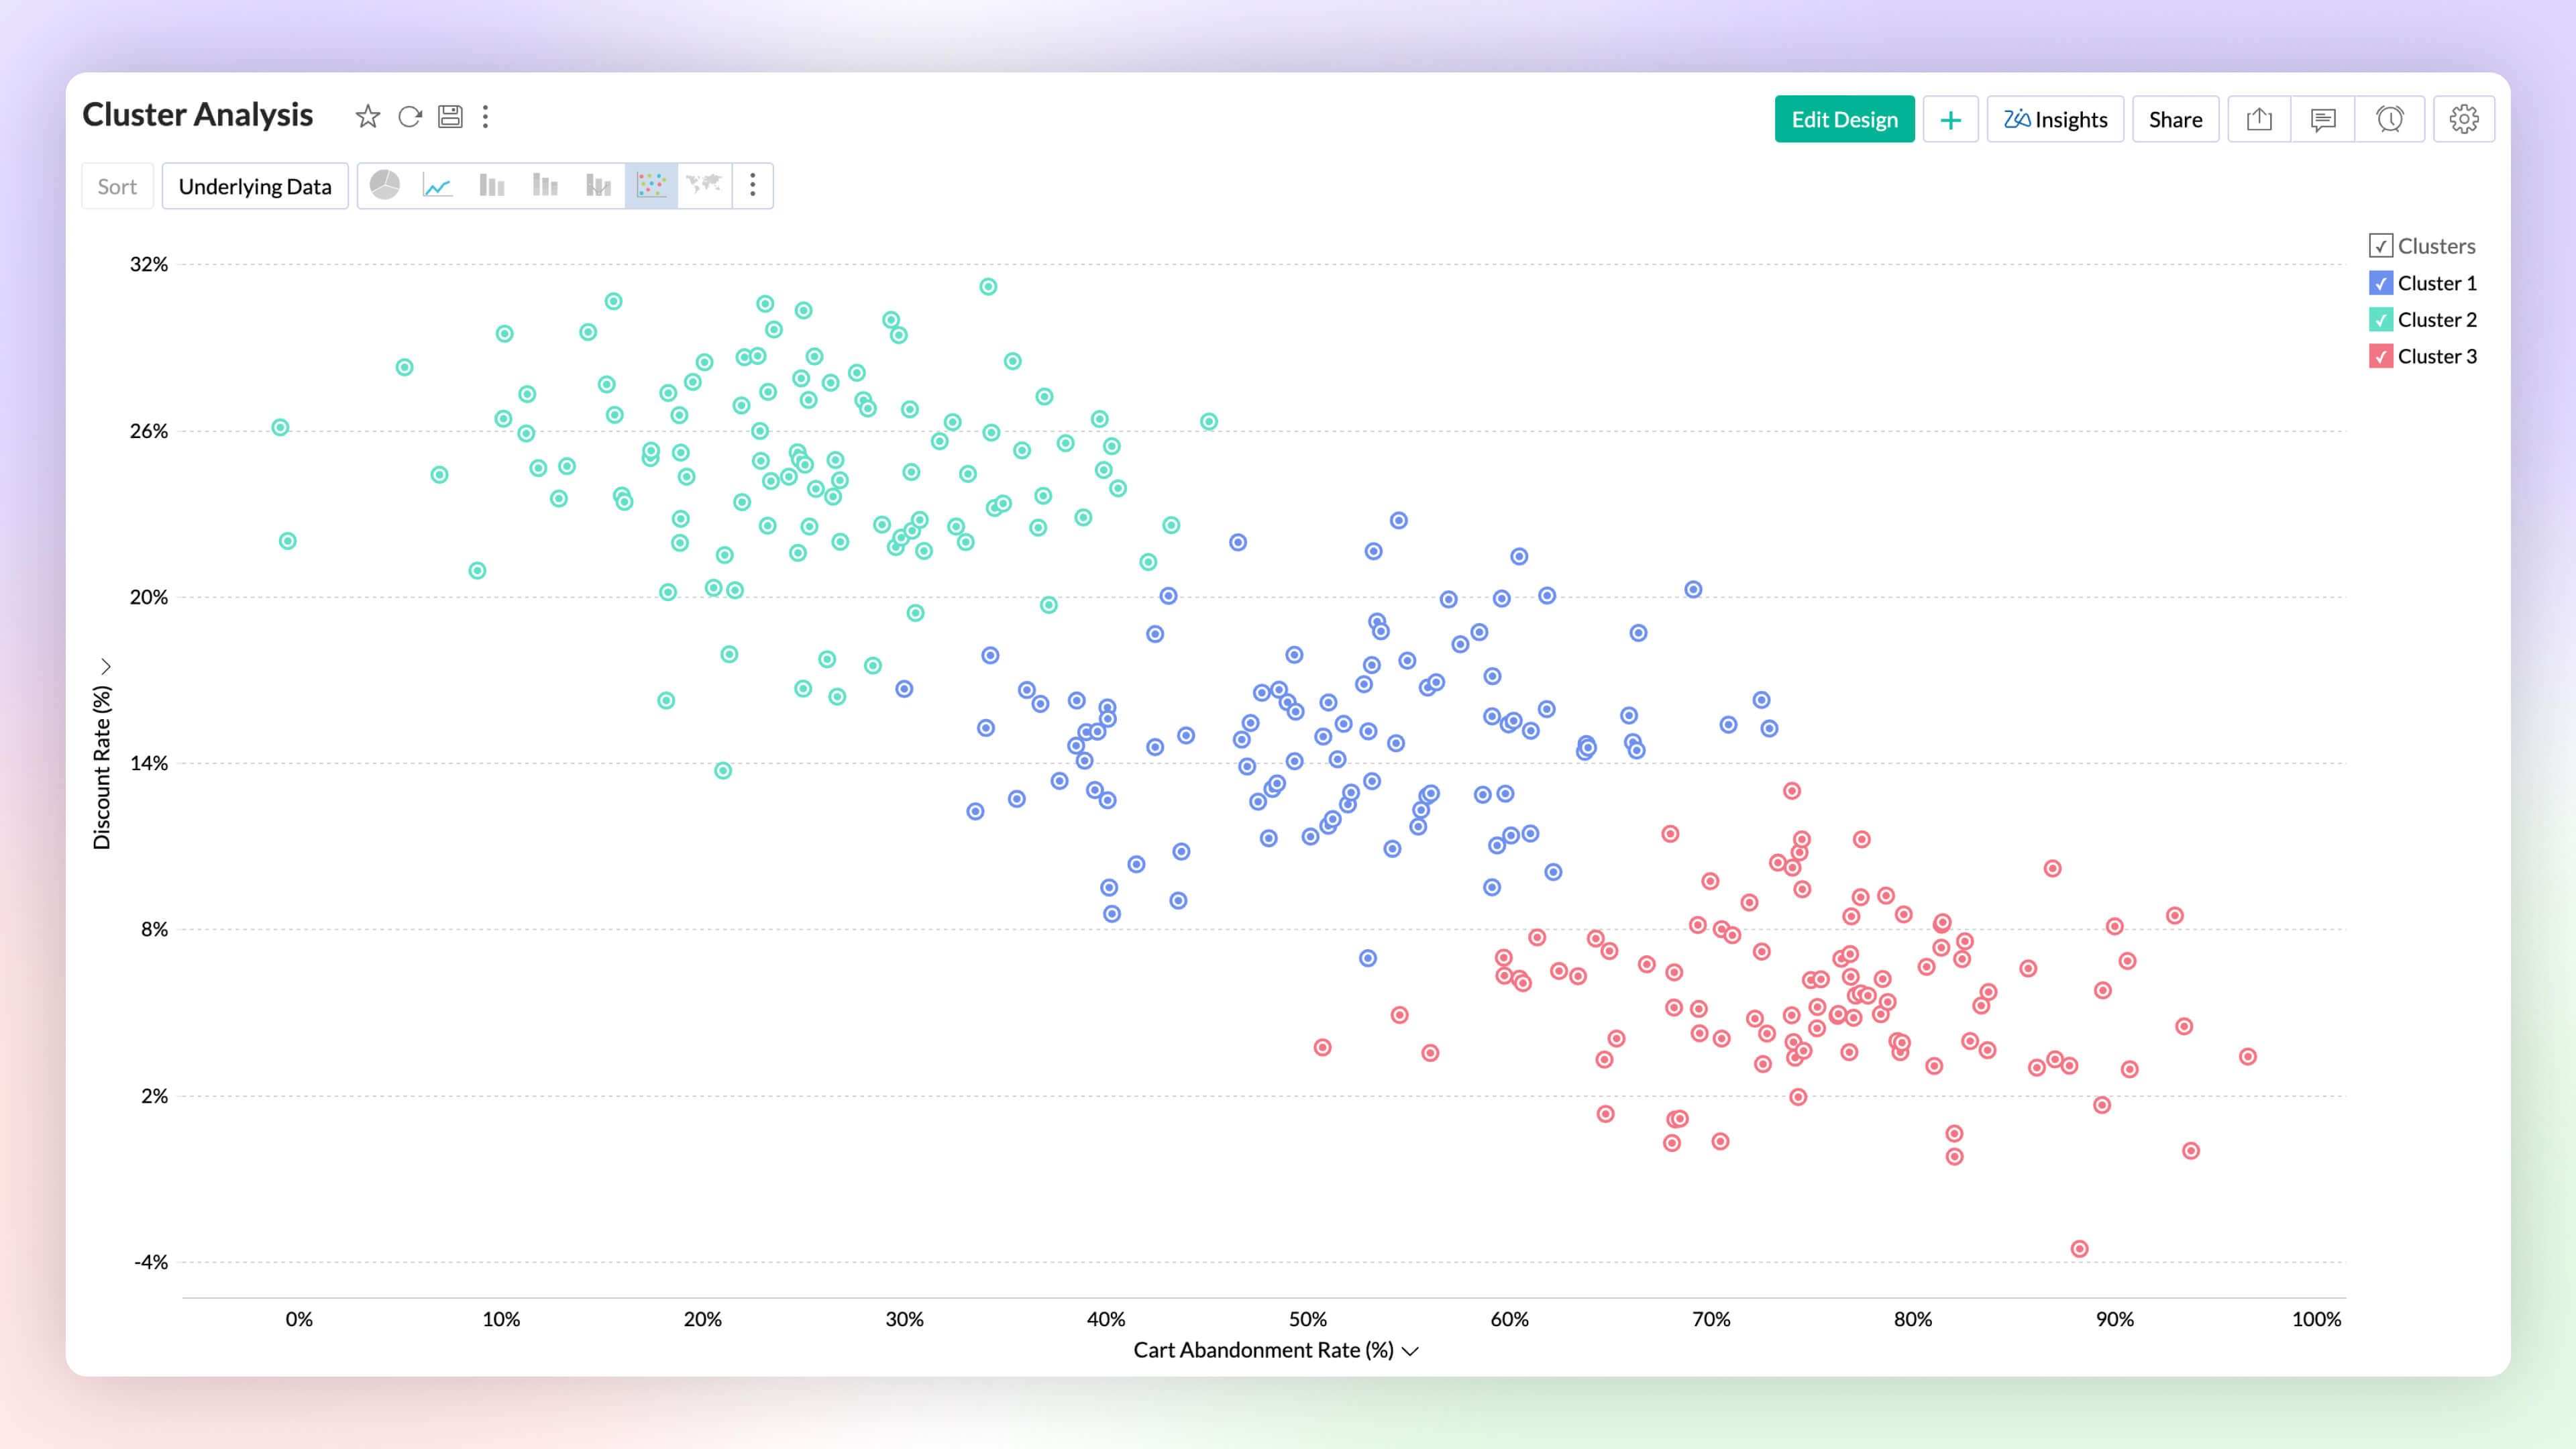
Visualize data grouped as clusters using a variety of ML models (k-mean, k-mode, and k-prototype). Intuitively segment and analyze data groups, for common patterns and affinity.
Learn more.
Data Science & Machine Learning Studio
Auto ML Enterprise Plan
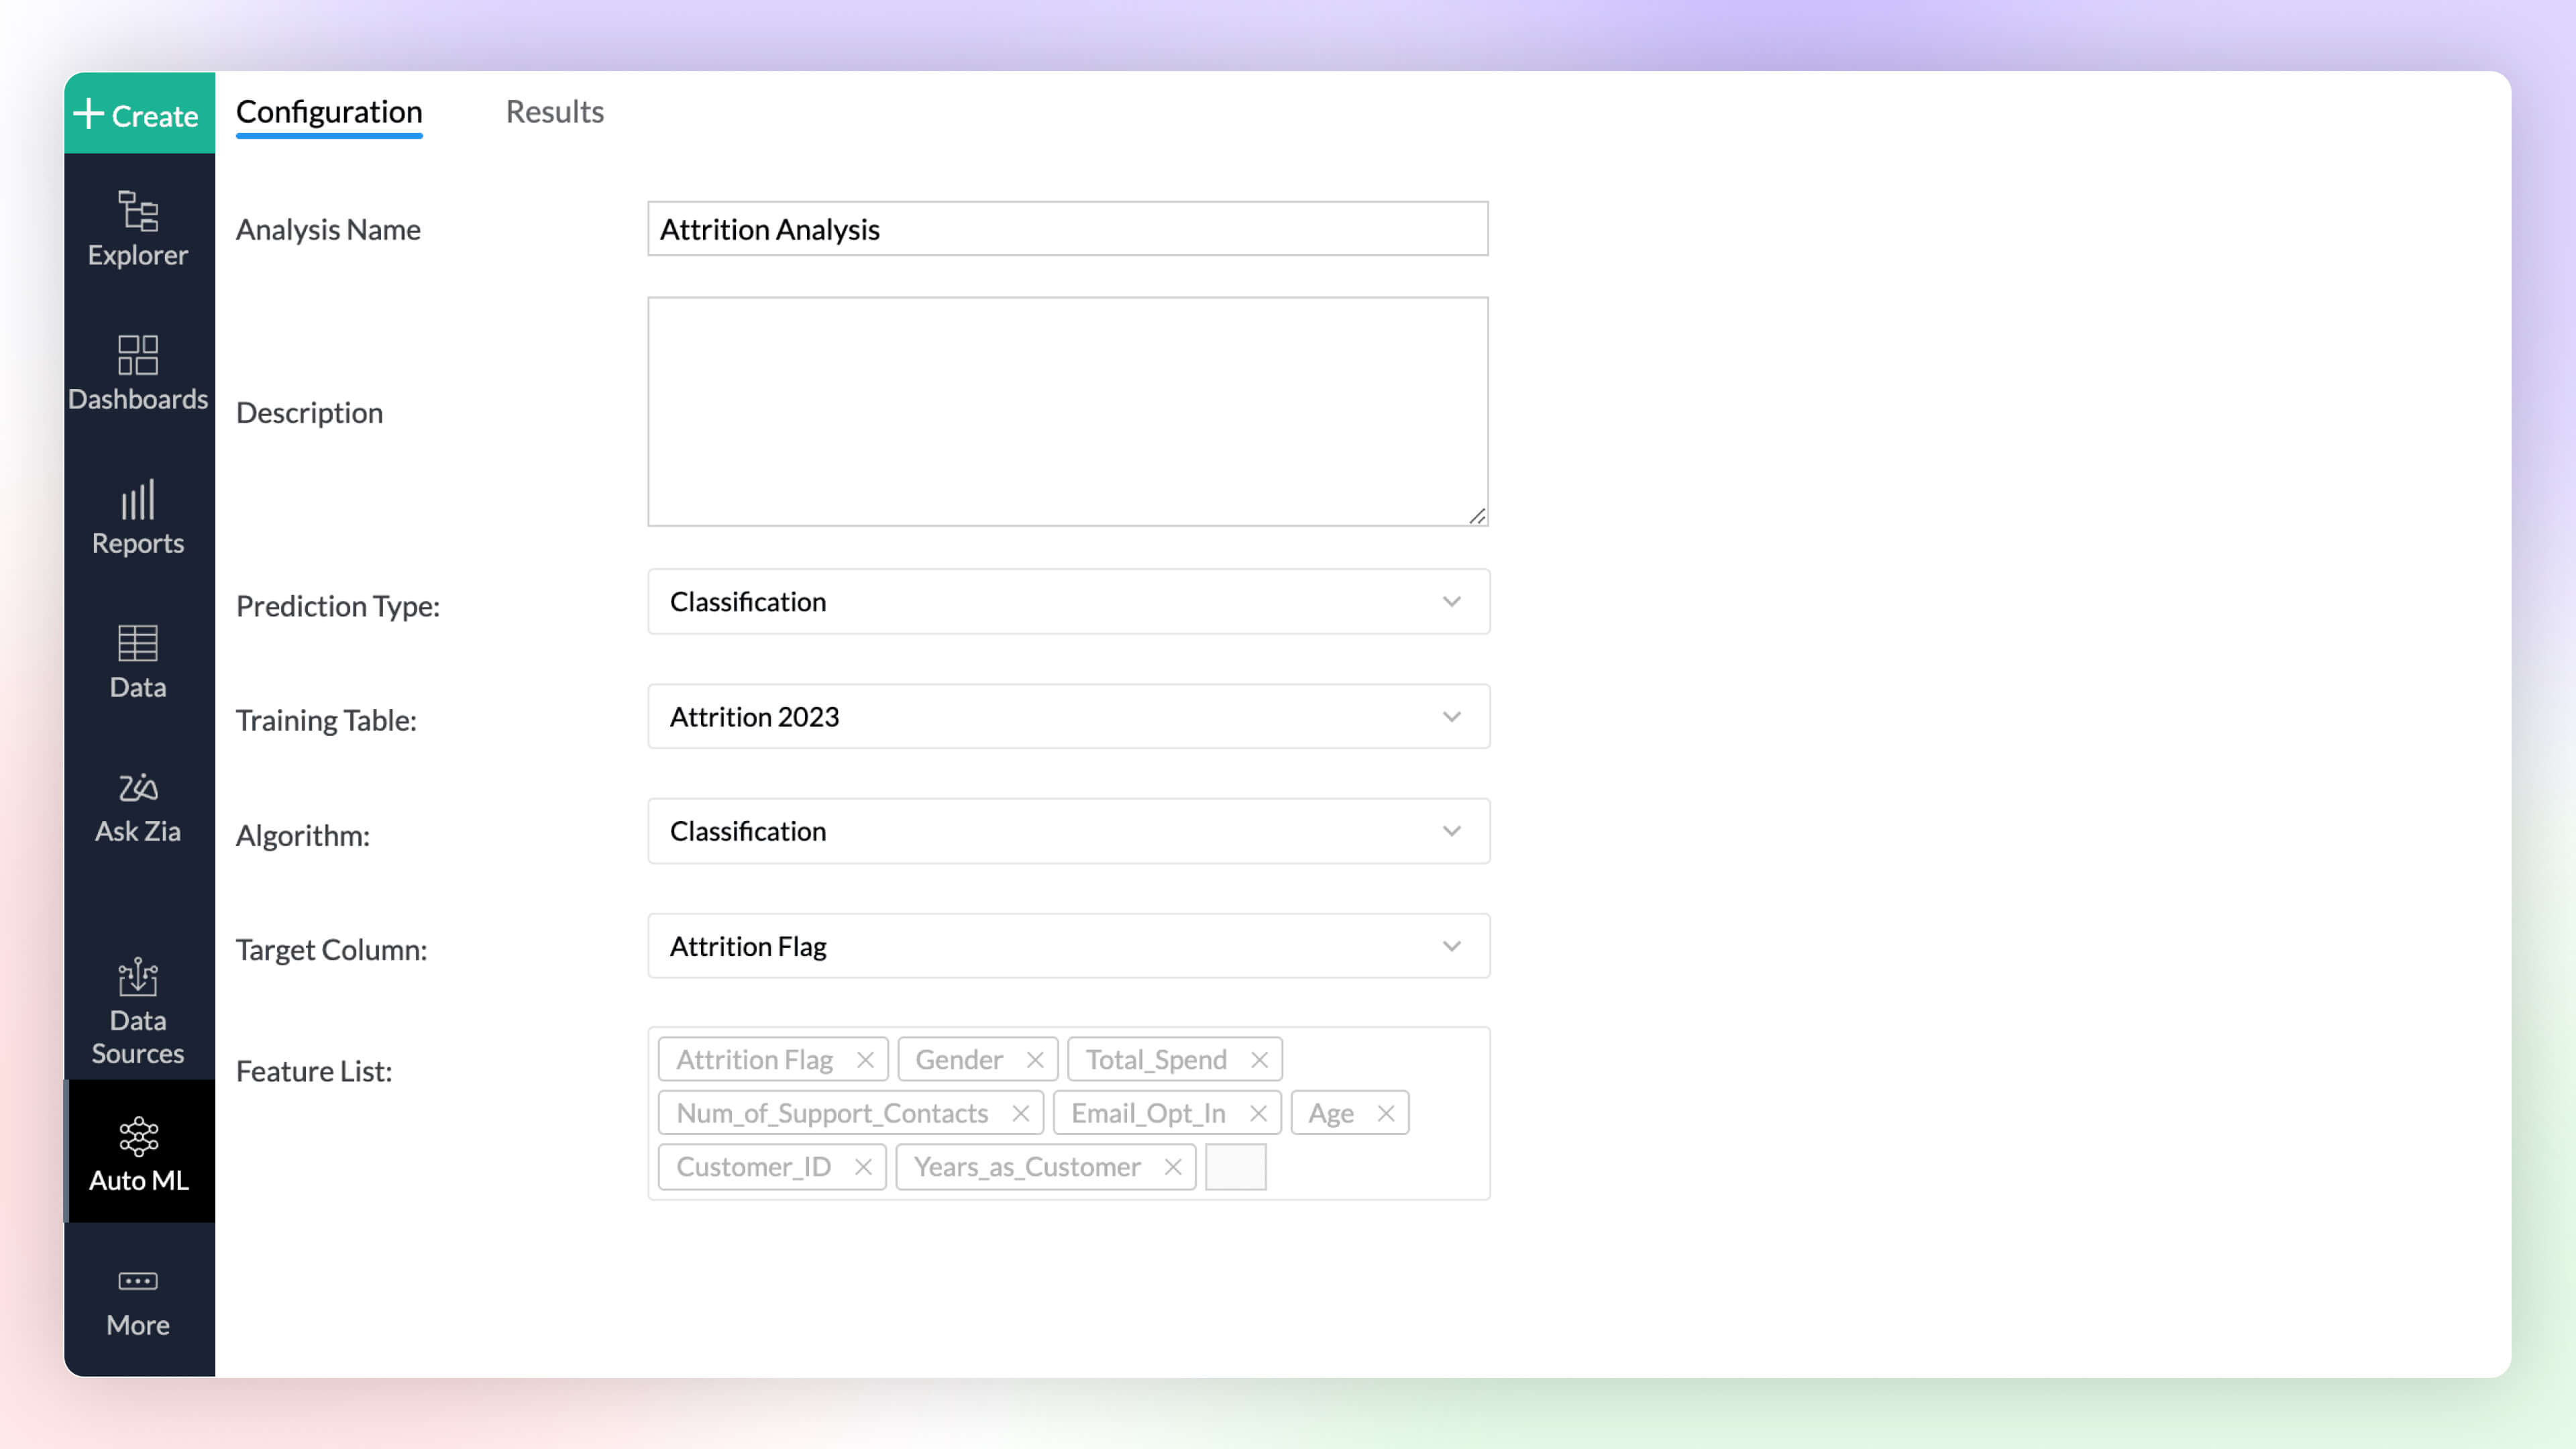
Automated machine learning provides a code-free (low-code/no-code) experience to train, verify, and build custom machine learning models with high efficiency. The simple and user-friendly design makes it possible for people with varied data-level expertise to create ML models easily for their custom needs.
Learn more.

Code Studio Enterprise Plan
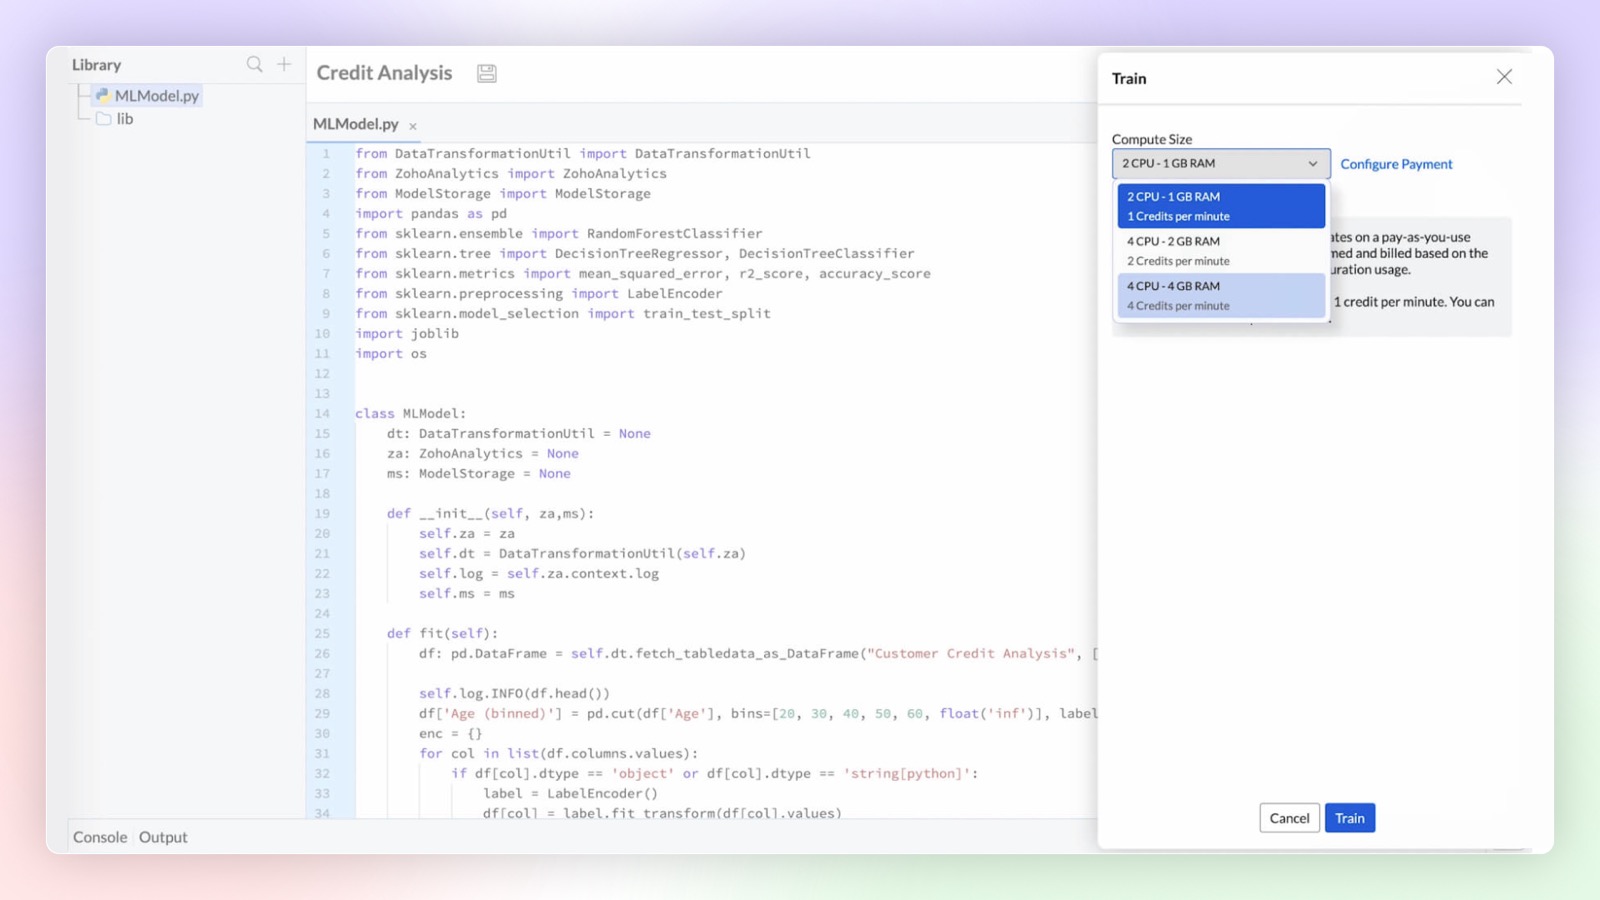
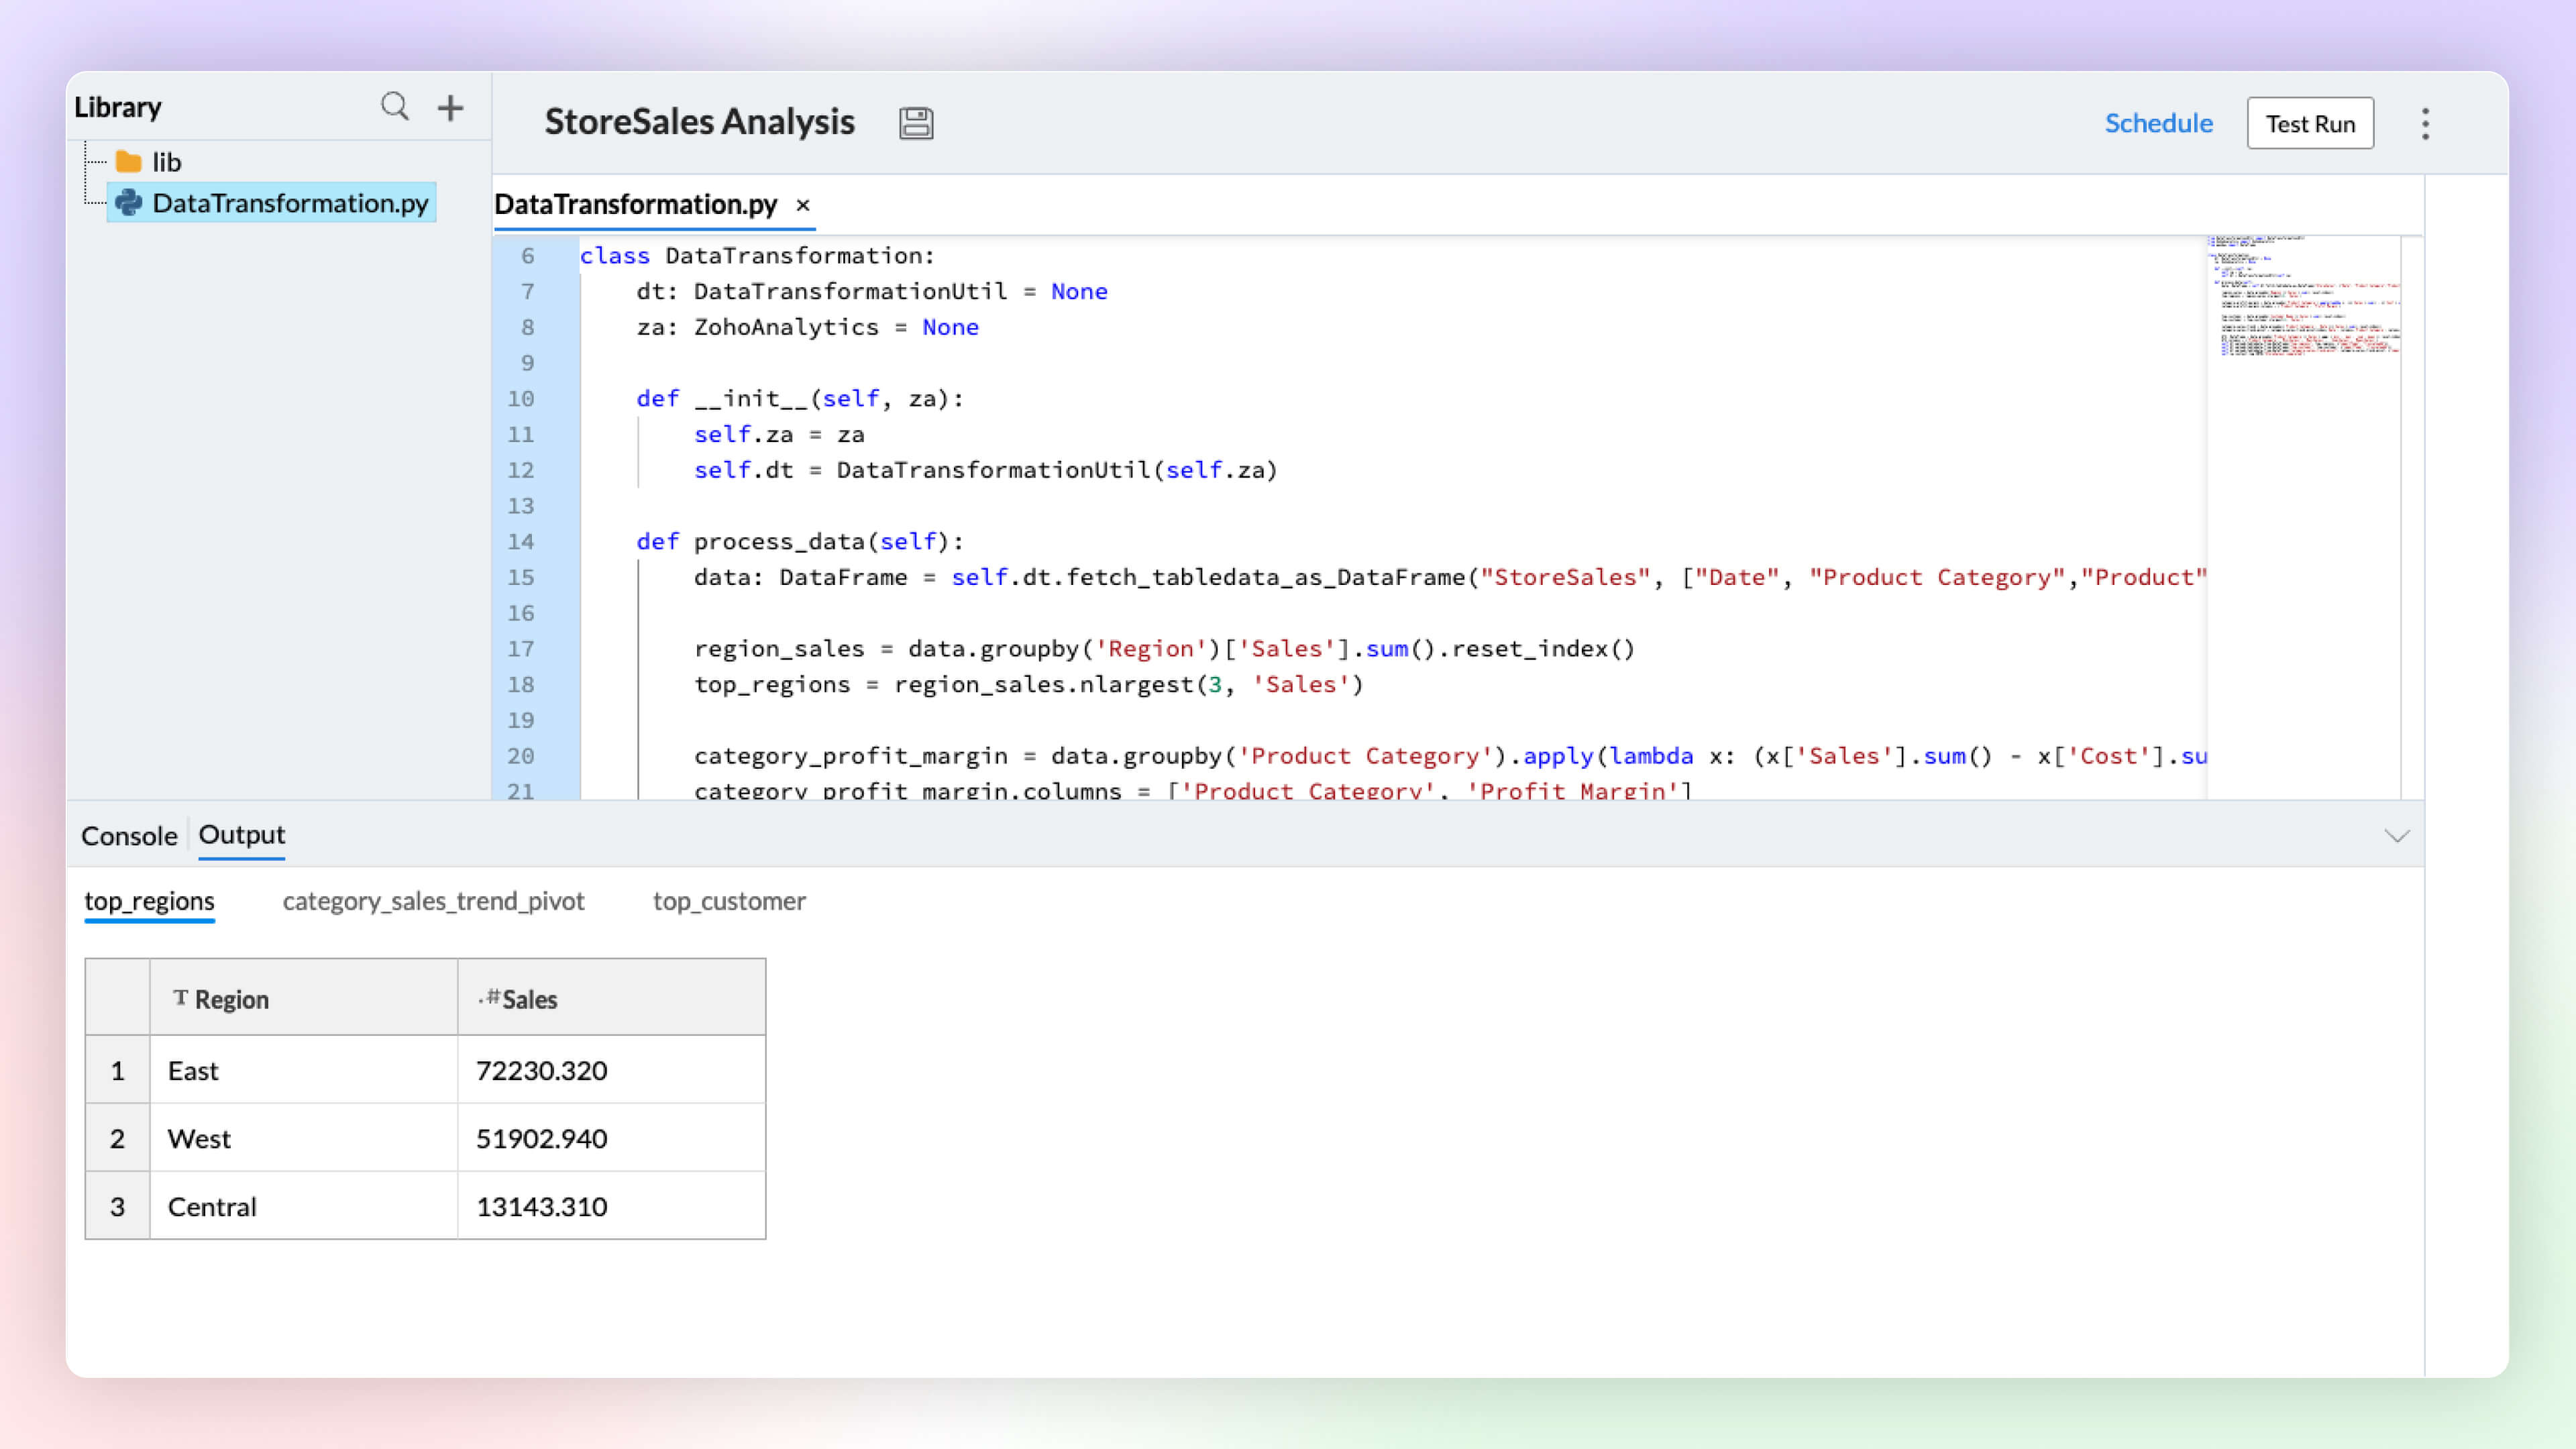
Develop custom models and data transformations using Python code studio. Build them from scratch or import them from other sources. Integrated Python development environment with Zia code suggester for accelerated development.
Learn more.
Platform Extensibility
Linked Workspaces
Linked Workspaces in Zoho Analytics establishes a connection between two distinct workspaces, allowing them to push views from one workspace to another. In this connection, one acts as a primary workspace and the other acts as a child workspace. The views from a primary workspace can be easily pushed to multiple child workspaces with just a click.
Custom Connector Premium Plan
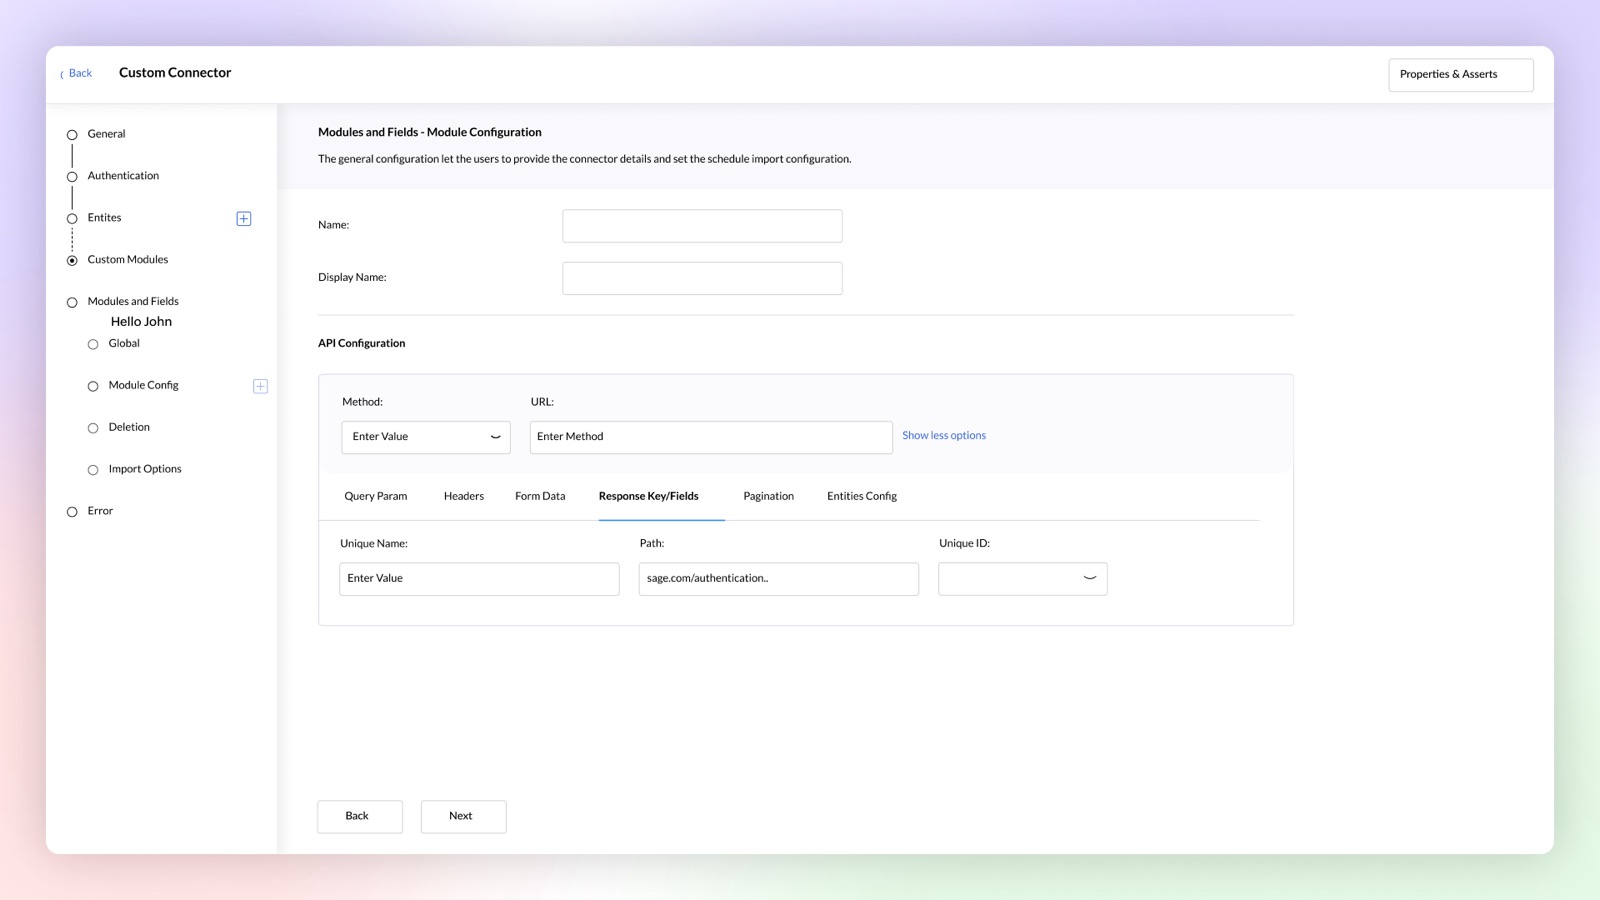
Build your own data connector for any application using a no-code connector builder. Publish and sell your custom connectors on Zoho Marketplace, if required.
Zoho Flow in Alerts Premium Plan
You can now use Zoho Flow to perform actions in other applications whenever an alert is triggered in Zoho Analytics using Zoho Flow. For example, a ticket can be created in Zendesk based on the alert triggered in Zoho Analytics.

Client SDK for JS API
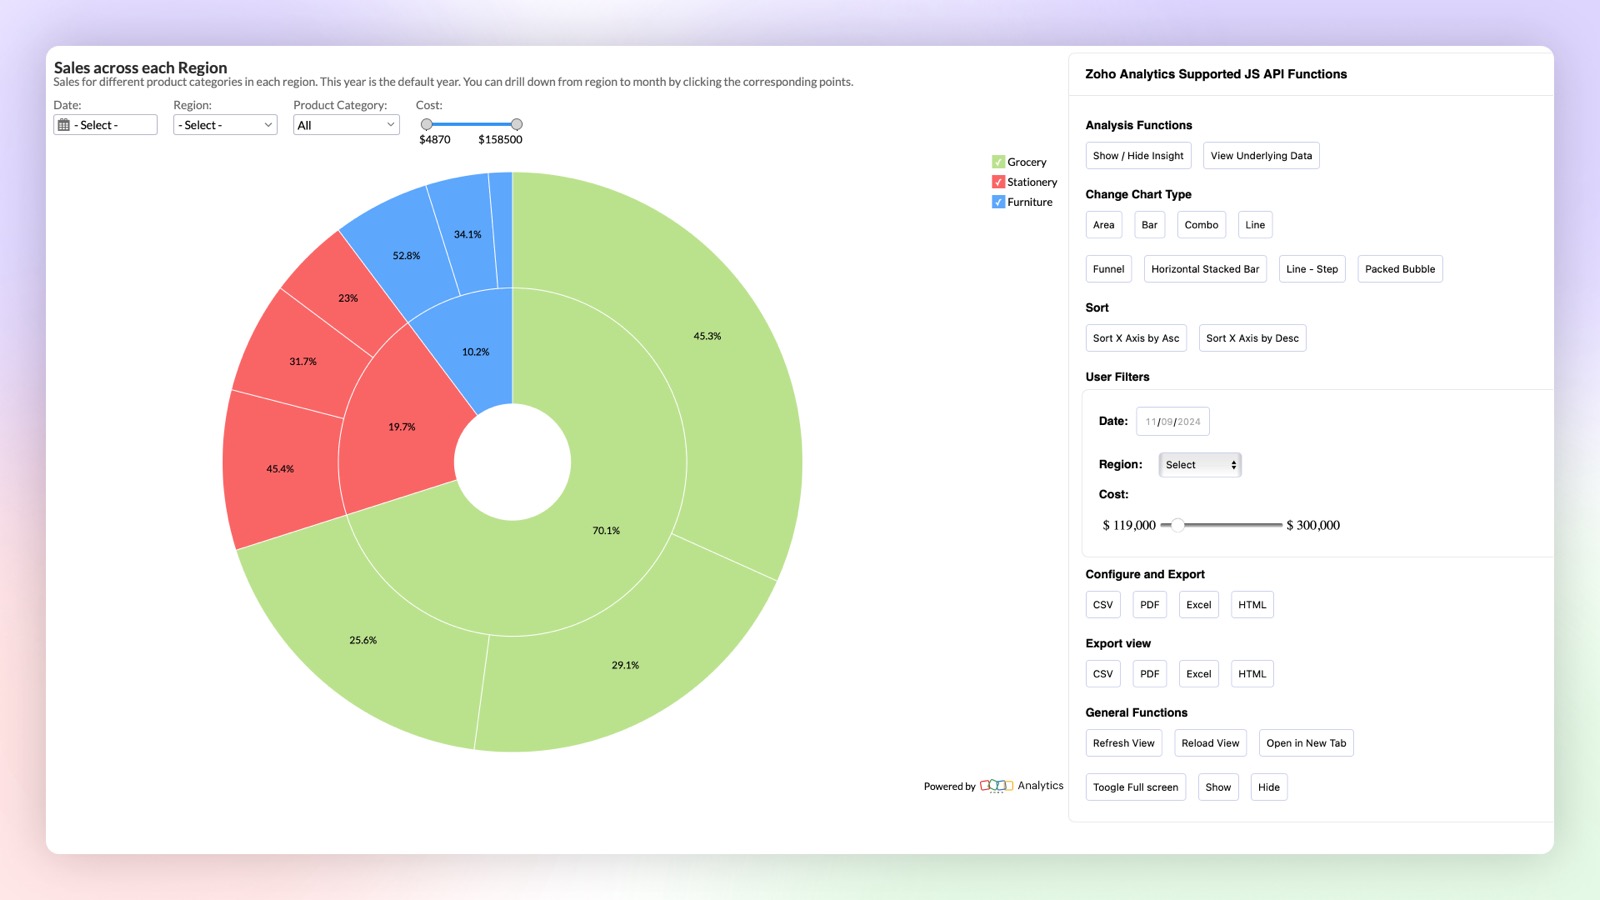
New Javascript based Client SDK to extend & customize the user experience of reports within embedded applications. You can control interactions like sort, export, user filters, change chart type and other actions with the JS API.
BI Fabric
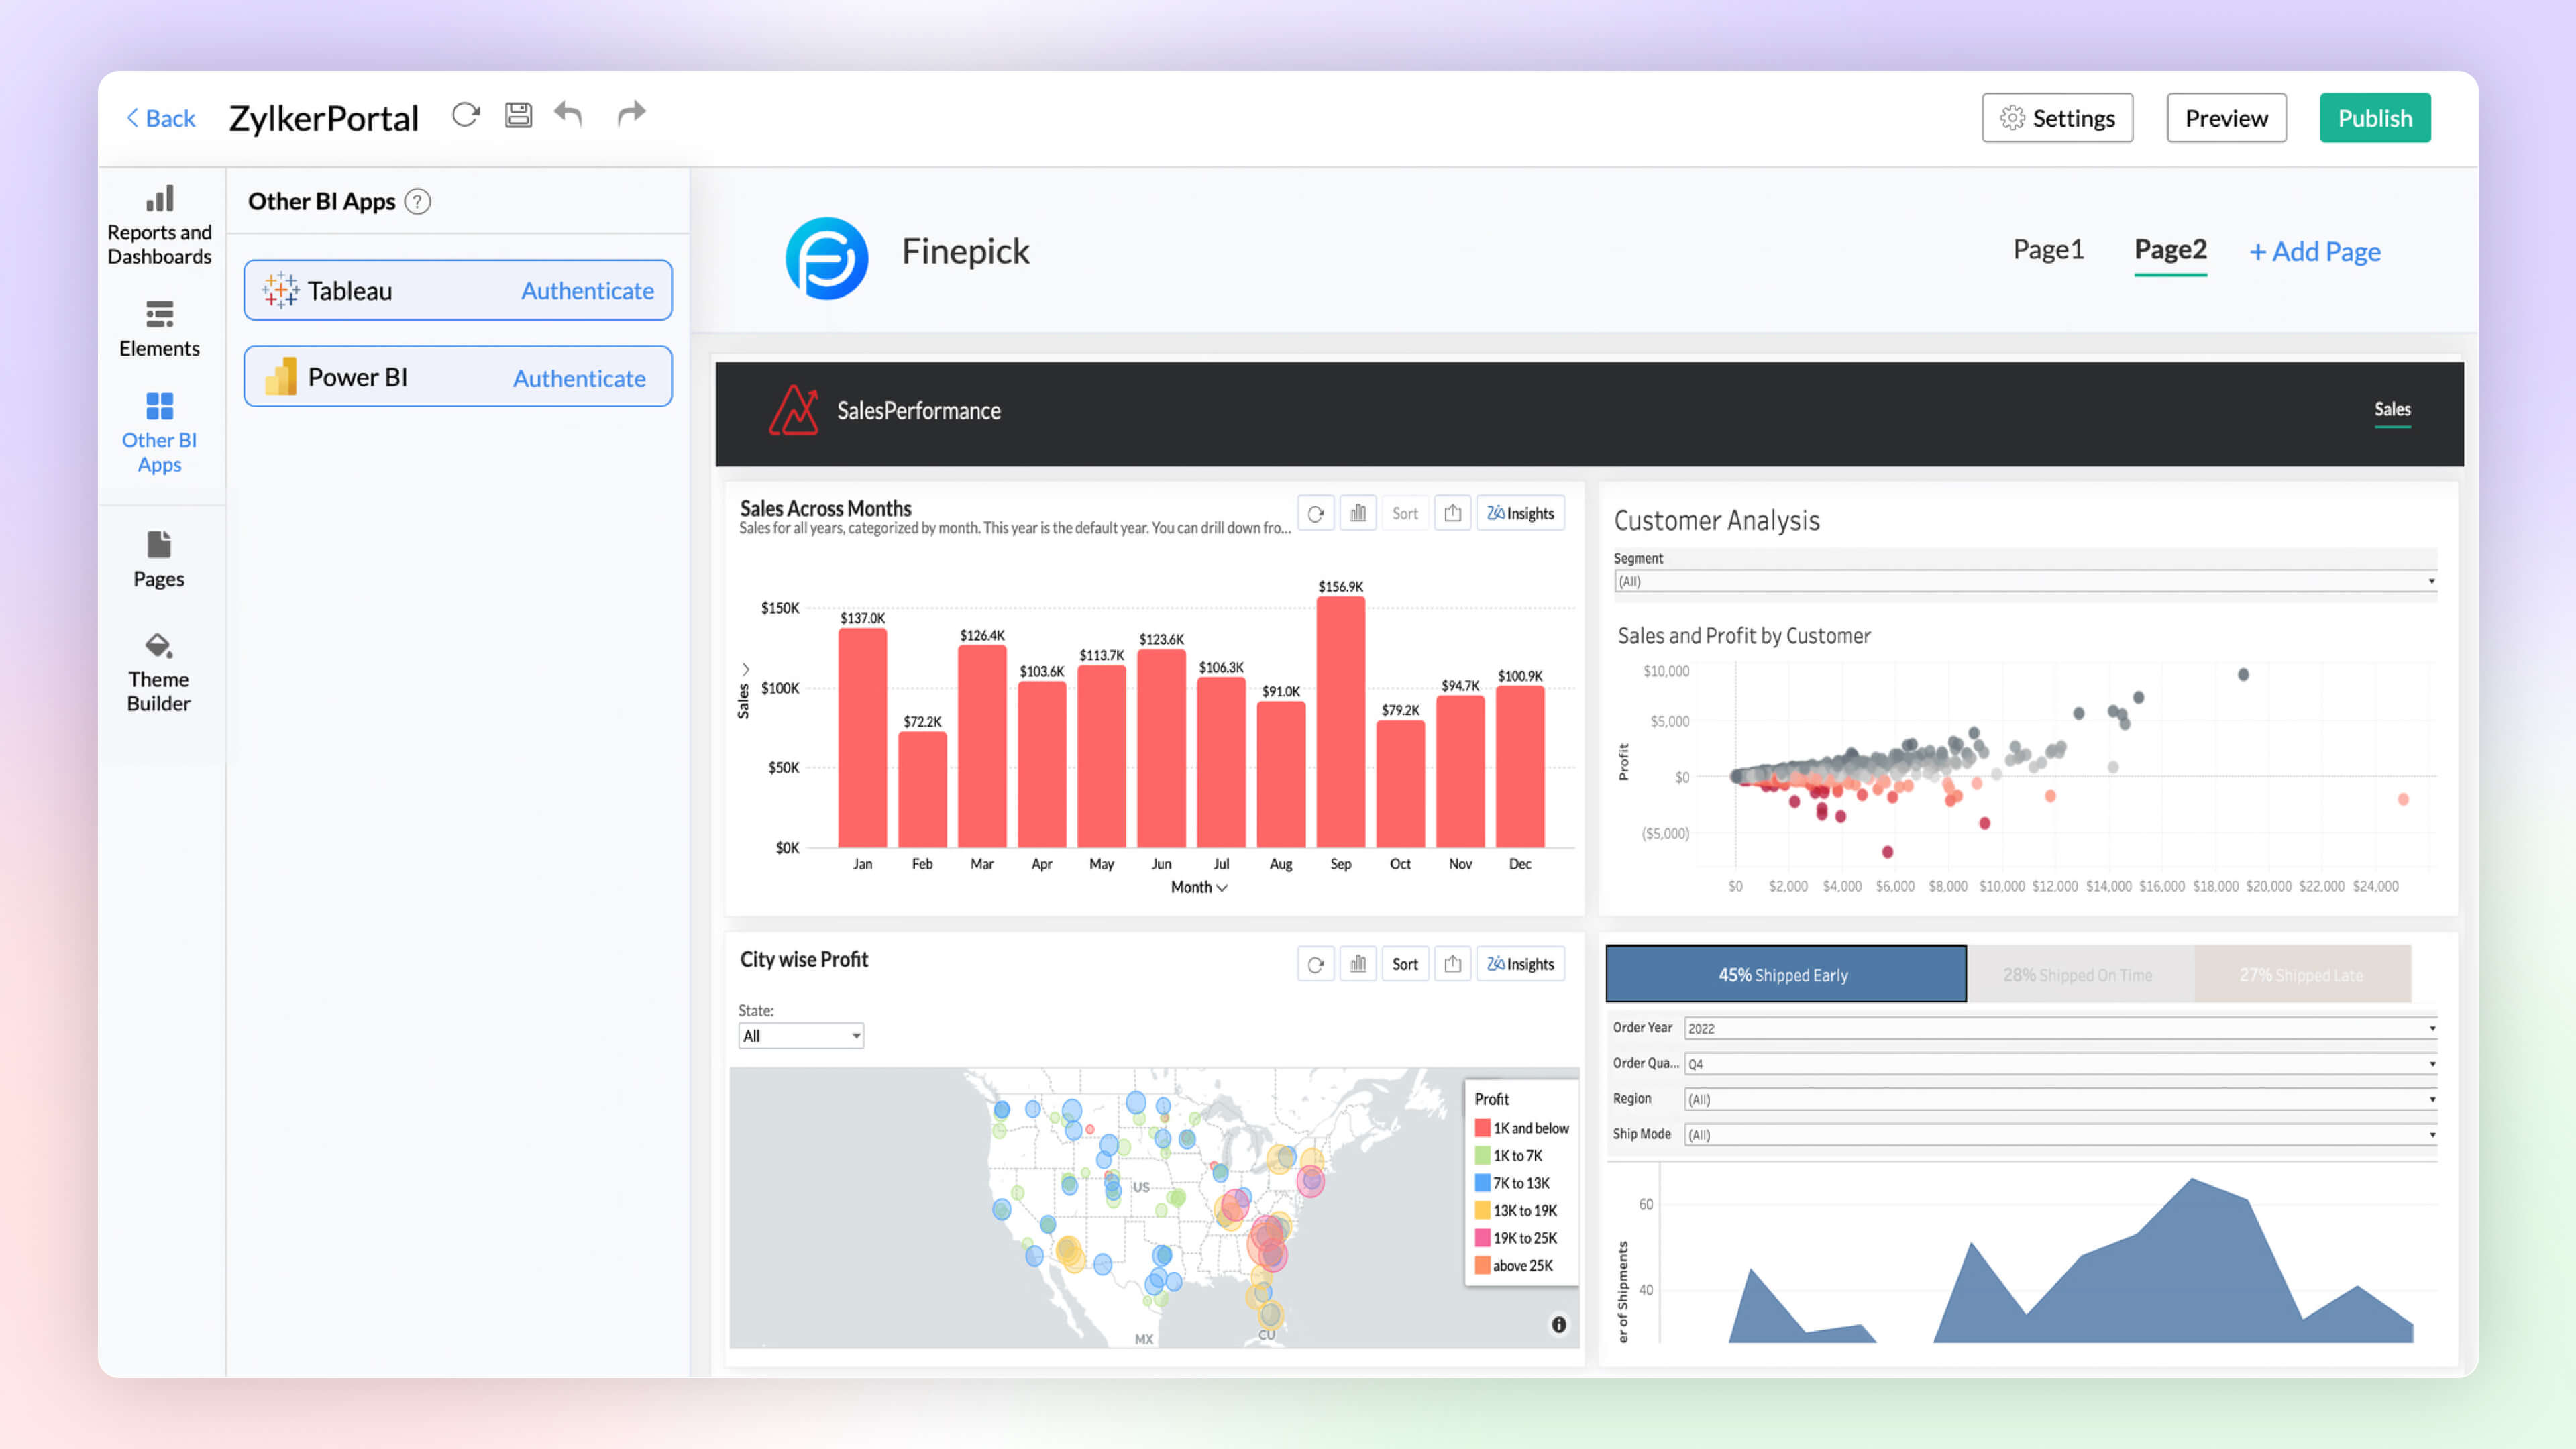
Create unified BI portals by collating insights from other BI applications such as Tableau and Power BI along with Zoho Analytics. Setup fine-grained access control on the portal for secure access. Unified BI Fabric portal helps in easy access to insights from a centralized portal, breaking the boundaries across BI services.
Learn more.
Security Enhancements
Zoho Directory
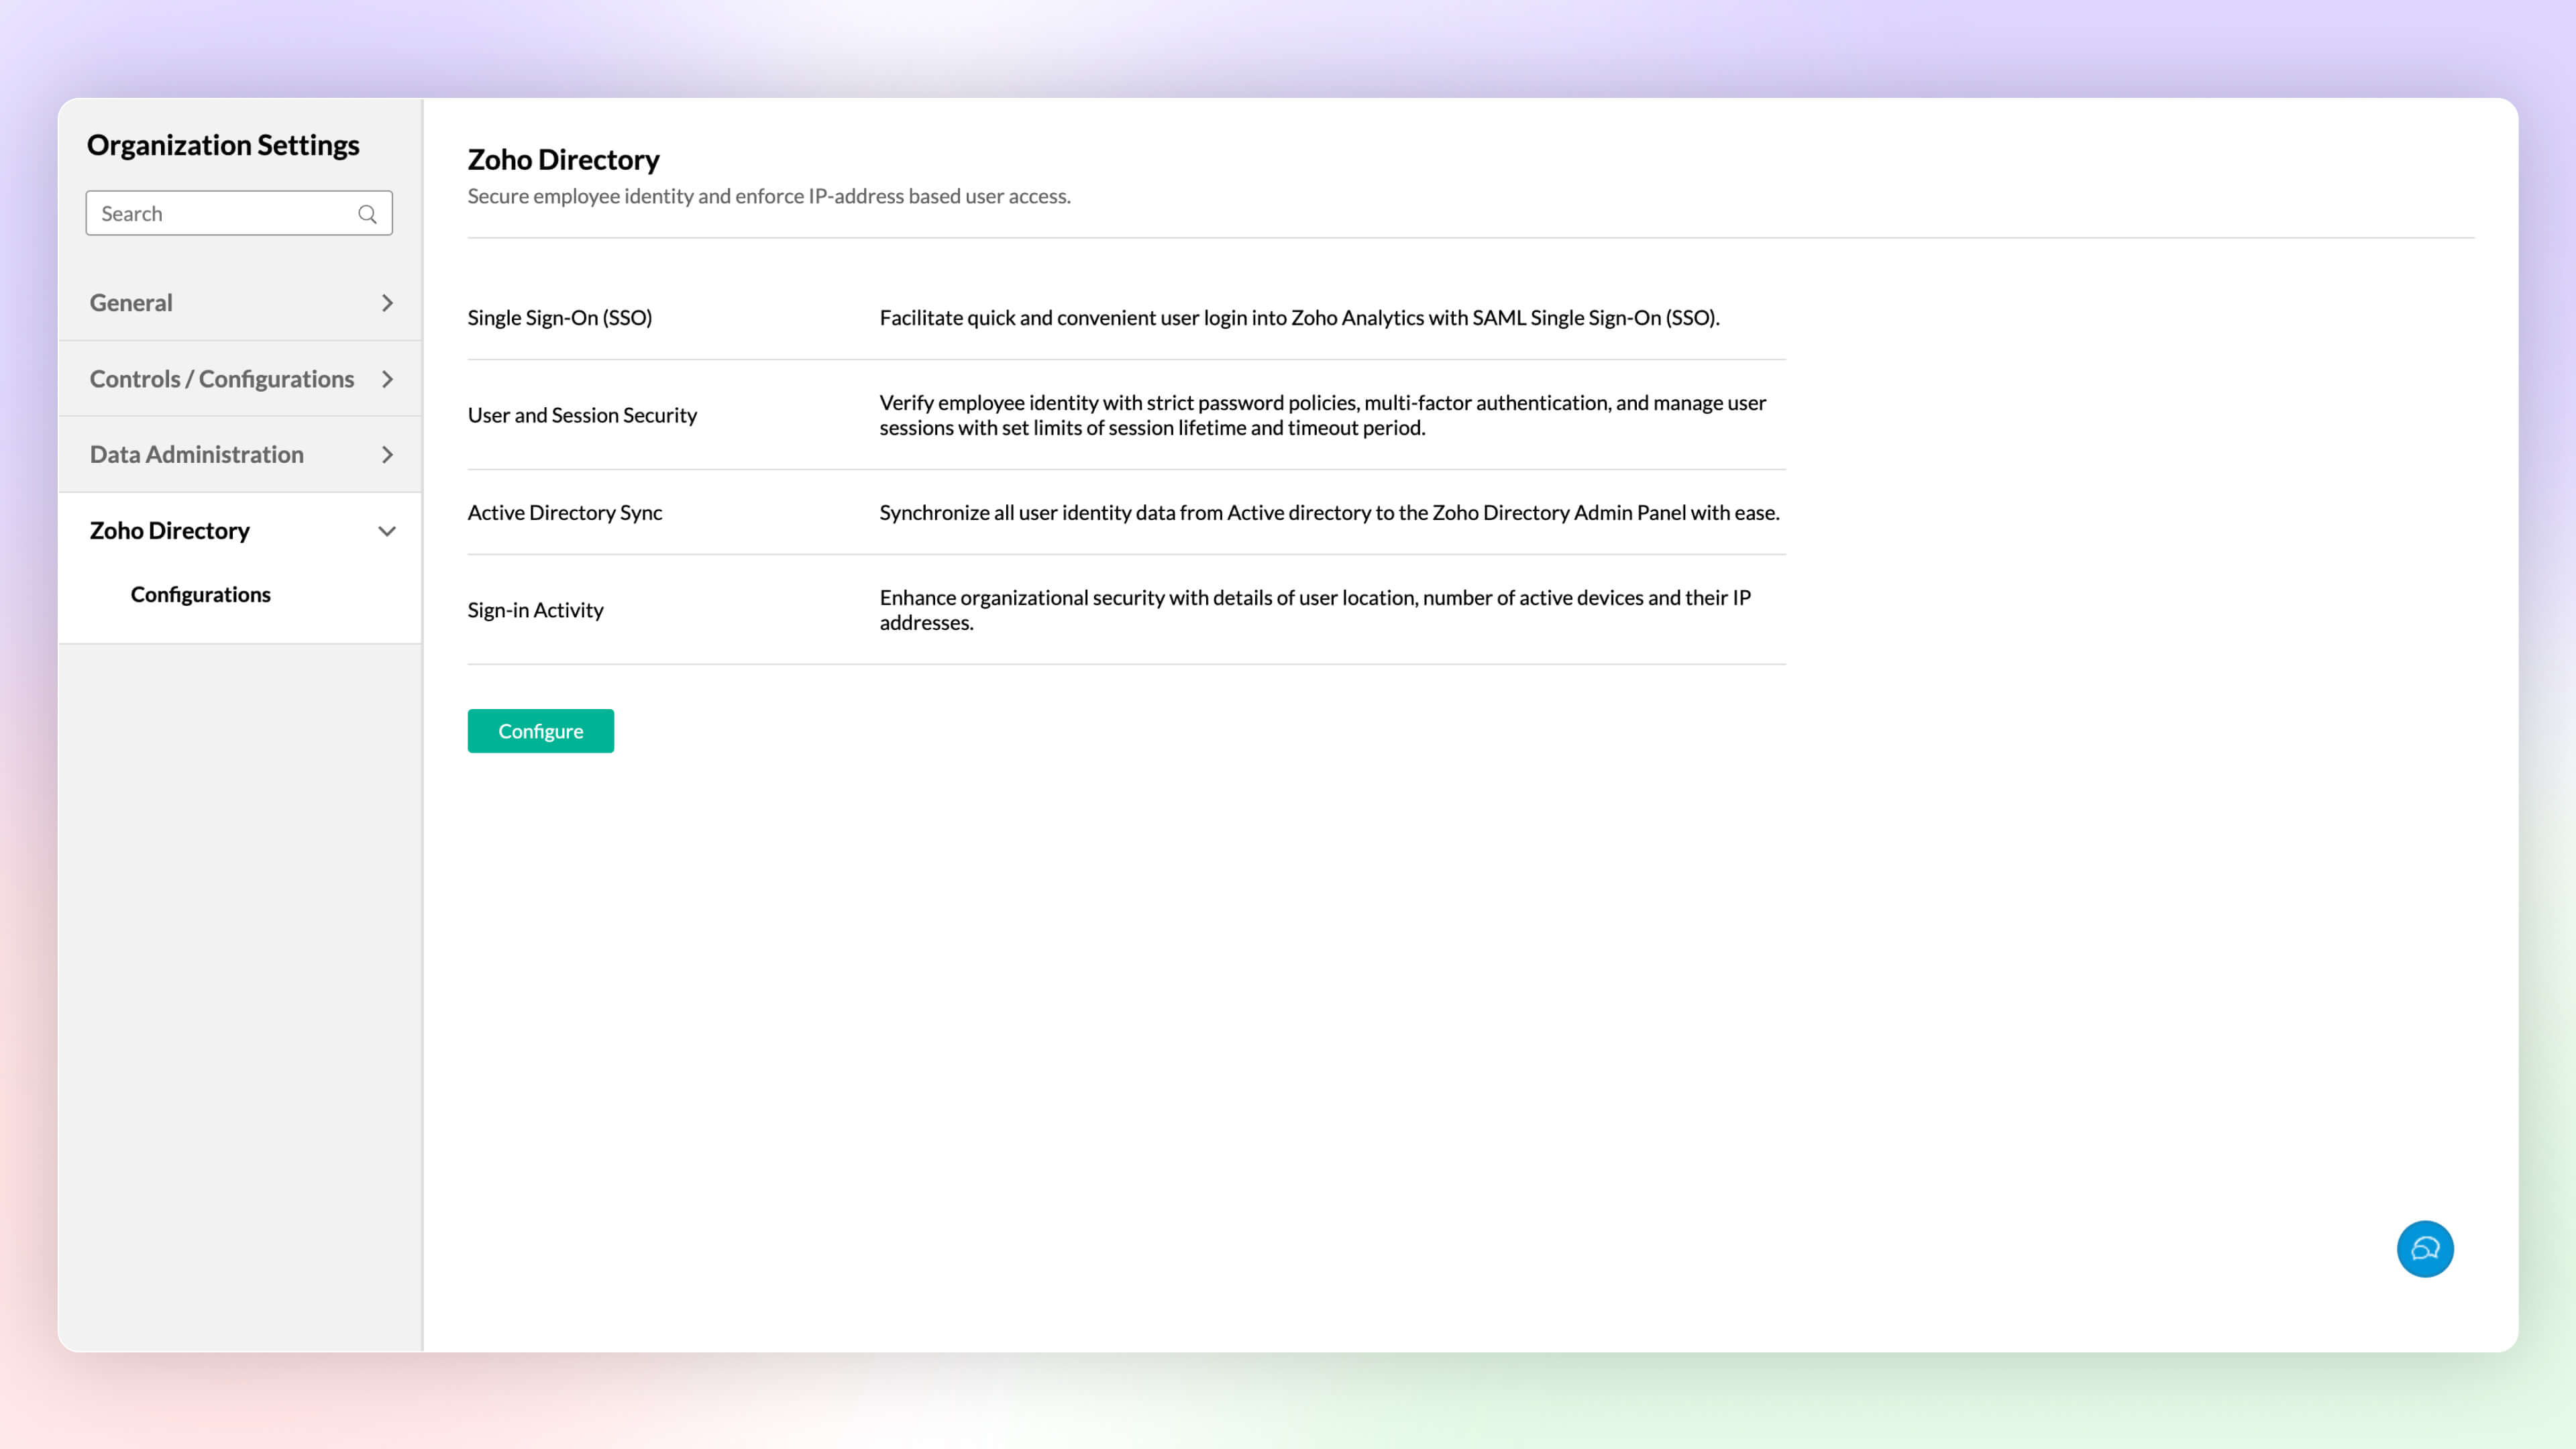
Zoho Analytics integration with Zoho Directory allows administrators to setup single sign-on, Active Directory sync, handle user access management and more.
Learn more.
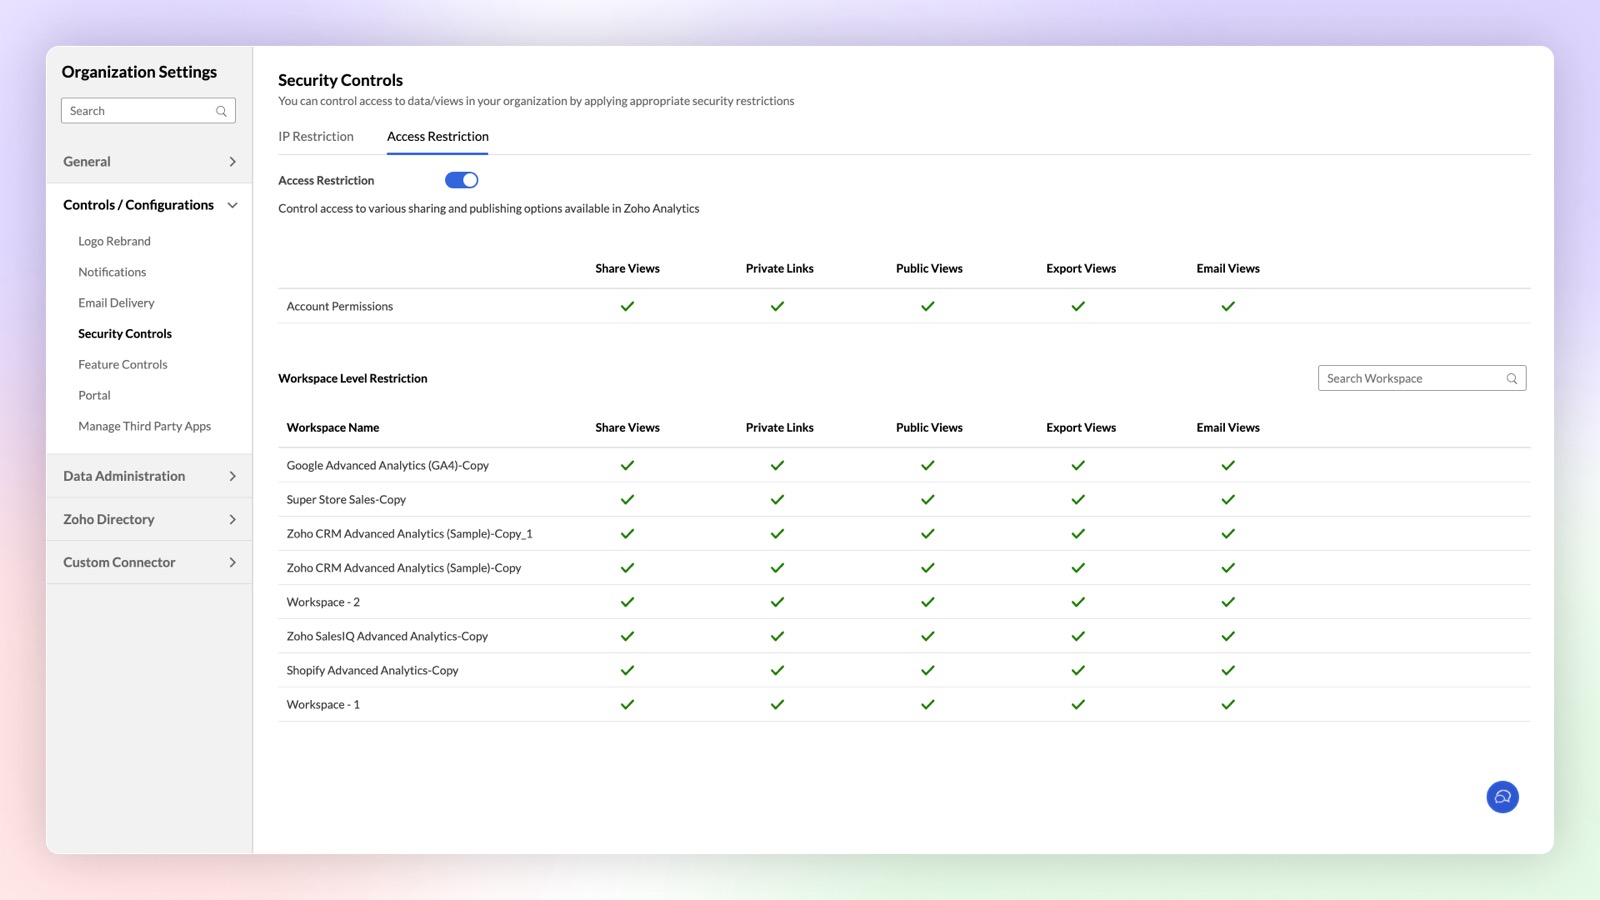
Access Restriction
Zoho Analytics now offers enhanced security controls to setup fine-grained access restrictions at the workspace level. Apart from the organization level access restriction controls, this new update allows you to setup different restrictions for different workspaces.
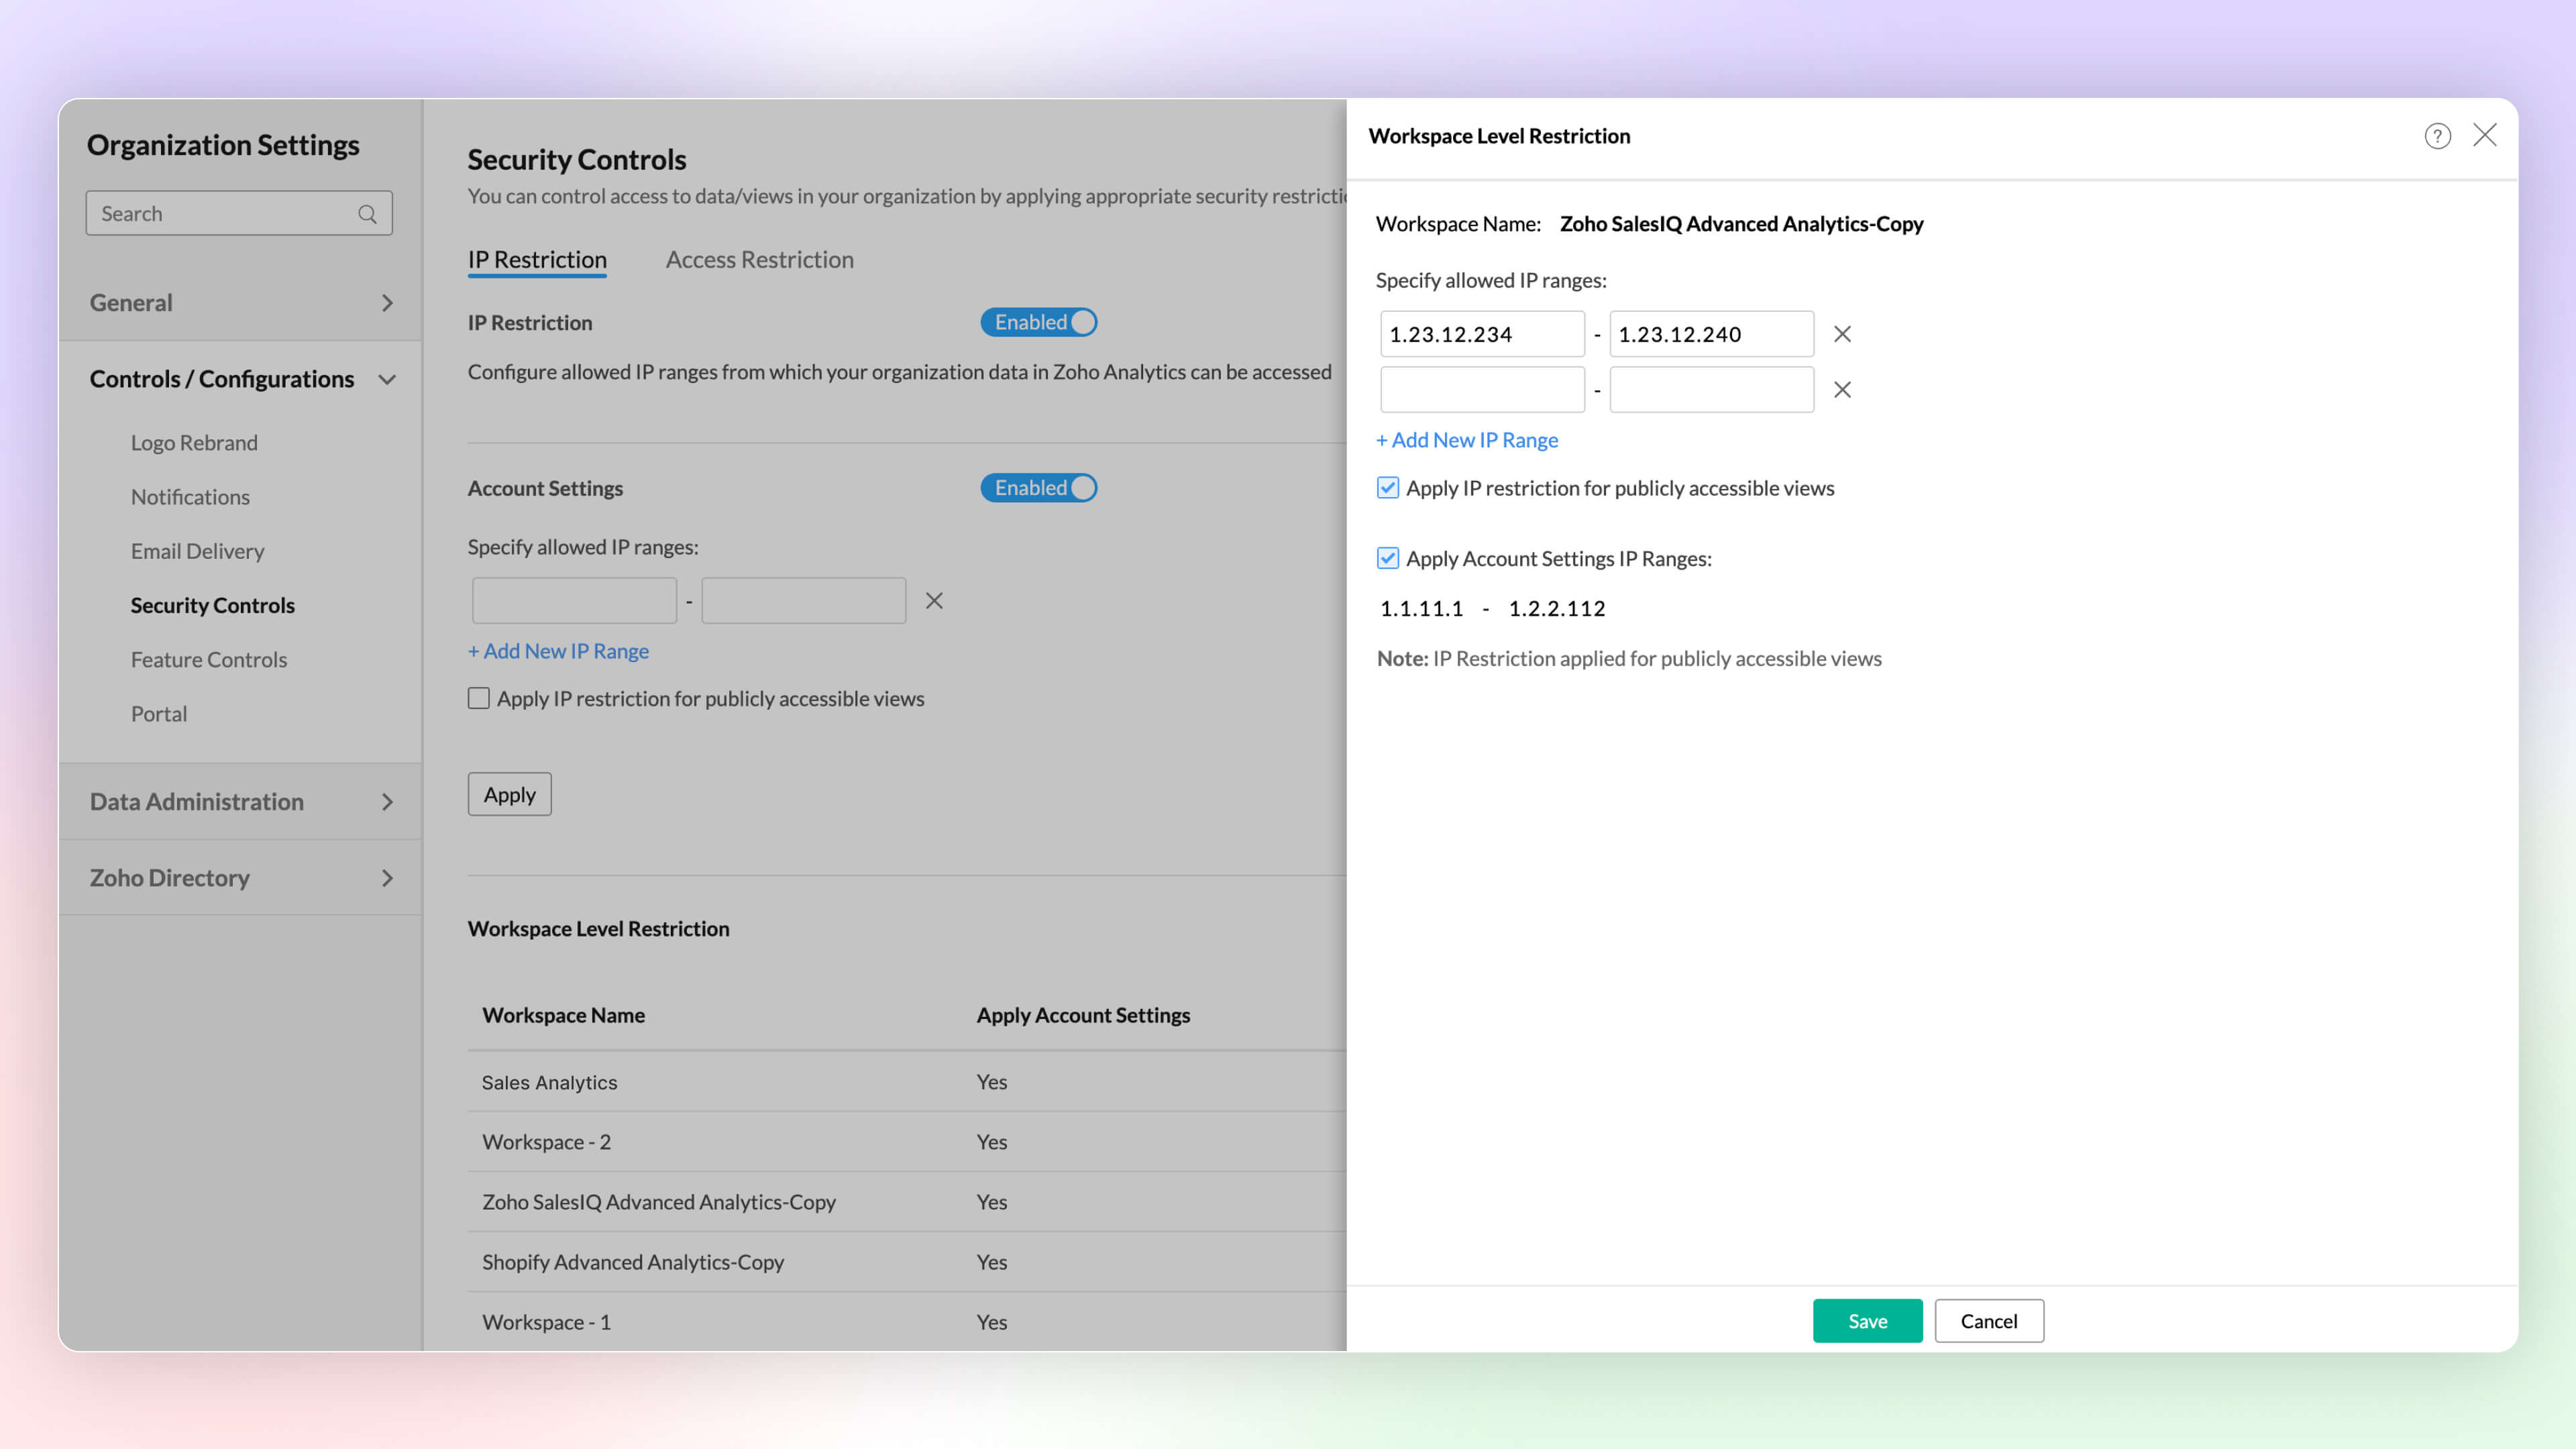
IP Restriction
Configure workspace-level IP restrictions for enhanced security and prevent unauthorized access. Previously, IP restrictions were available only at the account level.
Learn more.
Other Updates
UI Enhancements
New Intuitive and User-friendly Interface
Zoho Analytics' new user experience features glass-morphism, offering a modern, translucent design that improves visual clarity. This sleek update makes data visualization more intuitive and user-friendly.
Right to Left User Interface
Zoho Analytics now supports a right to left user interface. This option is best suited for languages like Arabic and Hebrew that are read from right to left.
Puvi Font Support
Zoho Analytics now supports Zoho's own font, Puvi. You can try this new font from the Profile tab.
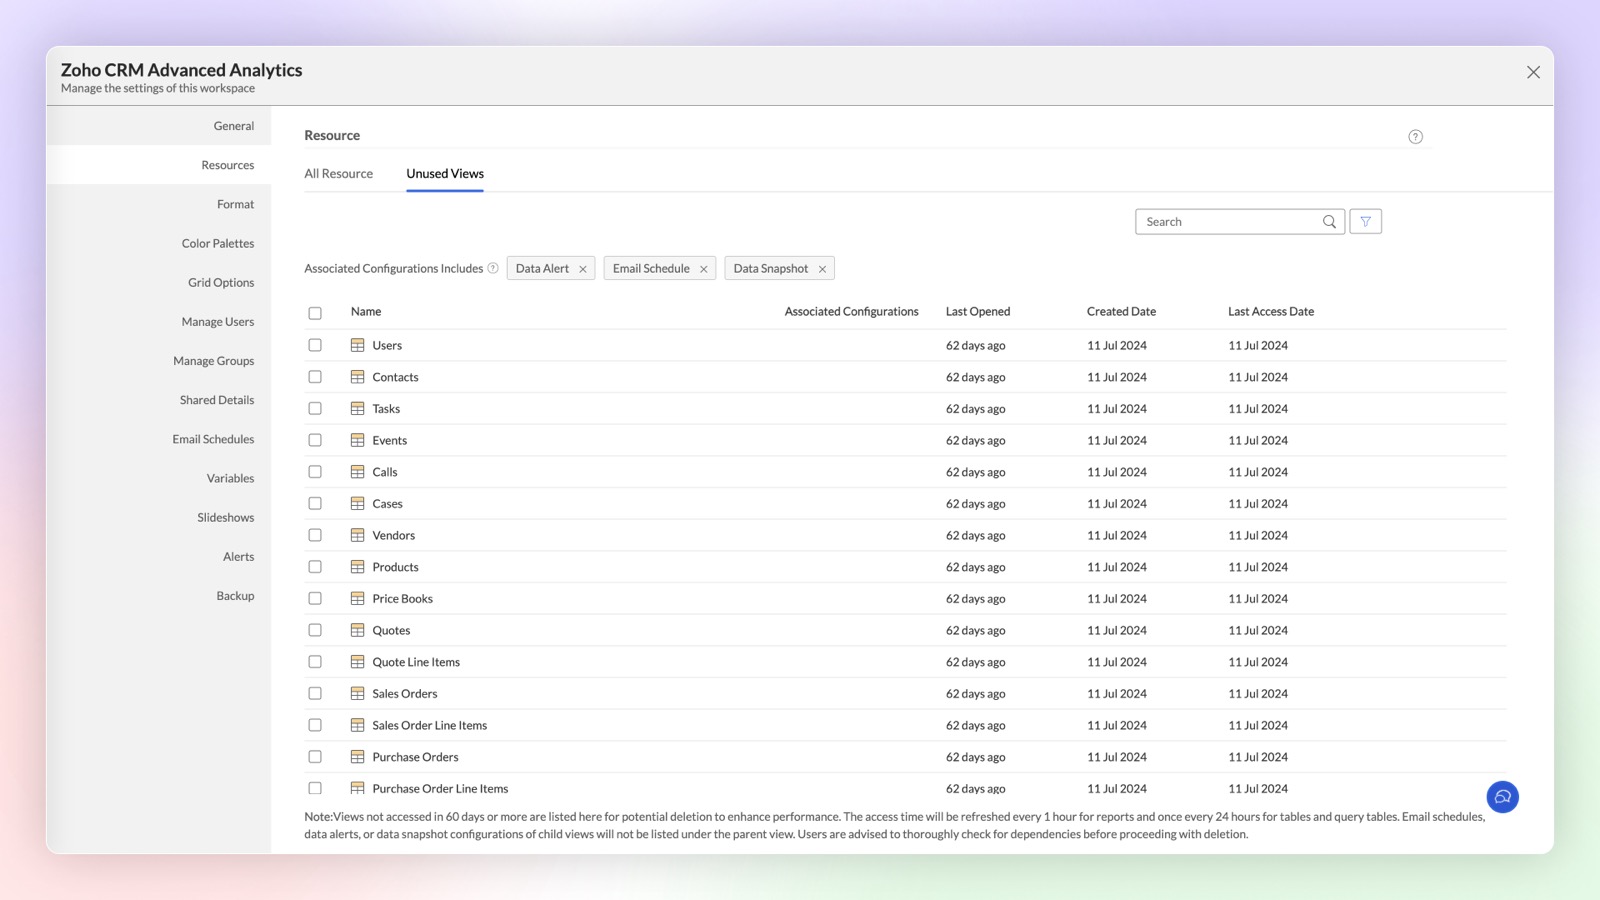
Unused Views in Workspace
Views and tables created in Zoho Analytics may sometimes go unused for extended periods due to reduced relevance. These inactive views and tables are now categorized under the "Unused Views" section at the workspace level, helping you decide whether to maintain or remove them.
Share to Slack
Improve collaboration and improve productivity by integrating Slack and Zoho Analytics.You can now easily share tables, reports, and dashboards to Slack users by this integration.
Learn more.
Aug
06 August, 2024
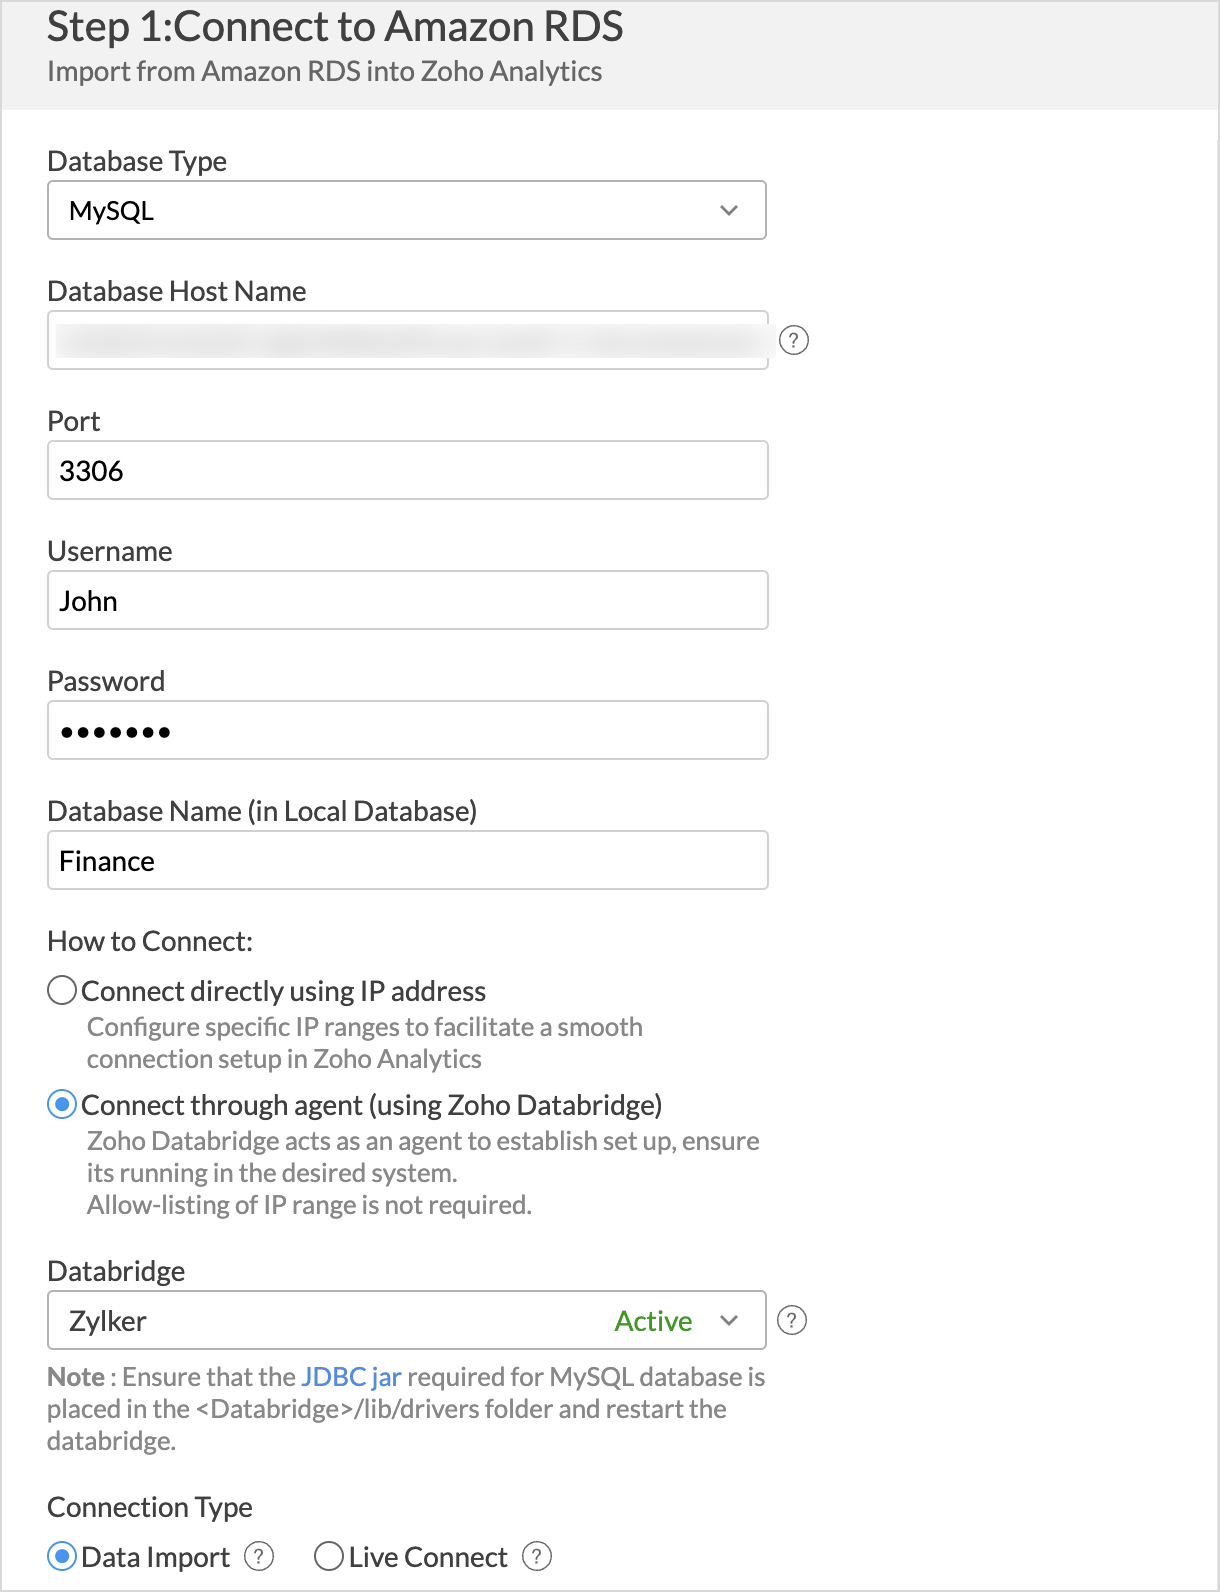
Connect to the data hosted in the cloud without allow-listing the IP addresses
Learn more.
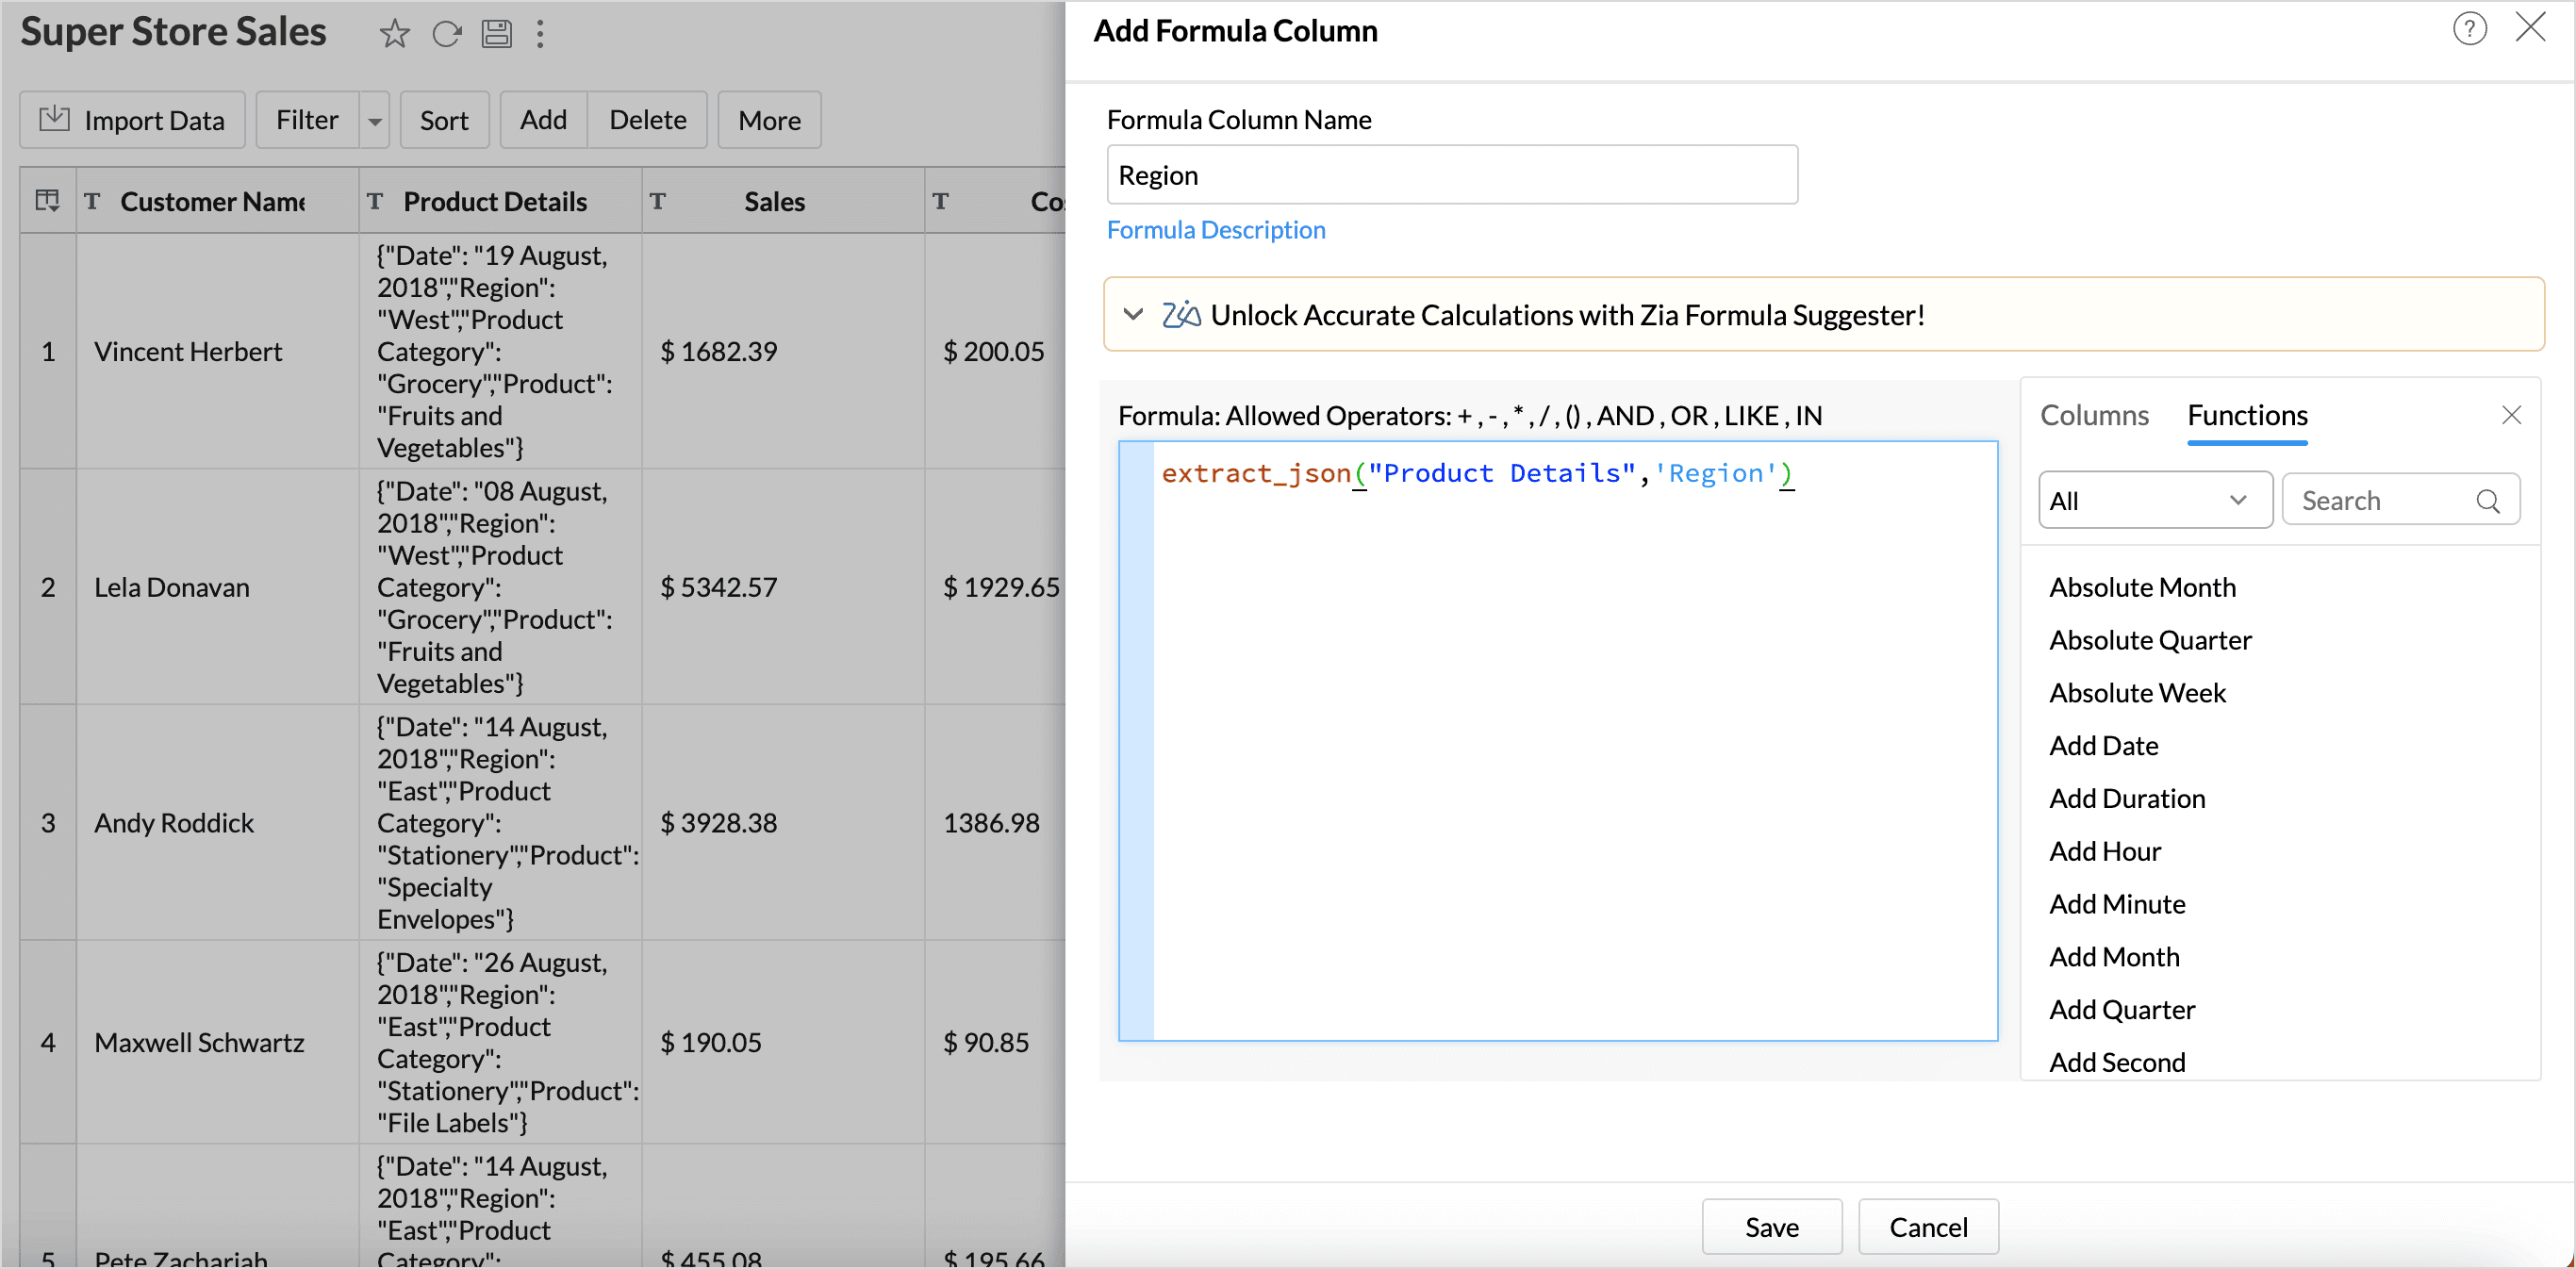
New in-built function for JSON
Extracting data from JSON columns from within Zoho Analytics using the new built-in function extract_json().
Learn more.
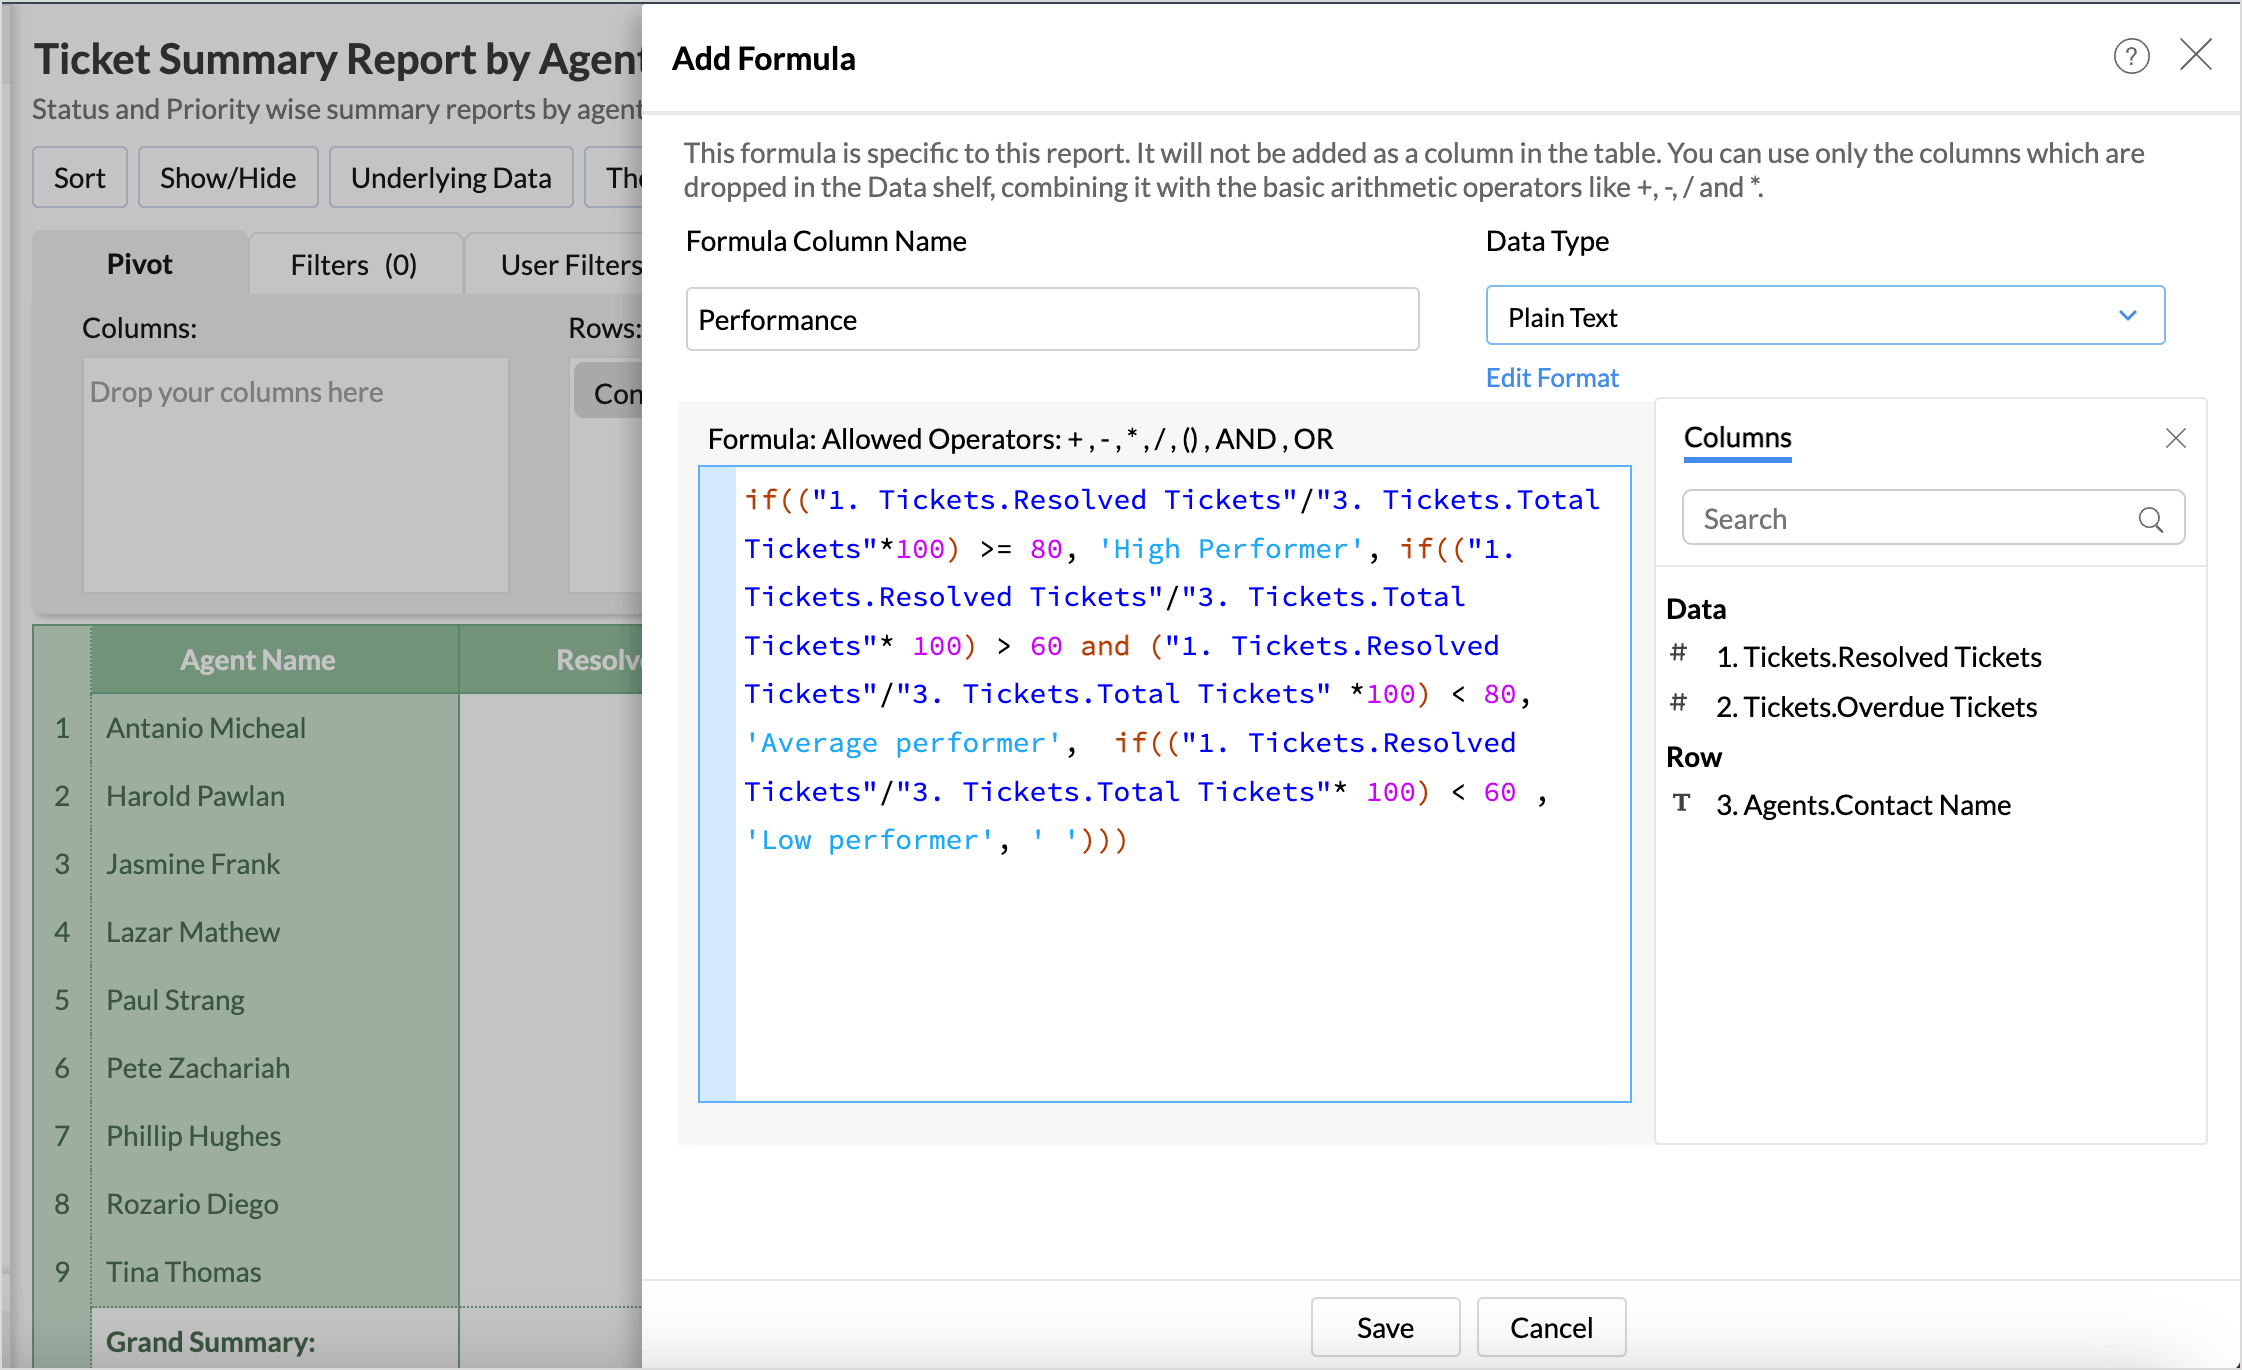
String data type in report formulas
Zoho Analytics now supports plain text data types in Report Formulas. This feature is useful for categorizing numeric data values based on conditions, such as performance tracking and segmenting data.
Learn more.
Conditional formatting based on other columns
With the recent update, you can now apply conditional formatting based on other columns used in the pivot table. This enhancement provides more flexibility and makes comparison between the related columns easier.
Learn more.
![]()
Static images and custom icons in KPI widgets
Add custom icons to provide visual cues about the type of information contained in the widget without the need for lengthy descriptions. Using icons in the dashboard enhances visual appeal and grabs the attention of the users.![]()
Copy and paste reports in dashboards
Zoho Analytics allows you to reuse reports and KPI widgets by copying and pasting reports to other tabs in the dashboards. This cuts down the redundant work and saves time recreating similar reports.
Learn more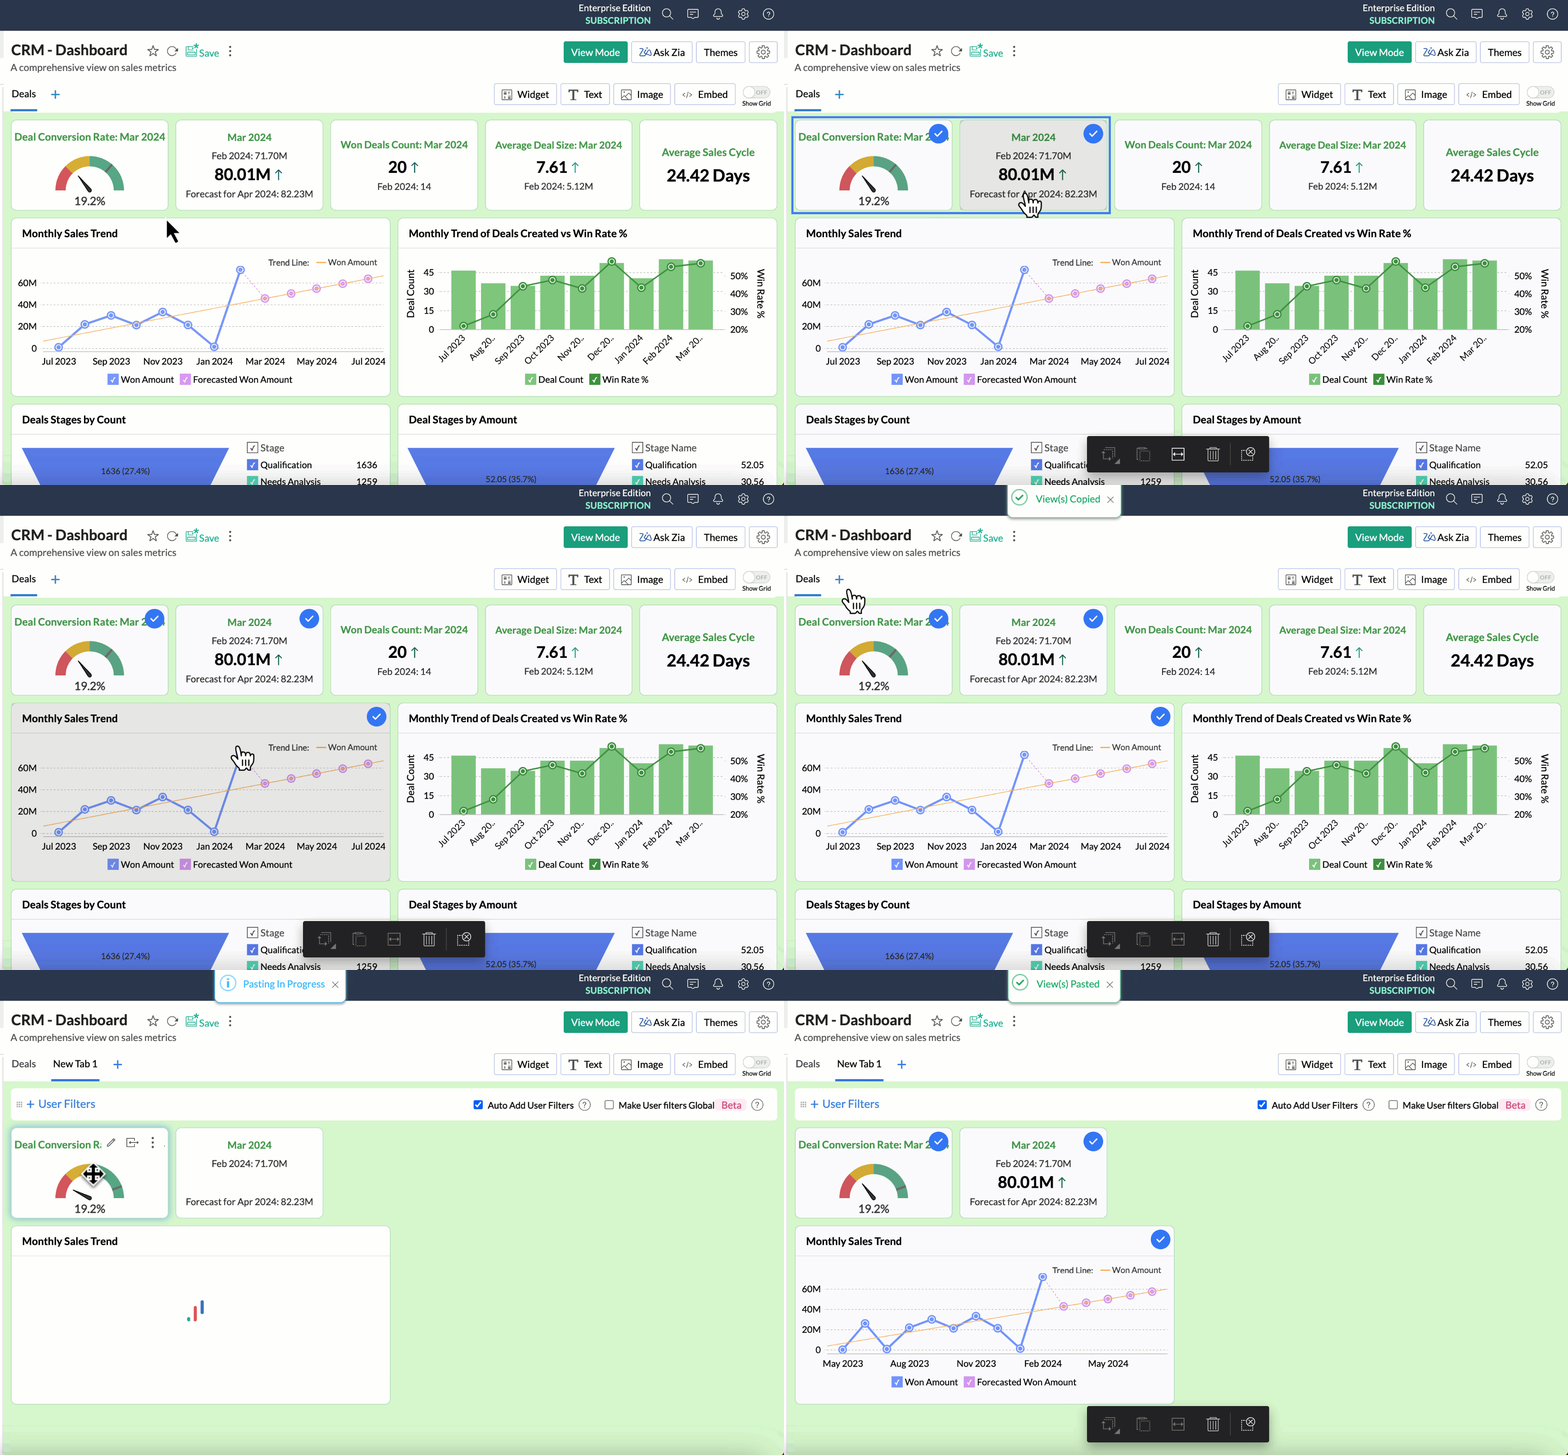
Sharing views created by users with admin
Users can share the reports created by them with Administrators. (Until now, this wasn't possible). The views shared by the users will be listed under the Shared Views folder for the administrator, with the name of the user who shared the report.
Learn more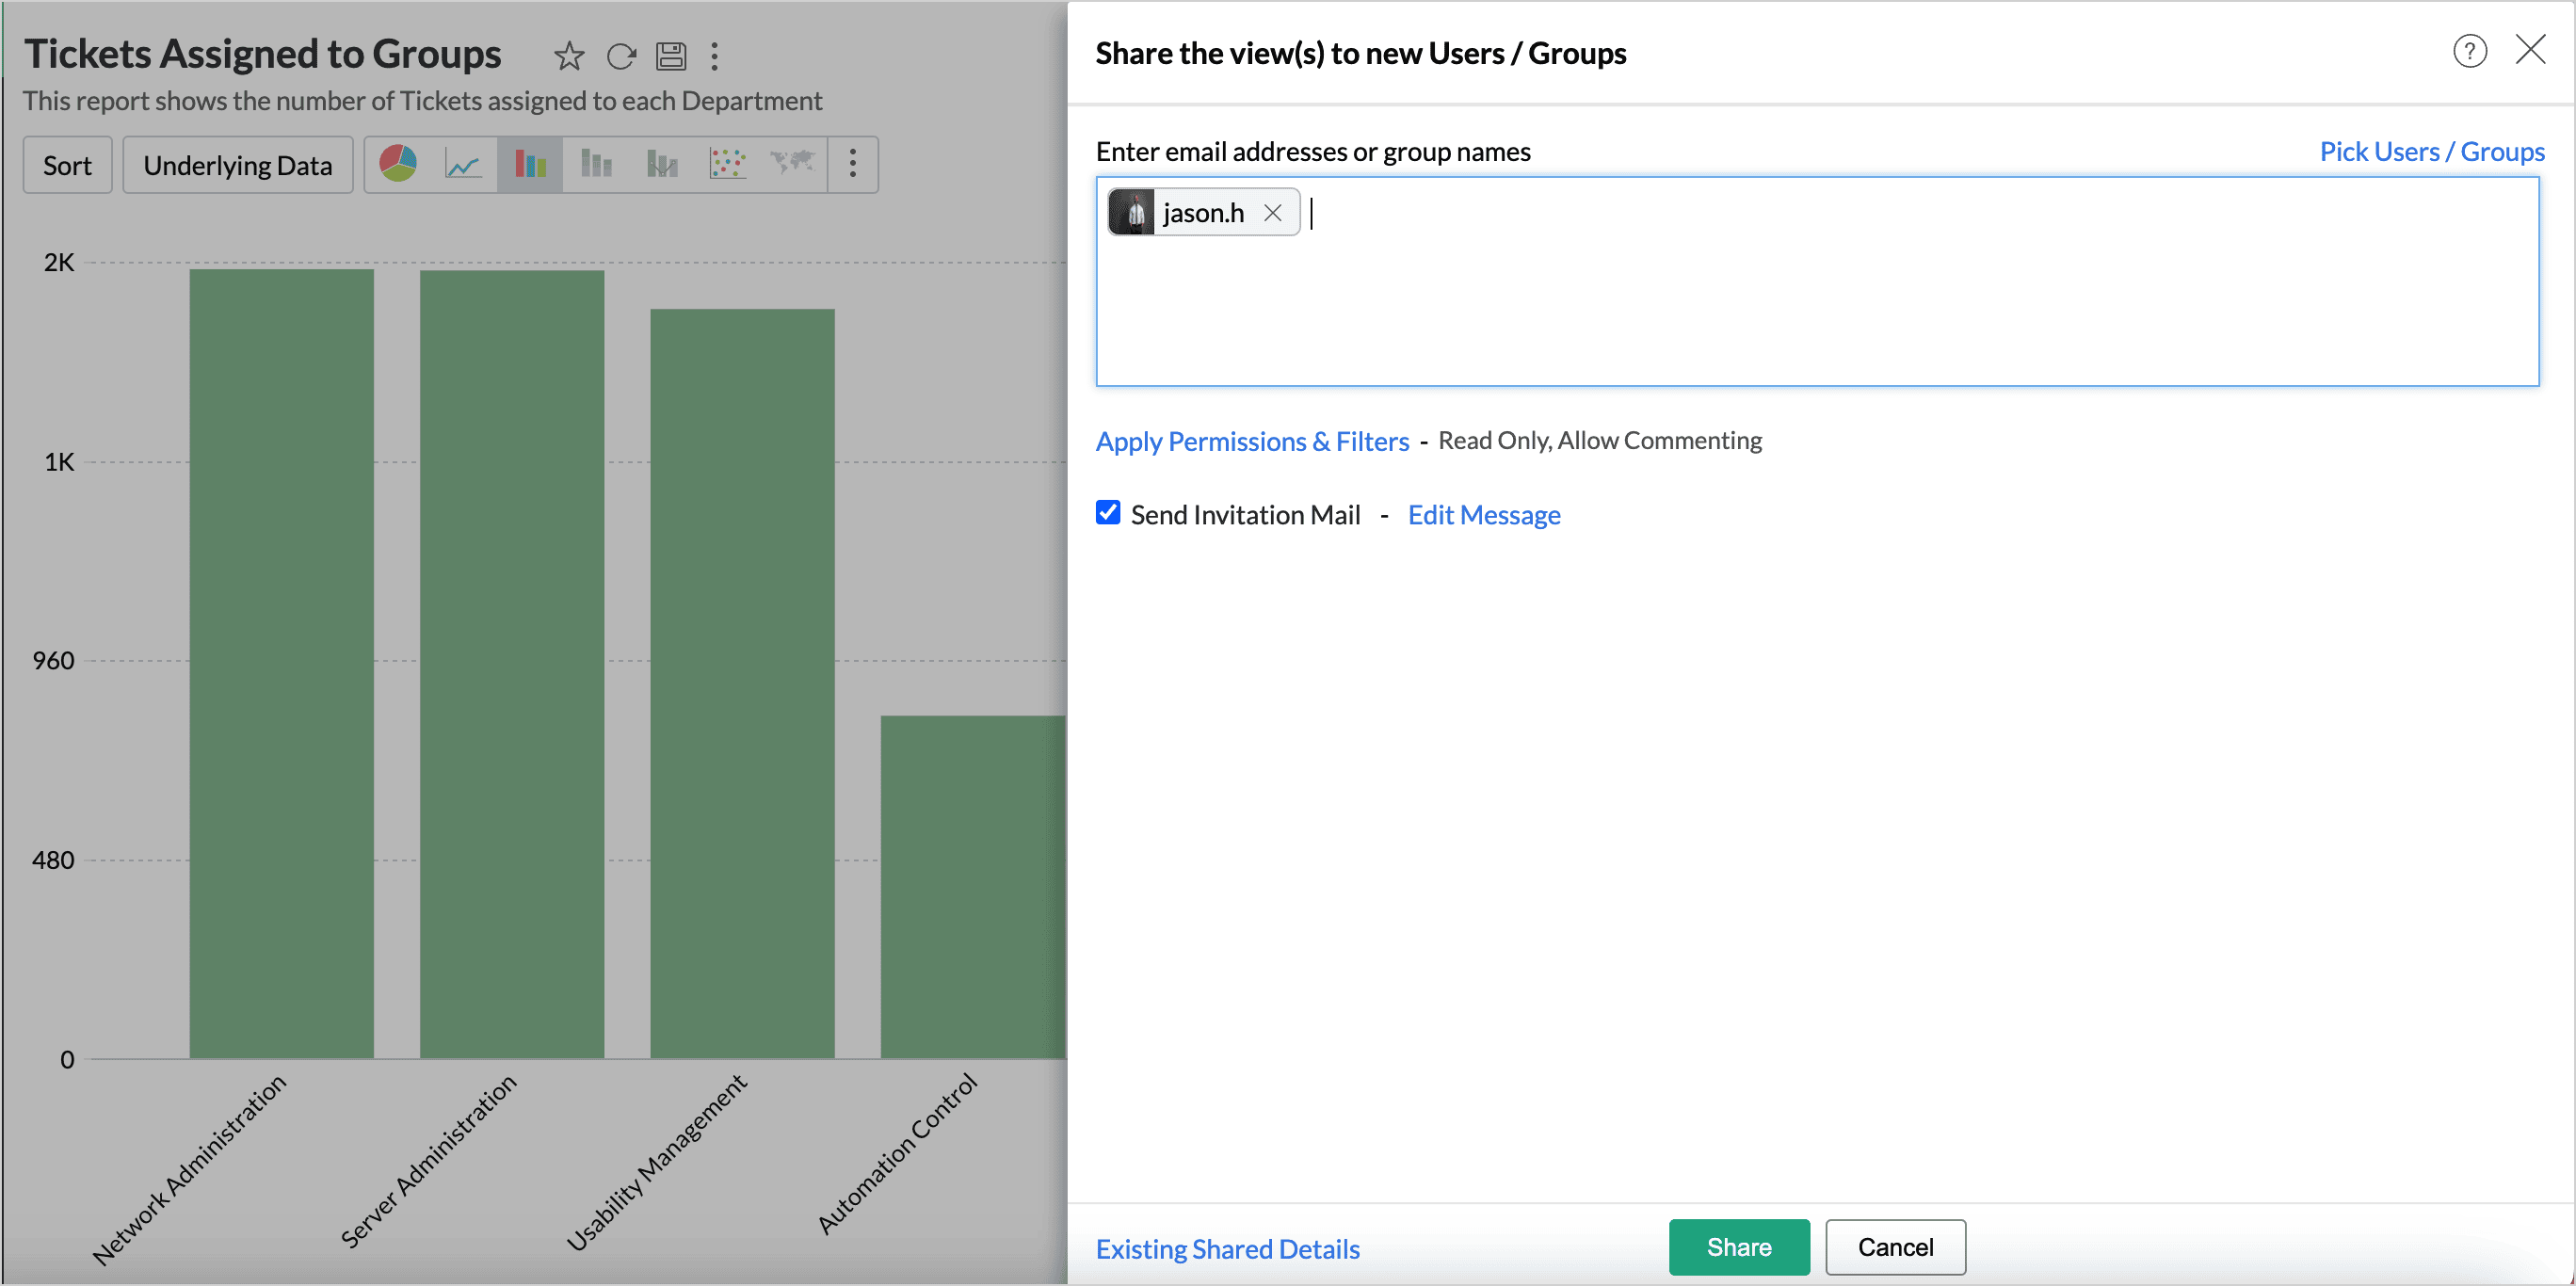
Add-ons for Zoho CRM and Zoho Books ultimate plans
Users in the Ultimate plan of Zoho CRM, Zoho Books, and Zoho Inventory can purchase additional rows and users from the online store.
Jun
Announcing Zoho Analytics 6.0 (Beta)
We are delighted to open up the next major version, Zoho Analytics 6.0 Beta! The new version comes packed with a wide range of functionalities for all persona, namely business users, data analysts, data engineers, and data scientists. Zoho Analytics team has meticulously developed these functionalities with a focus on current and future business needs, incorporating valuable user & market feedback.

New capabilities in Zoho Analytics 6.0 Beta includes more data connectors, new visualizations, new interactions, advanced analytical models , the ability to build custom ML models, and 60+ features.
1. Data Connectors & Data Management
- New Connectors: We are expanding our already available 500+ data connectors with 25+ new connectors for big data platforms and business applications that includes Yellowbricks, ClickHouse, Dremio, Zoho Connect,Zoho Marketing Automation, Zoho Backstage, Amazon Seller Central, Airtable and many more.
- Audit History: This provide a comprehensive record of user and system actions, including details of the time when the action occurred and information about the administrator who performed the action.

- Sync History: This provides a detailed record of data synchronization activities, making it easy for the administrators to track the status of each data sync.

- Import Rollback: This capability reverts the current data import version to its previous version without affecting the existing data flow and analysis, ensuring data integrity.

- Unified Metrics: A unified metrics consolidates all the metrics used across the workspace, helps in standardization, promotes usage, and avoids duplication.
- Data Bucketing: Categorize or group data points easily with the Bucket Columns options in Zoho Analytics. (Until now, users had to write formulas to achieve this; now, it is available as an inbuilt option.)

2. Visual Analytics
- New Visualizations: Zoho Analytics supports 7+ new chart types namely, sankey chart,racing chart,sparklines in pivot table,geo map layering, sunburst chart,conversion bar chart and tree map to enhance the presentation and interpretation of the data.

- Zia Suggestions: Receive insightful chart recommendations while you are in the creation process. Zia suggests a variety of charts suggestions tailored to your data, allowing you to preview and apply them seamlessly with just a click.

- Global User Filters: You can now have a common user filter across all tabs in the dashboard. Global user filter gets applied across all reports in all tabs of the dashboard.
3. Advanced Data Analytics
- Anomaly Detection: Create charts which highlight anomalous points visually for your attention and action. Zoho Analytics deploys robust ML algorithms and various statistical models for detecting outliers.
- Cluster Analysis: Group similar data points together based on certain factors or conditions using cluster analysis. Zoho Analytics deploys K-means, K-modes and K-prototypes algorithms for clustering the data points.
- Alerts Based on Threshold and Anomalies: Set data alerts based on thresholds and anomalies to ensure timely identification of vital change in the key business metrics and potential issues.
- Ask Zia Bot in Microsoft Teams: Get answers to your data queries, access key business insights quickly, predict future trends, and build reports right from within Microsoft Teams with Ask Zia bot.

4. Build your ML Models with AutoML & Code Studio
- AutoML: Automated machine learning provides a code-free (low-code/no-code) experience to train, verify, and build custom machine learning models with high efficiency. The simple and user-friendly design makes it possible for people with varied data-level expertise to create ML models easily for their custom needs.
- Code Studio: Python Code Studio enables you to build/import custom logic and ML models for your specific data preparation, transformation, enrichment, and analytical modeling needs.
5. Data Storytelling
- BI Fabric: Create unified BI portals for your organization's business needs. Collate reports from other BI applications like Tableau and Power BI. Having a unified portal improves collaboration, promotes centralized accessibility, and makes it easy for C-level executives to make robust business decisions.

- Visual Zia Insights: Visuals help process information far more efficiently than lengthy text descriptions. These visuals facilitate multi-dimensional interpretations like comparison, contribution, distribution, trends and proportions.

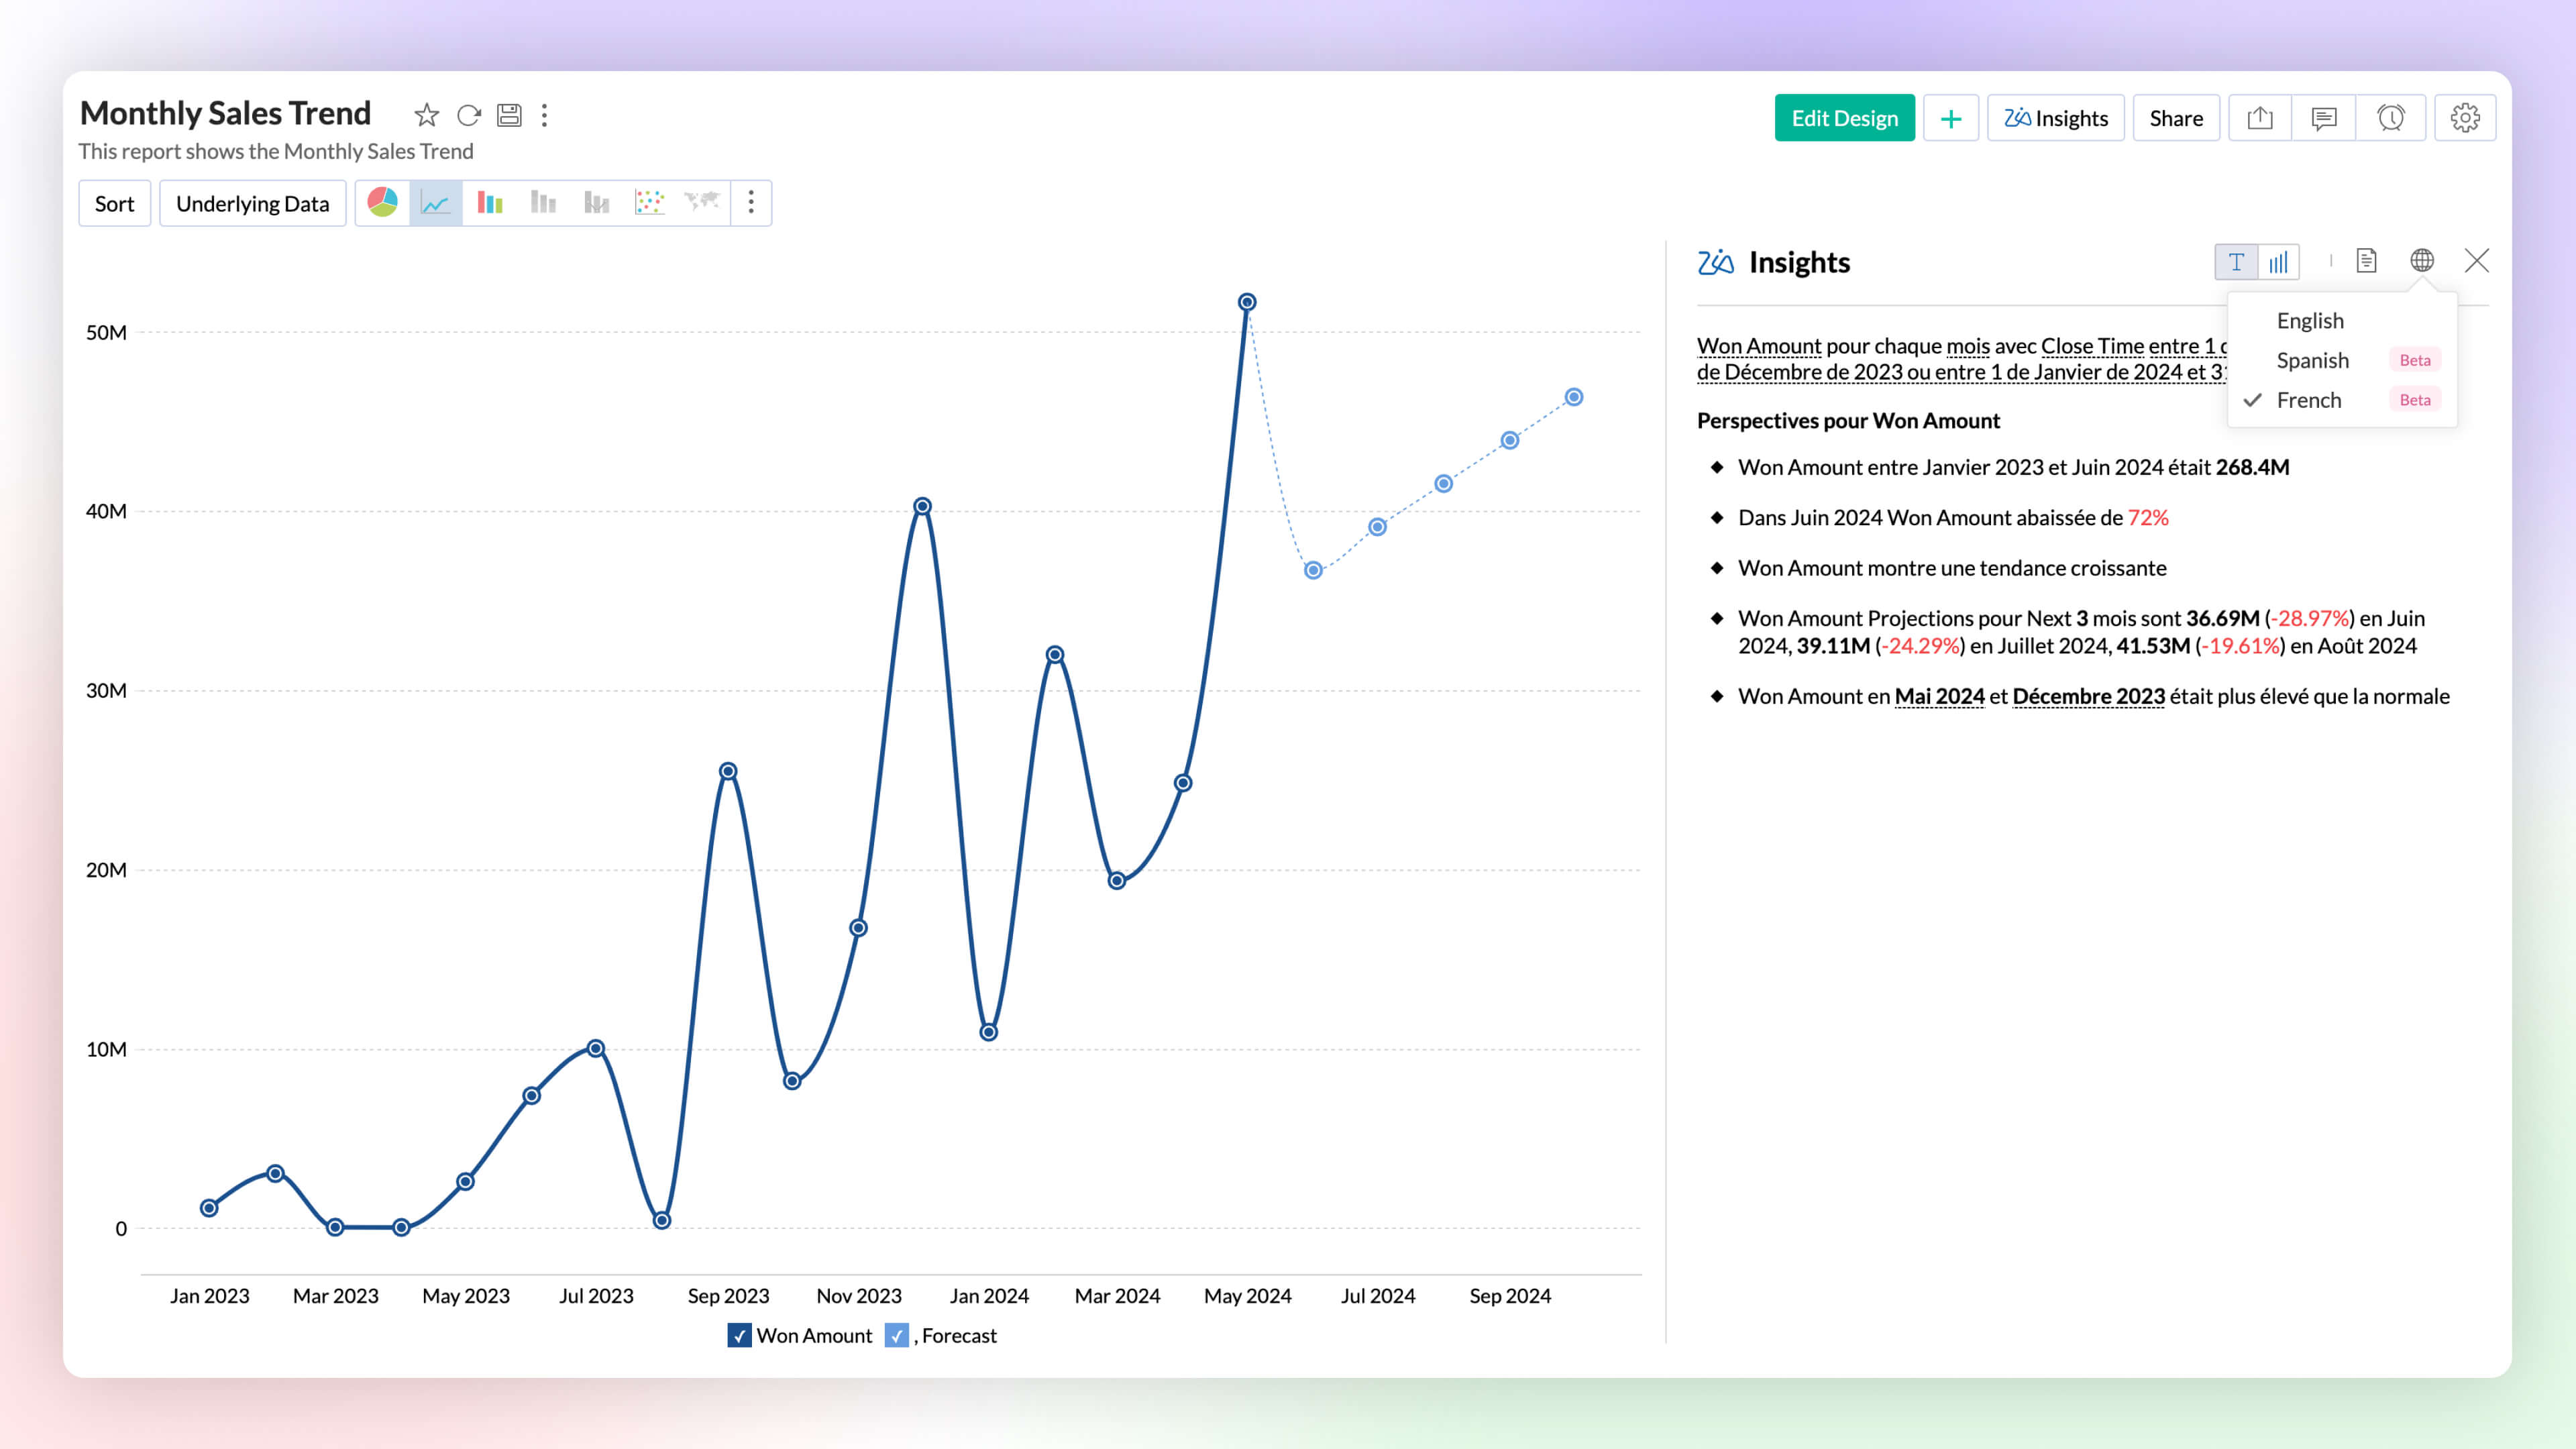
- Zia Insights -Multilingual Support: Zia Insights is now available in French and Spanish. Users can choose their preferred language when accessing Zia Insights for a specific report.
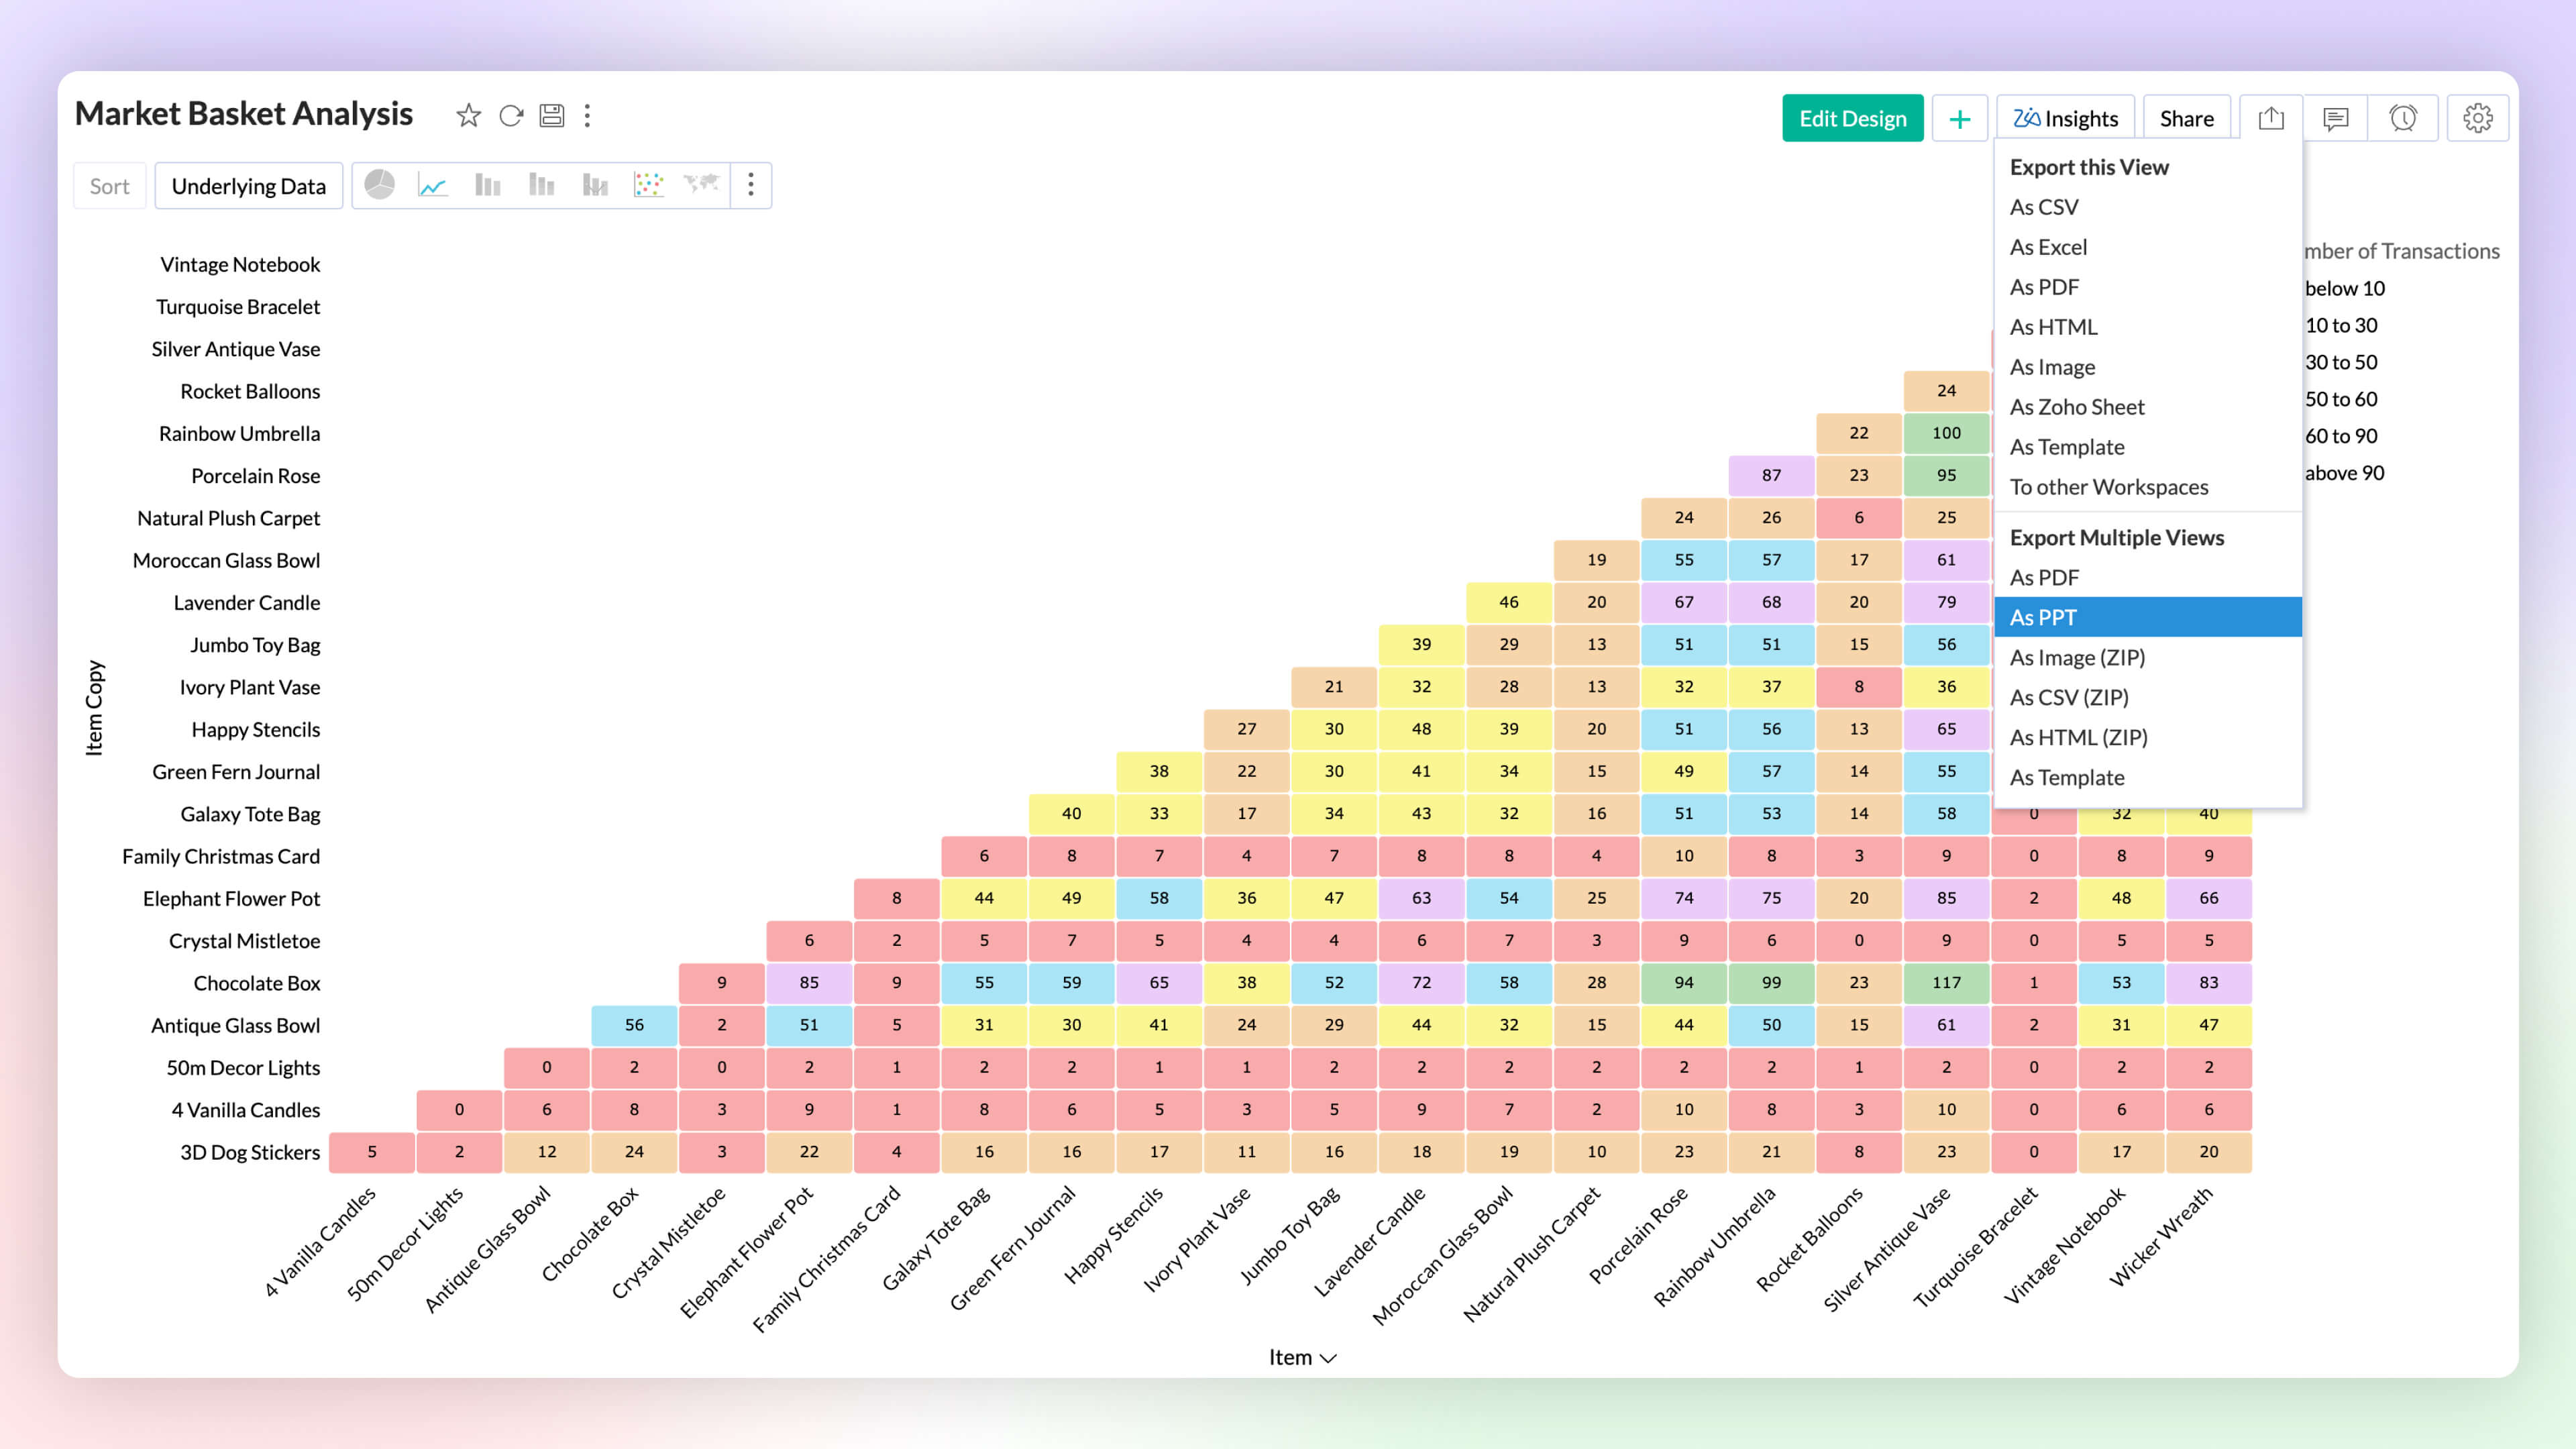
- Export as PPT: Export multiple views as a Microsoft PowerPoint presentation. Enhance security by protecting the file with a password.
6. More enhancements
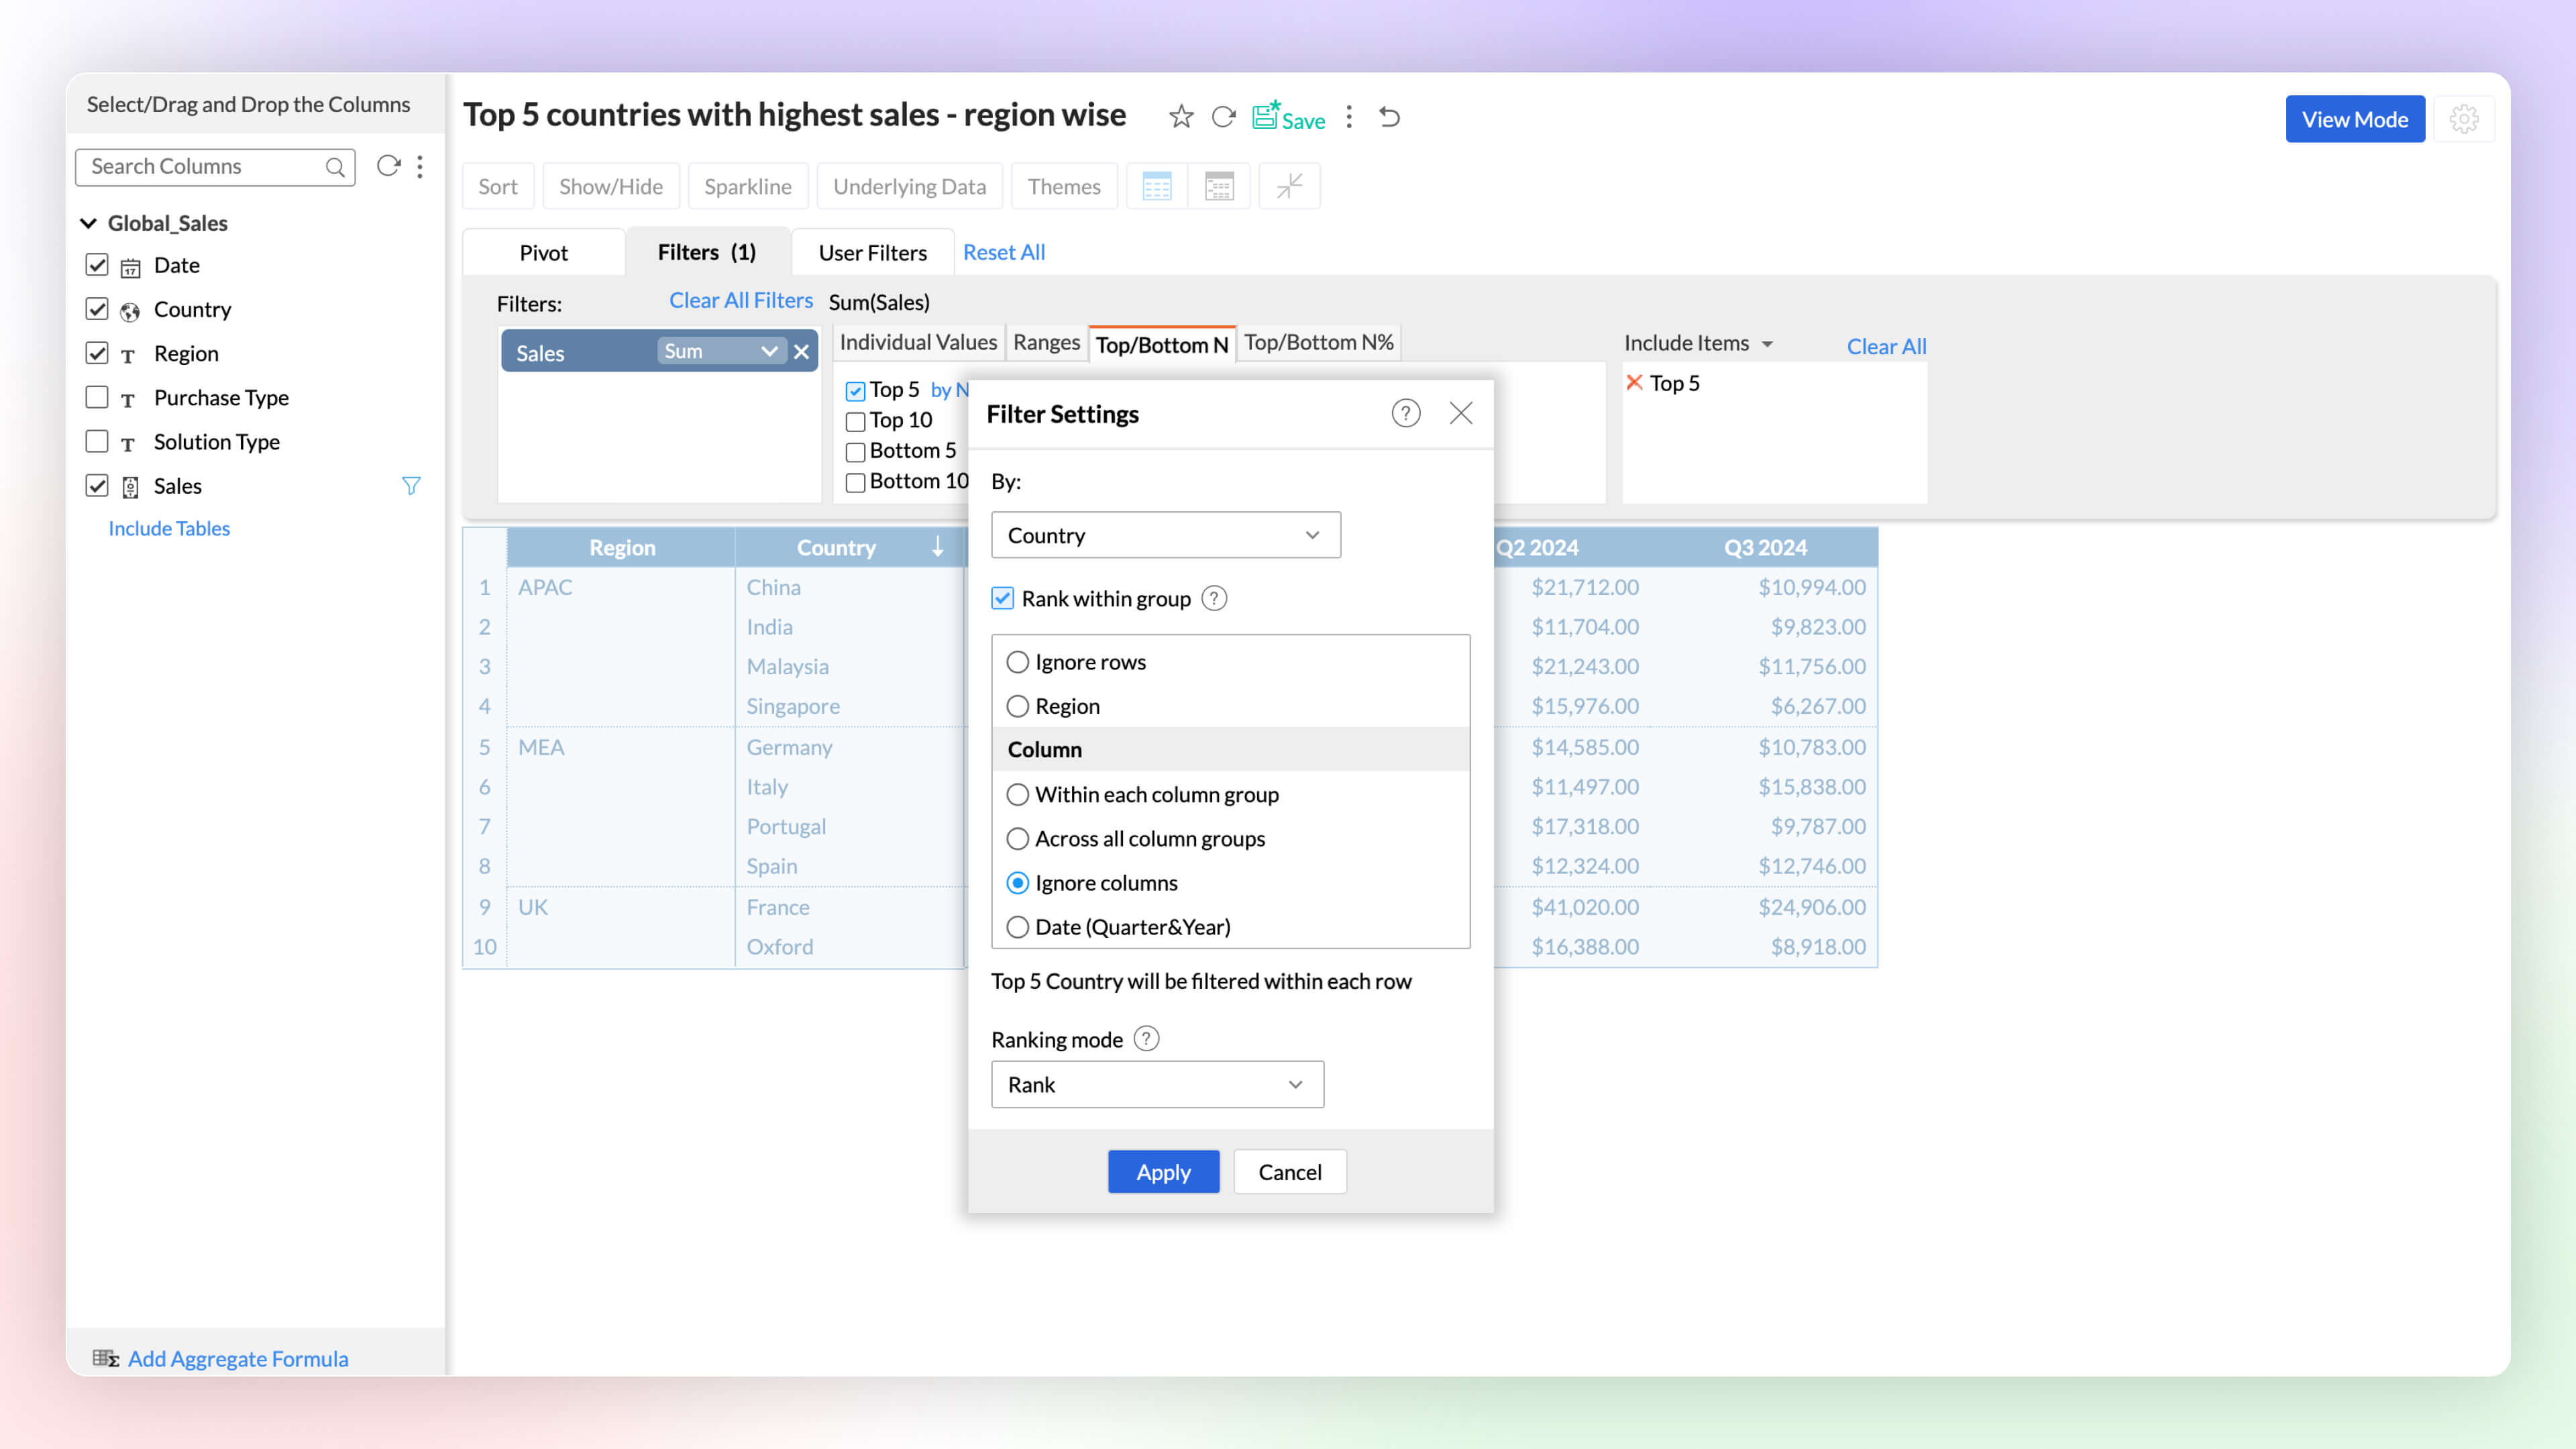
- Rank within Data: Identify and analyze top and bottom performers across various dimensions. The rank-based ability helps find the top or bottom performers within and across individual groups without having to write complex formulas.
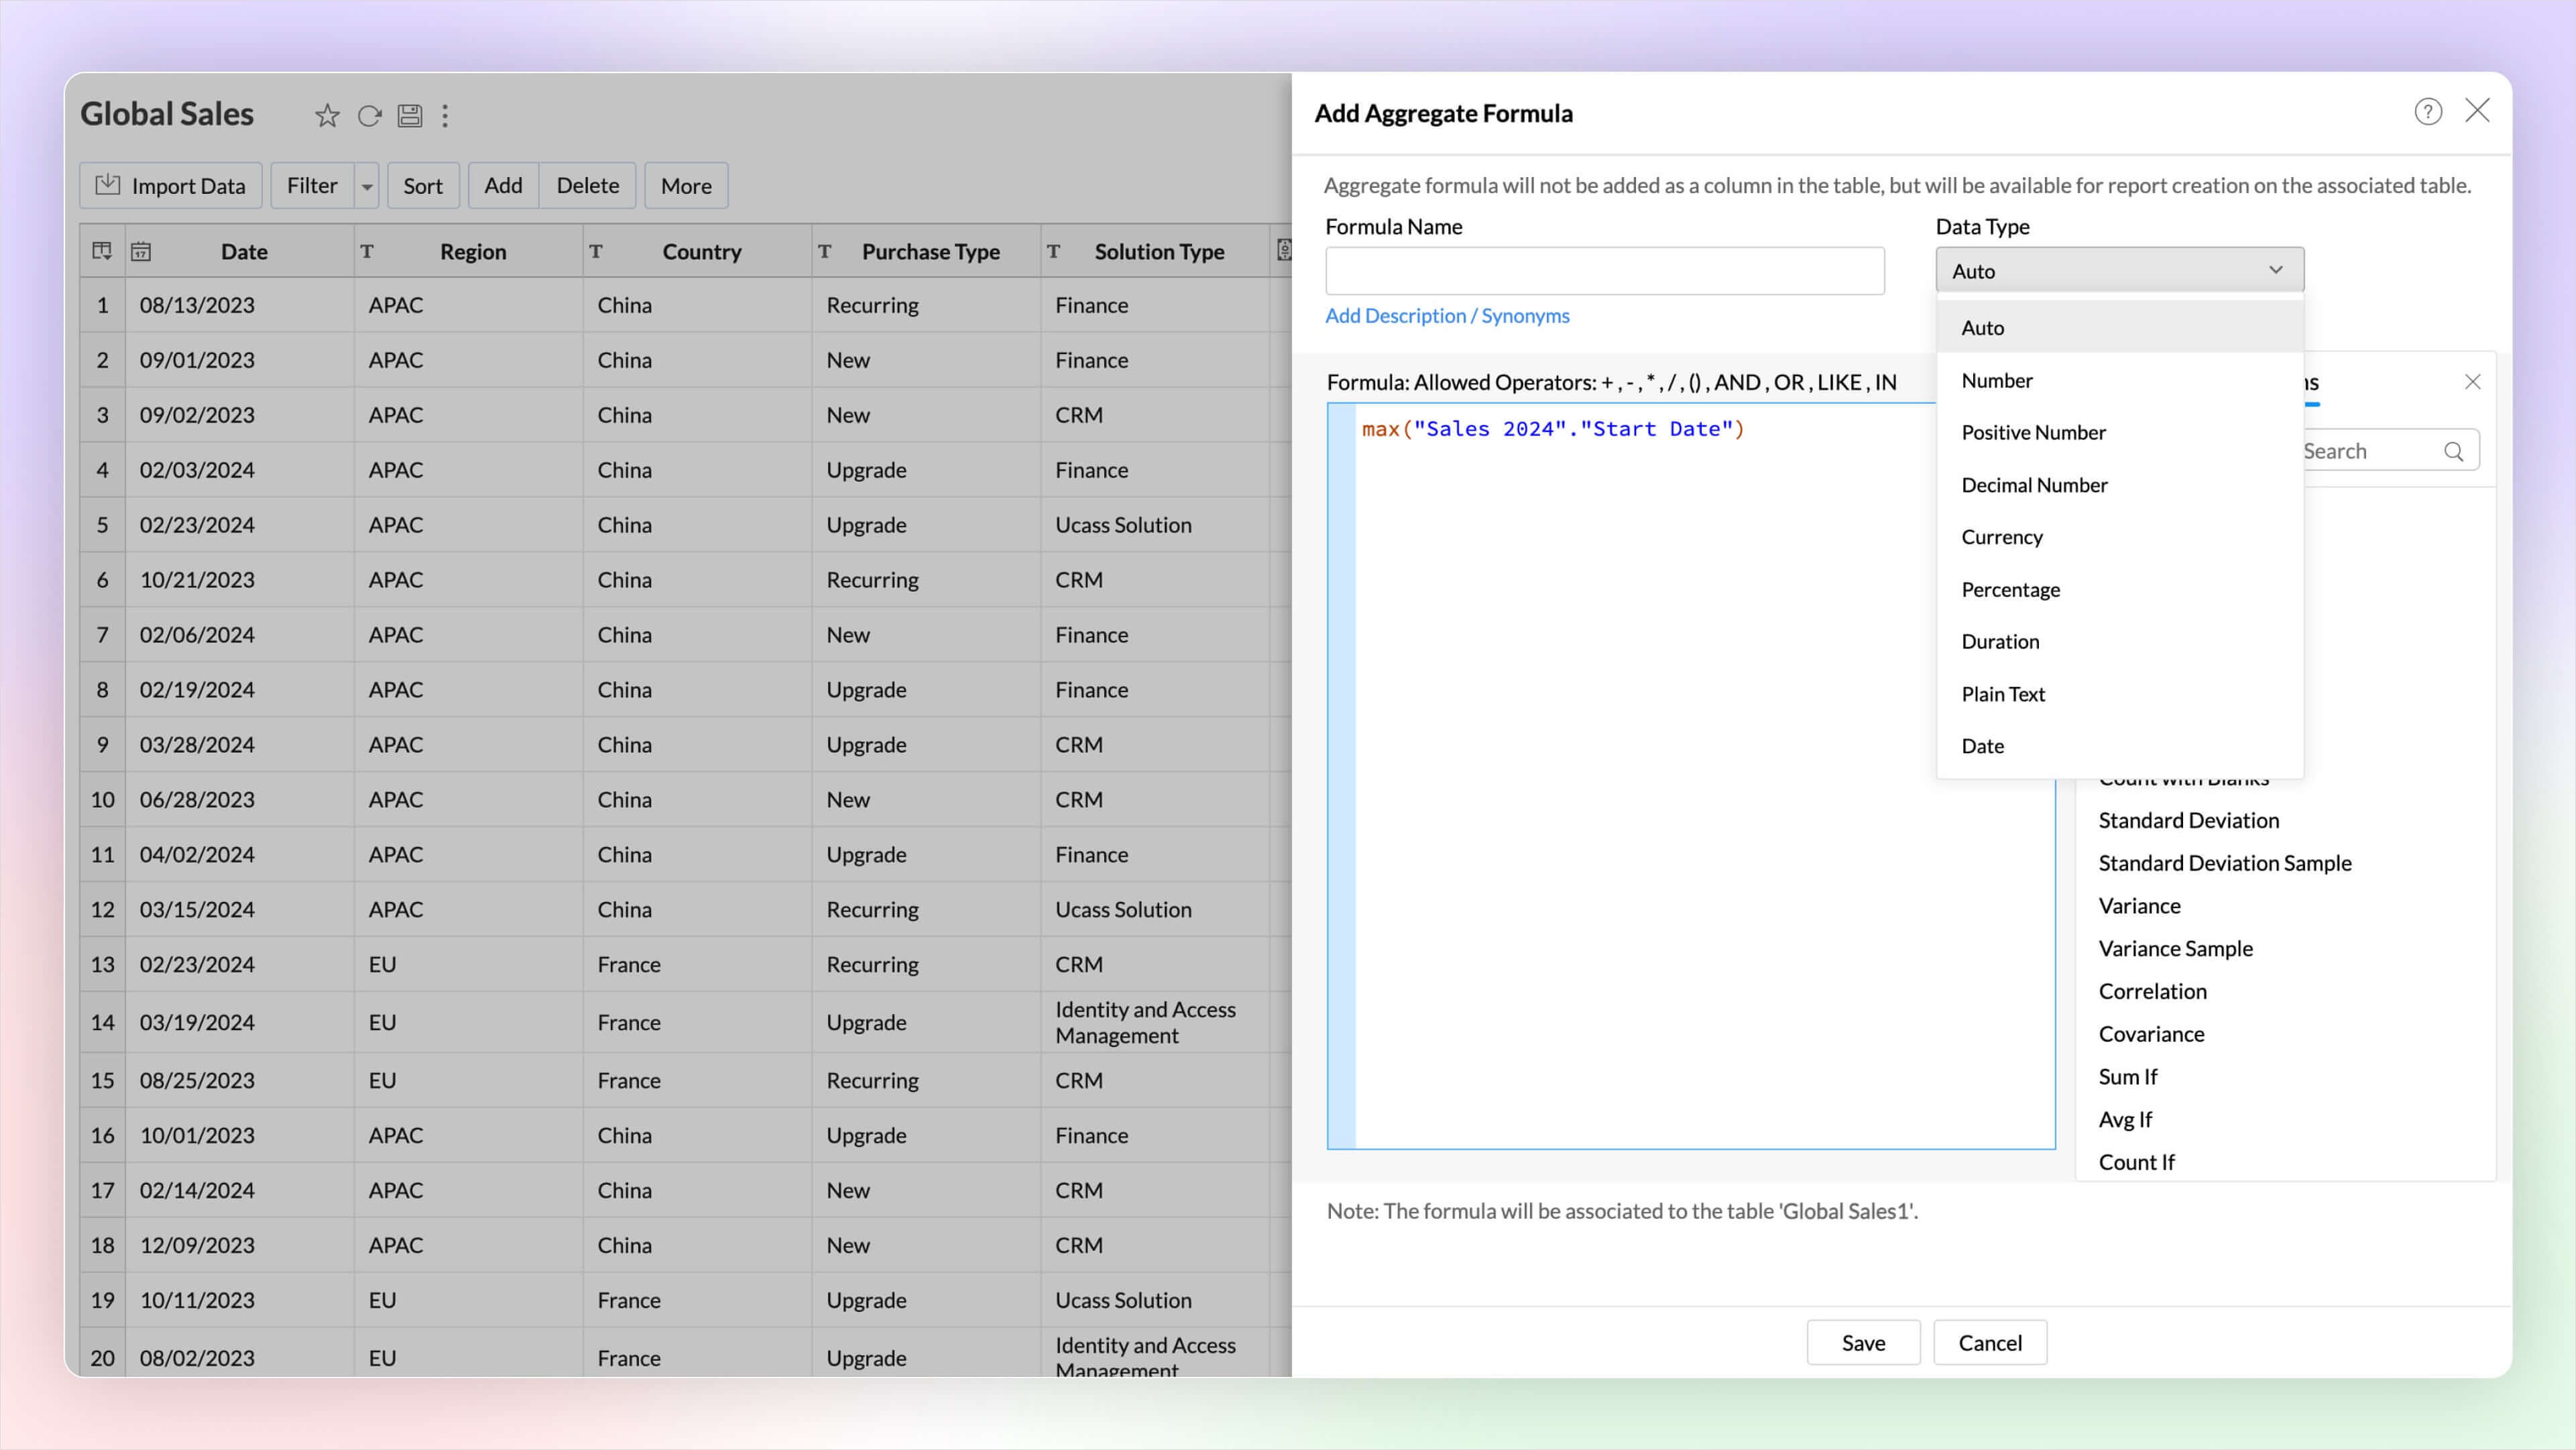
- Date and String data types in Aggregate Formula: Zoho Analytics now supports the date and plain text as return data types in aggregate functions. This improvement proves immensely beneficial in scenarios such as cohort analysis, project milestone tracking, and various other use cases.
- White Label CSS Customization: Elevate the visual appeal of your white labeled product and align it with your brand through the CSS customization feature. This latest addition to Zoho Analytics enables you to customize text, colors, and more on pages, tabs, selections, hover options, enhancing the overall look and feel.

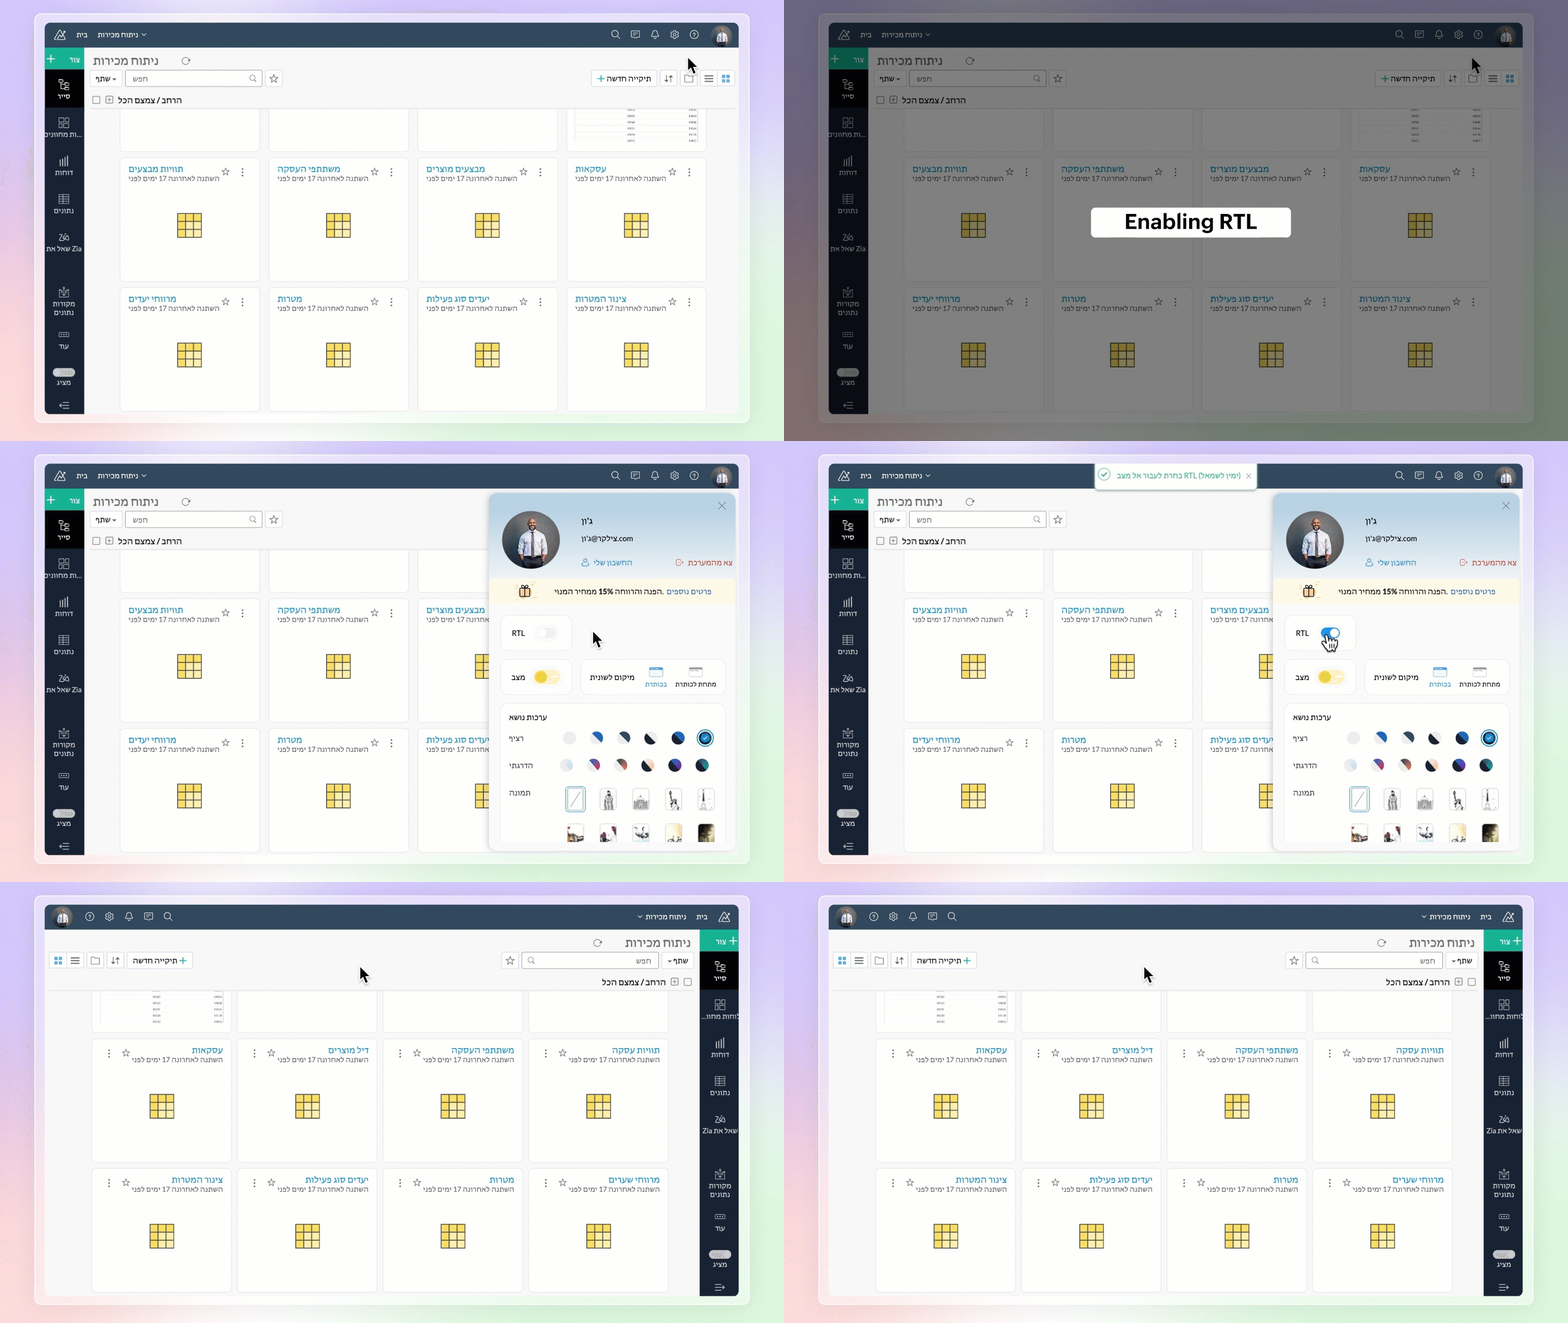
- Right to left User Interface: Zoho Analytics now supports a right to left user interface. This option is best suited for languages like Arabic and Hebrew that are read from right to left.
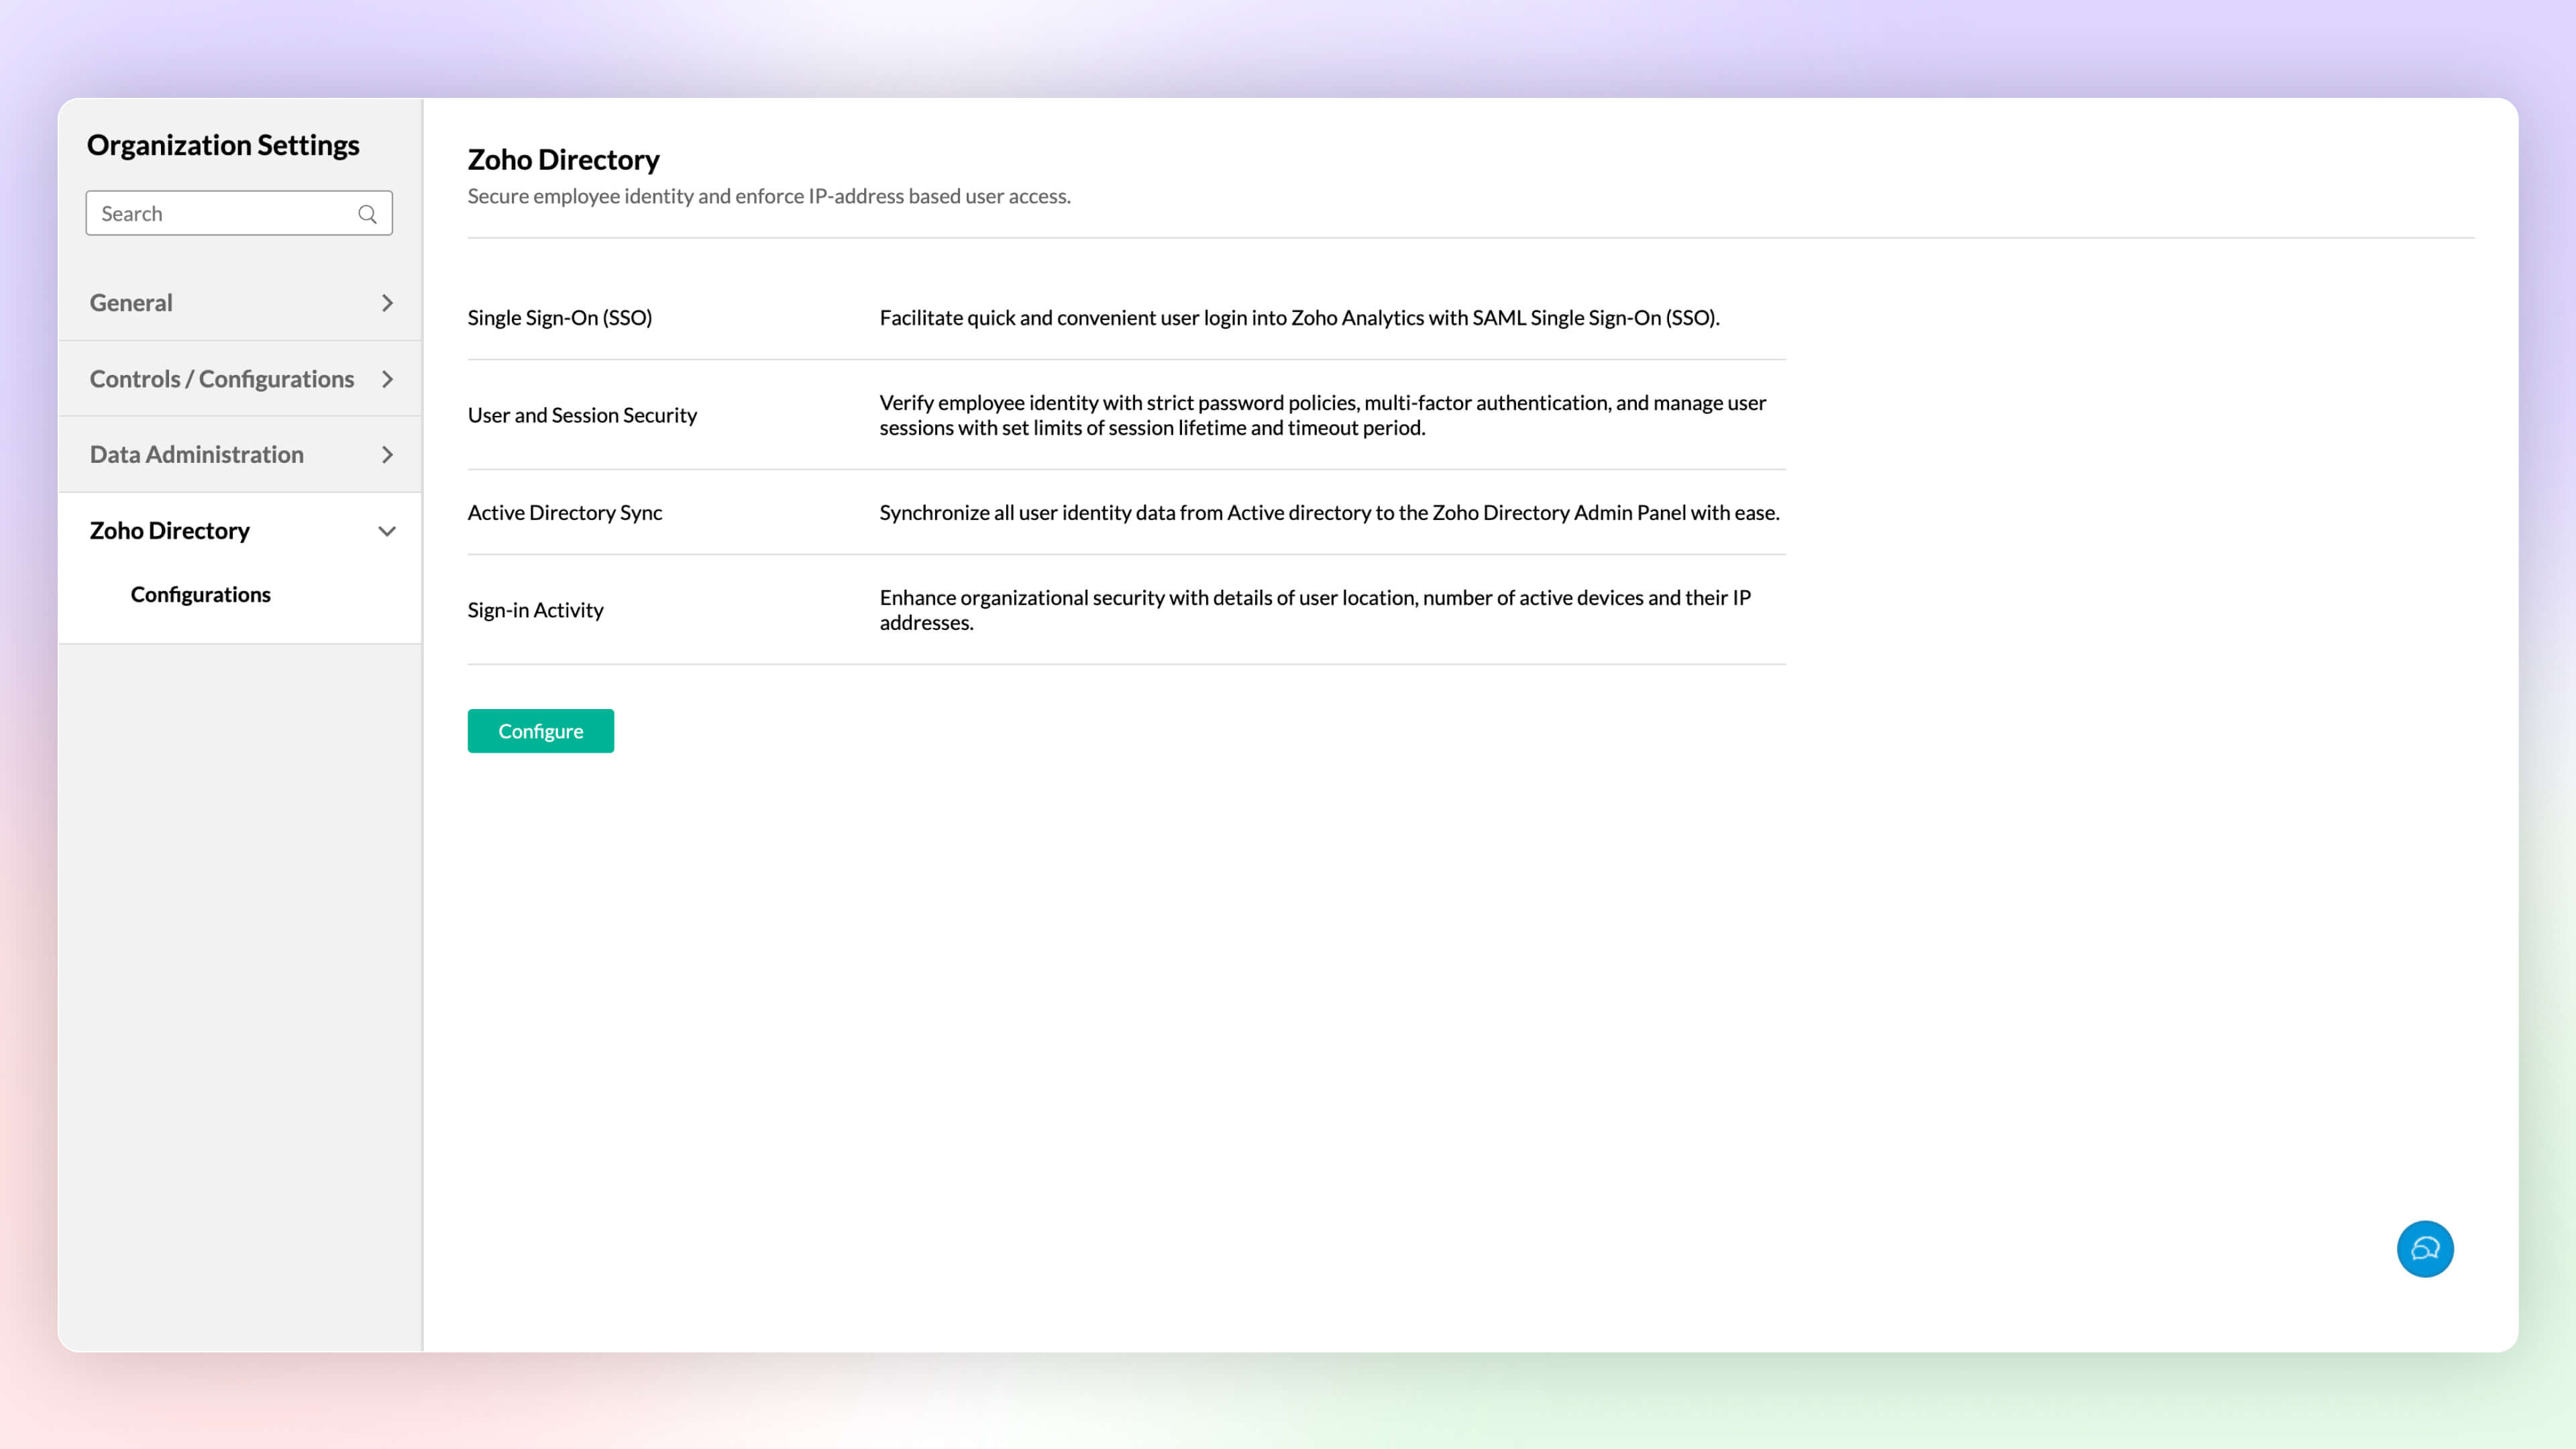
- Zoho Directory: Zoho Analytics' integration with Zoho Directory allows administrators to handle identity and user access management with ease. You can now easily setup Single Sign-on, setup Active Directory sync, manage user access, etc.,with Zoho Directory.
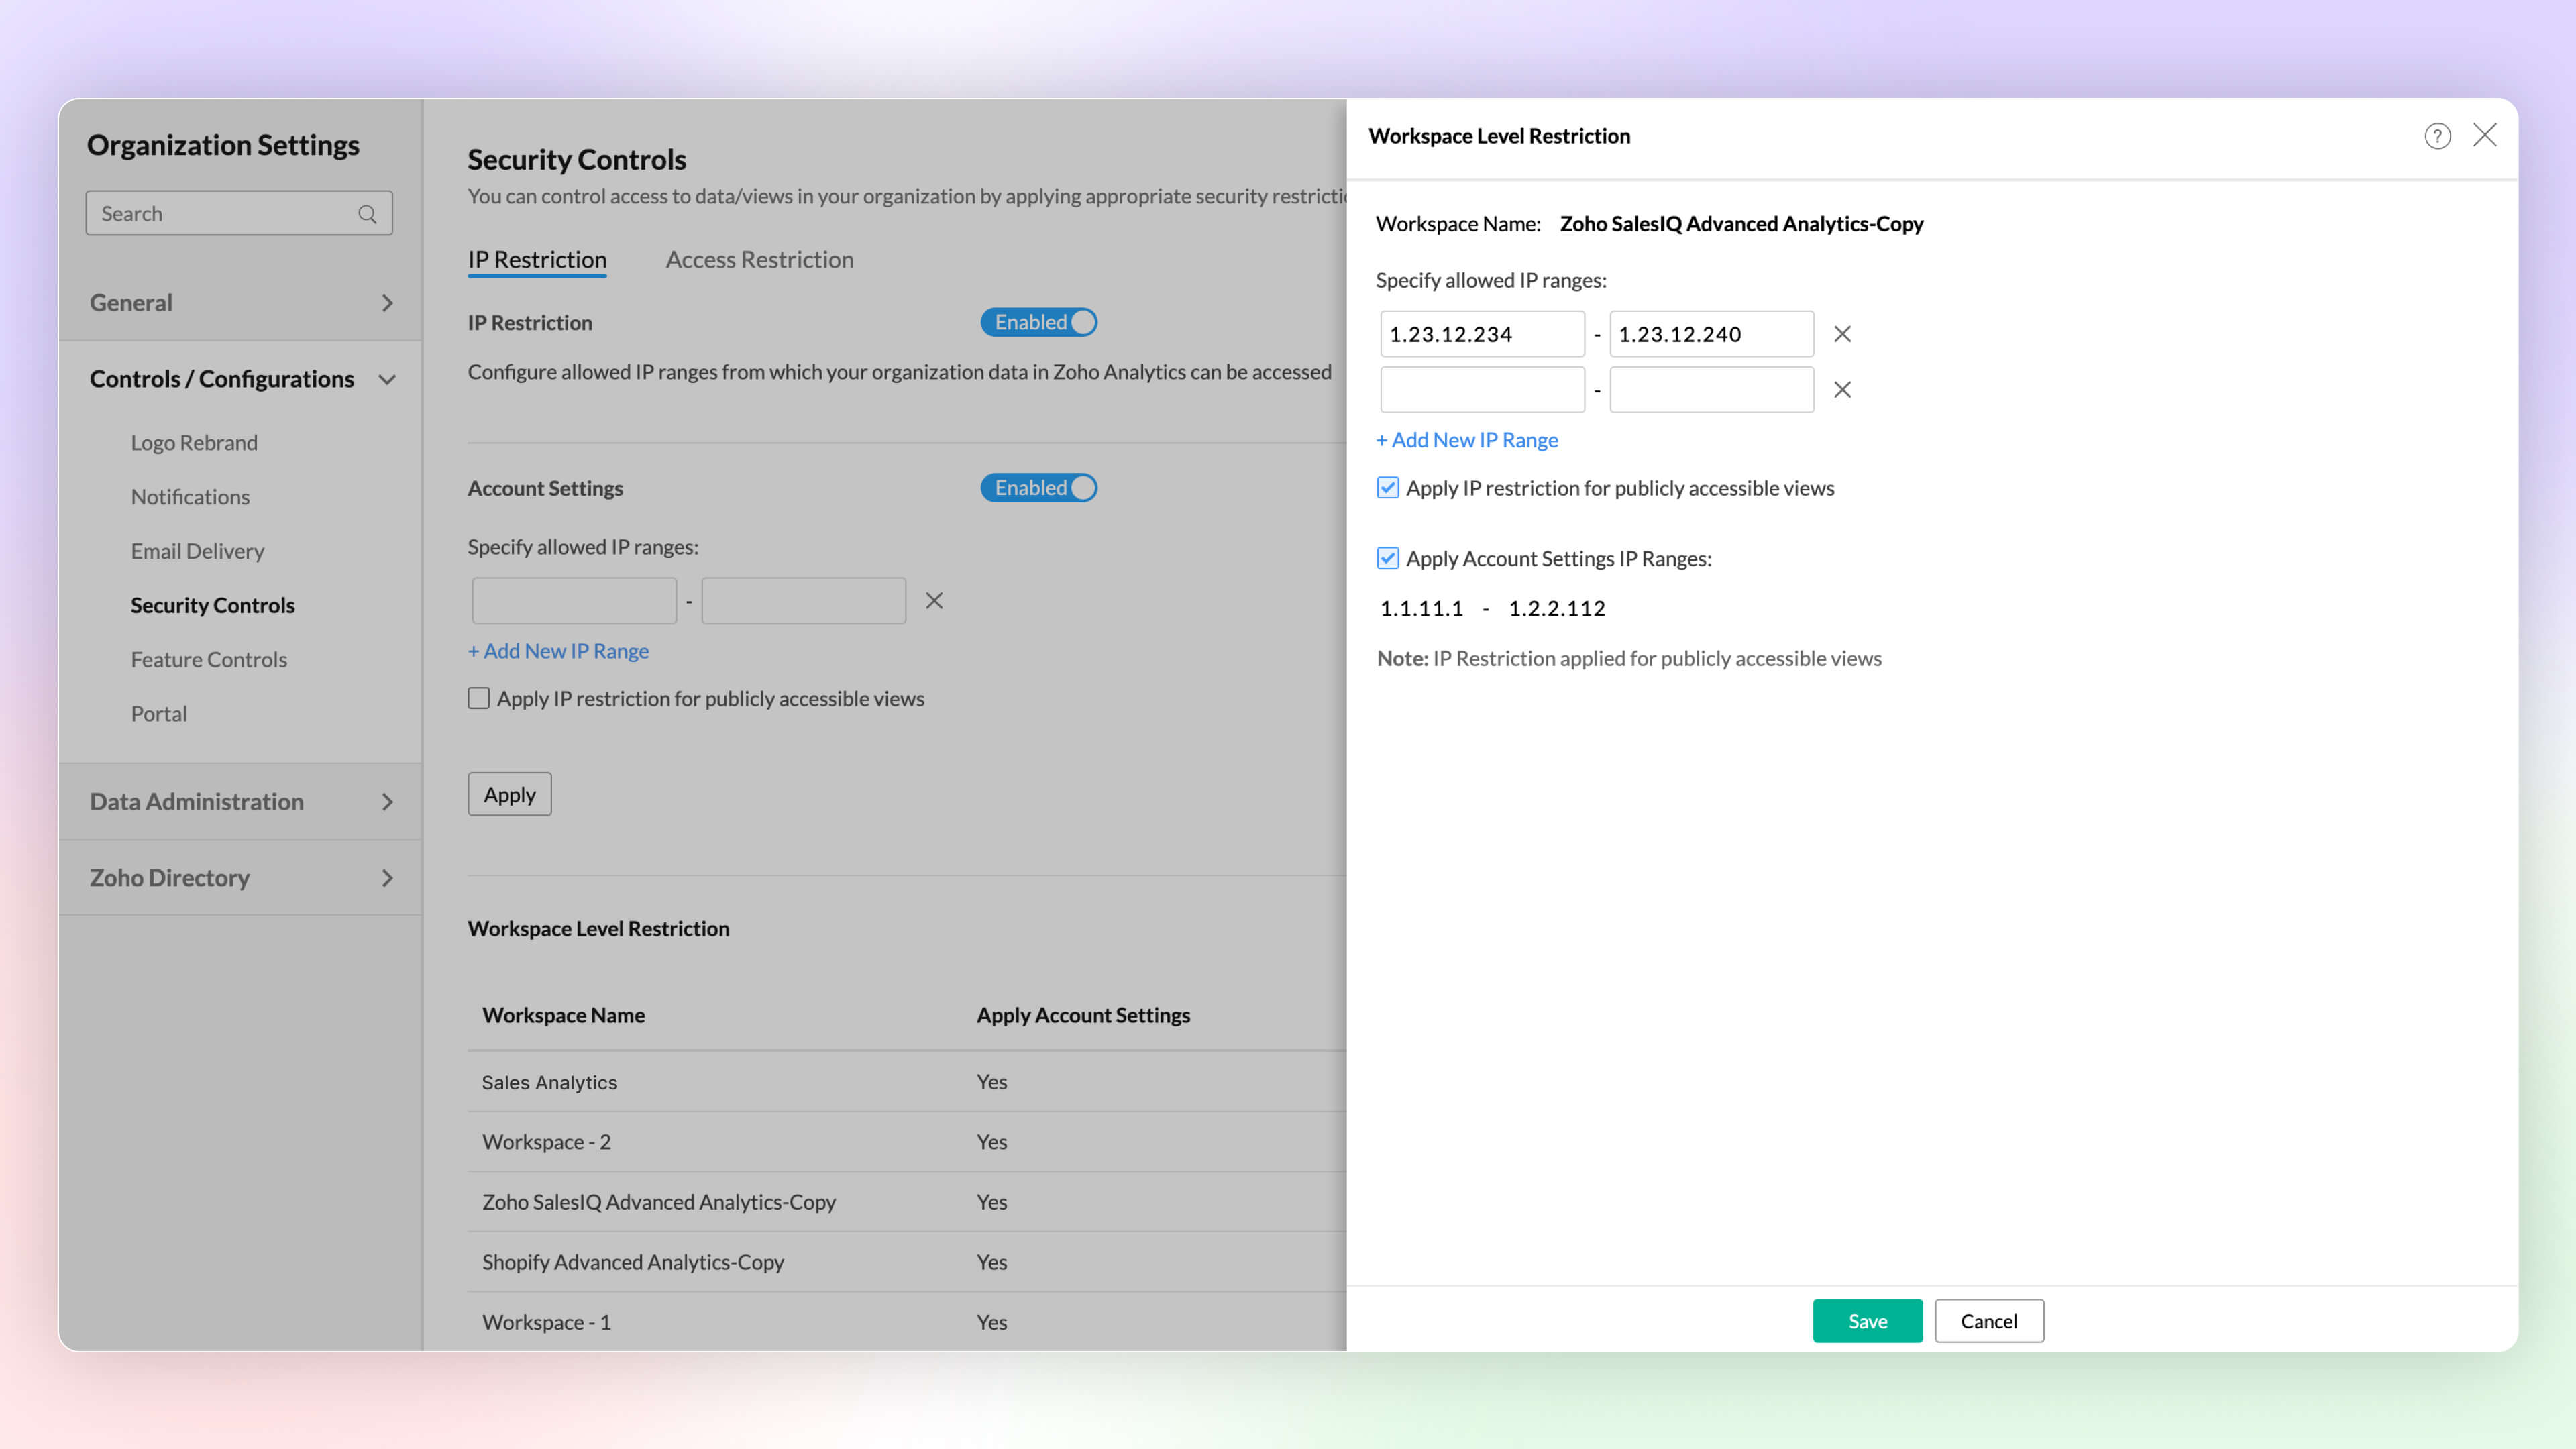
- Workspace Level IP Restriction: Configure workspace-level IP restrictions for enhanced security and to prevent unauthorized access. Previously, IP restrictions were available only at the account level.
- Zoho Analytics Mobile App: The Zoho Analytics Mobile app has been upgraded as a native app, optimized for your specific device. This enhancement provides faster loading times, high-quality visuals, and advanced security features specific to your device's operating system to protect your data.
- Email Schedule APIs: A new set of APIs are now available for managing your email schedules. These APIs enable you to create,update, trigger and delete email schedules easily.
Refer to the Release Notes article to learn more about the 6.0 Beta features.
Apr
30 April, 2024
Sunburst Chart
Learn more.
Conversion Bar Chart
Learn more.
Auto Suggestions on report creation
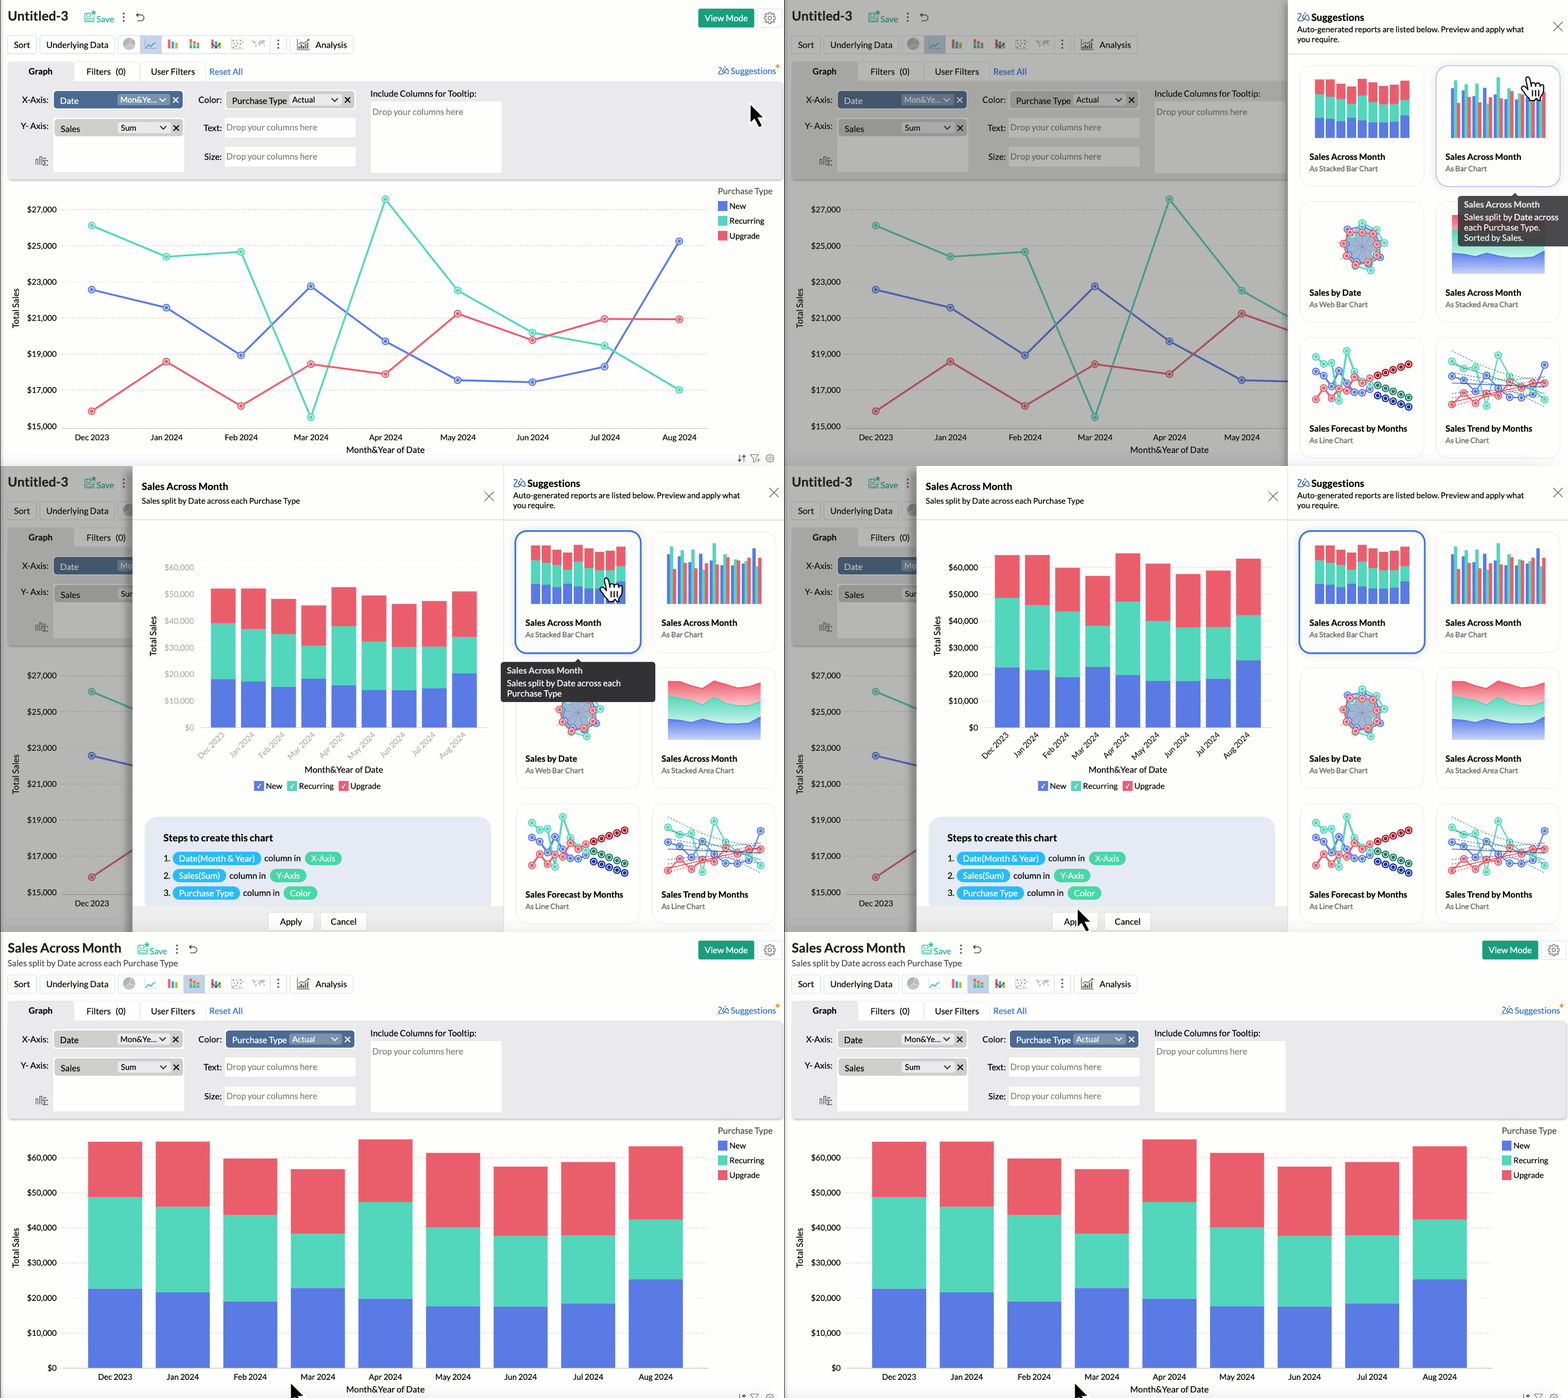
Learn more.
Top/Bottom N within Filters

Learn more.
Import from Elasticsearch
Learn more.
Inline Embed Component in Dashboard
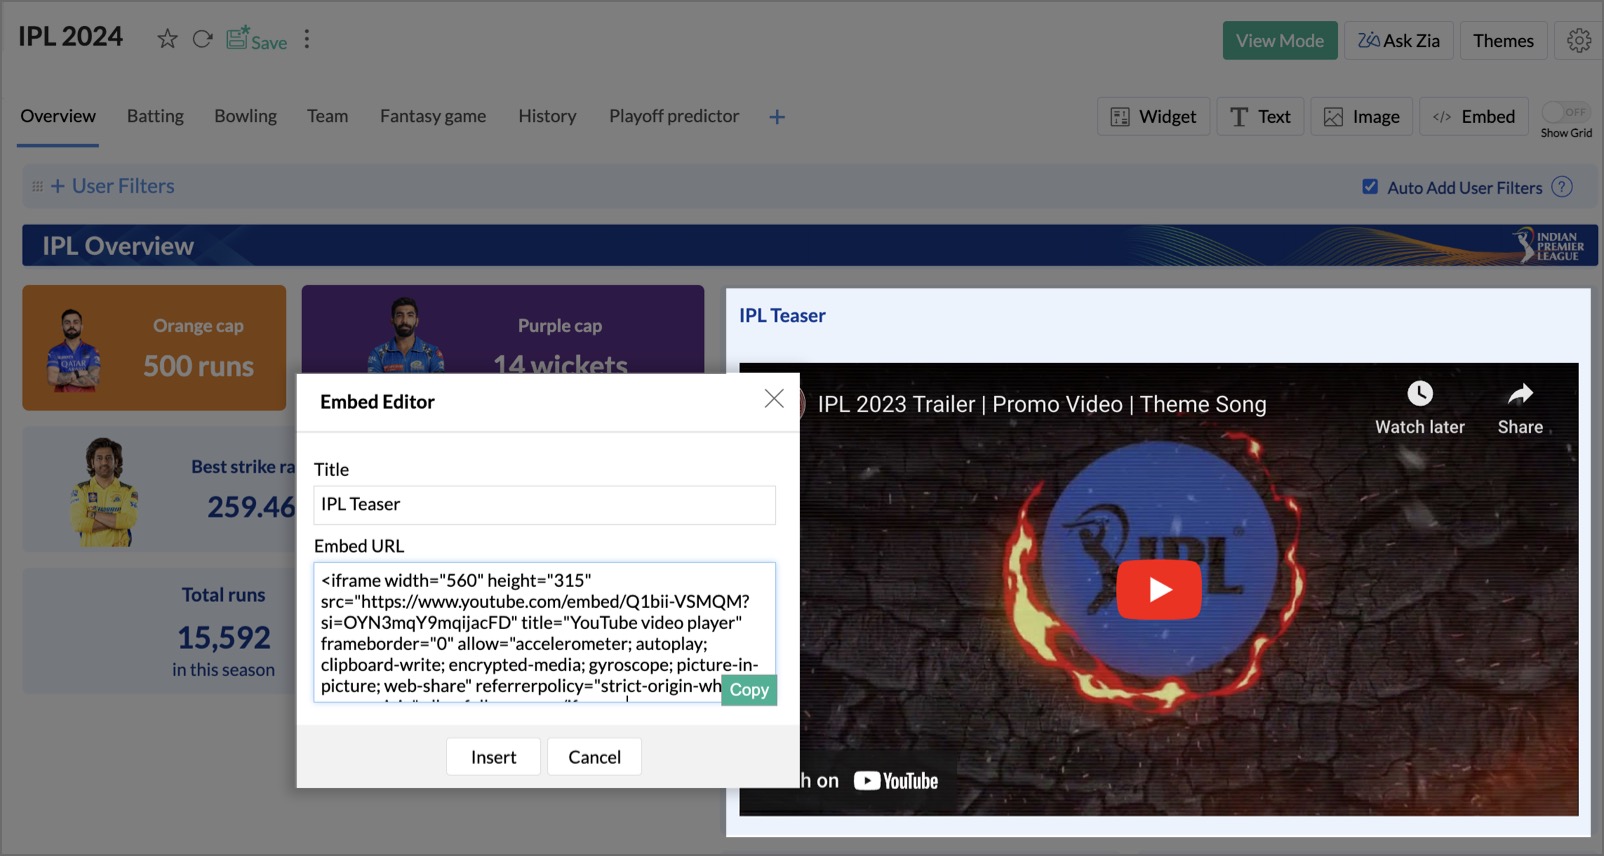
Learn more.
New set of APIs
- Get Workspace Users
- Add Workspace Users
- Delete Workspace Users
- Change Workspace Users Status
- Change Workspace Users Role
C# SDK Moves to .NET 6.0
Learn more.
Mar
28 March, 2024
New Database Connectivity
We've added two new database connectivity options: HFSQL and OLEDB databases. Connect your data with Zoho Analytics securely and extract valuable insights. Schedule periodic fetches for near-real-time analysis.
Workspace Level Currency Formatting
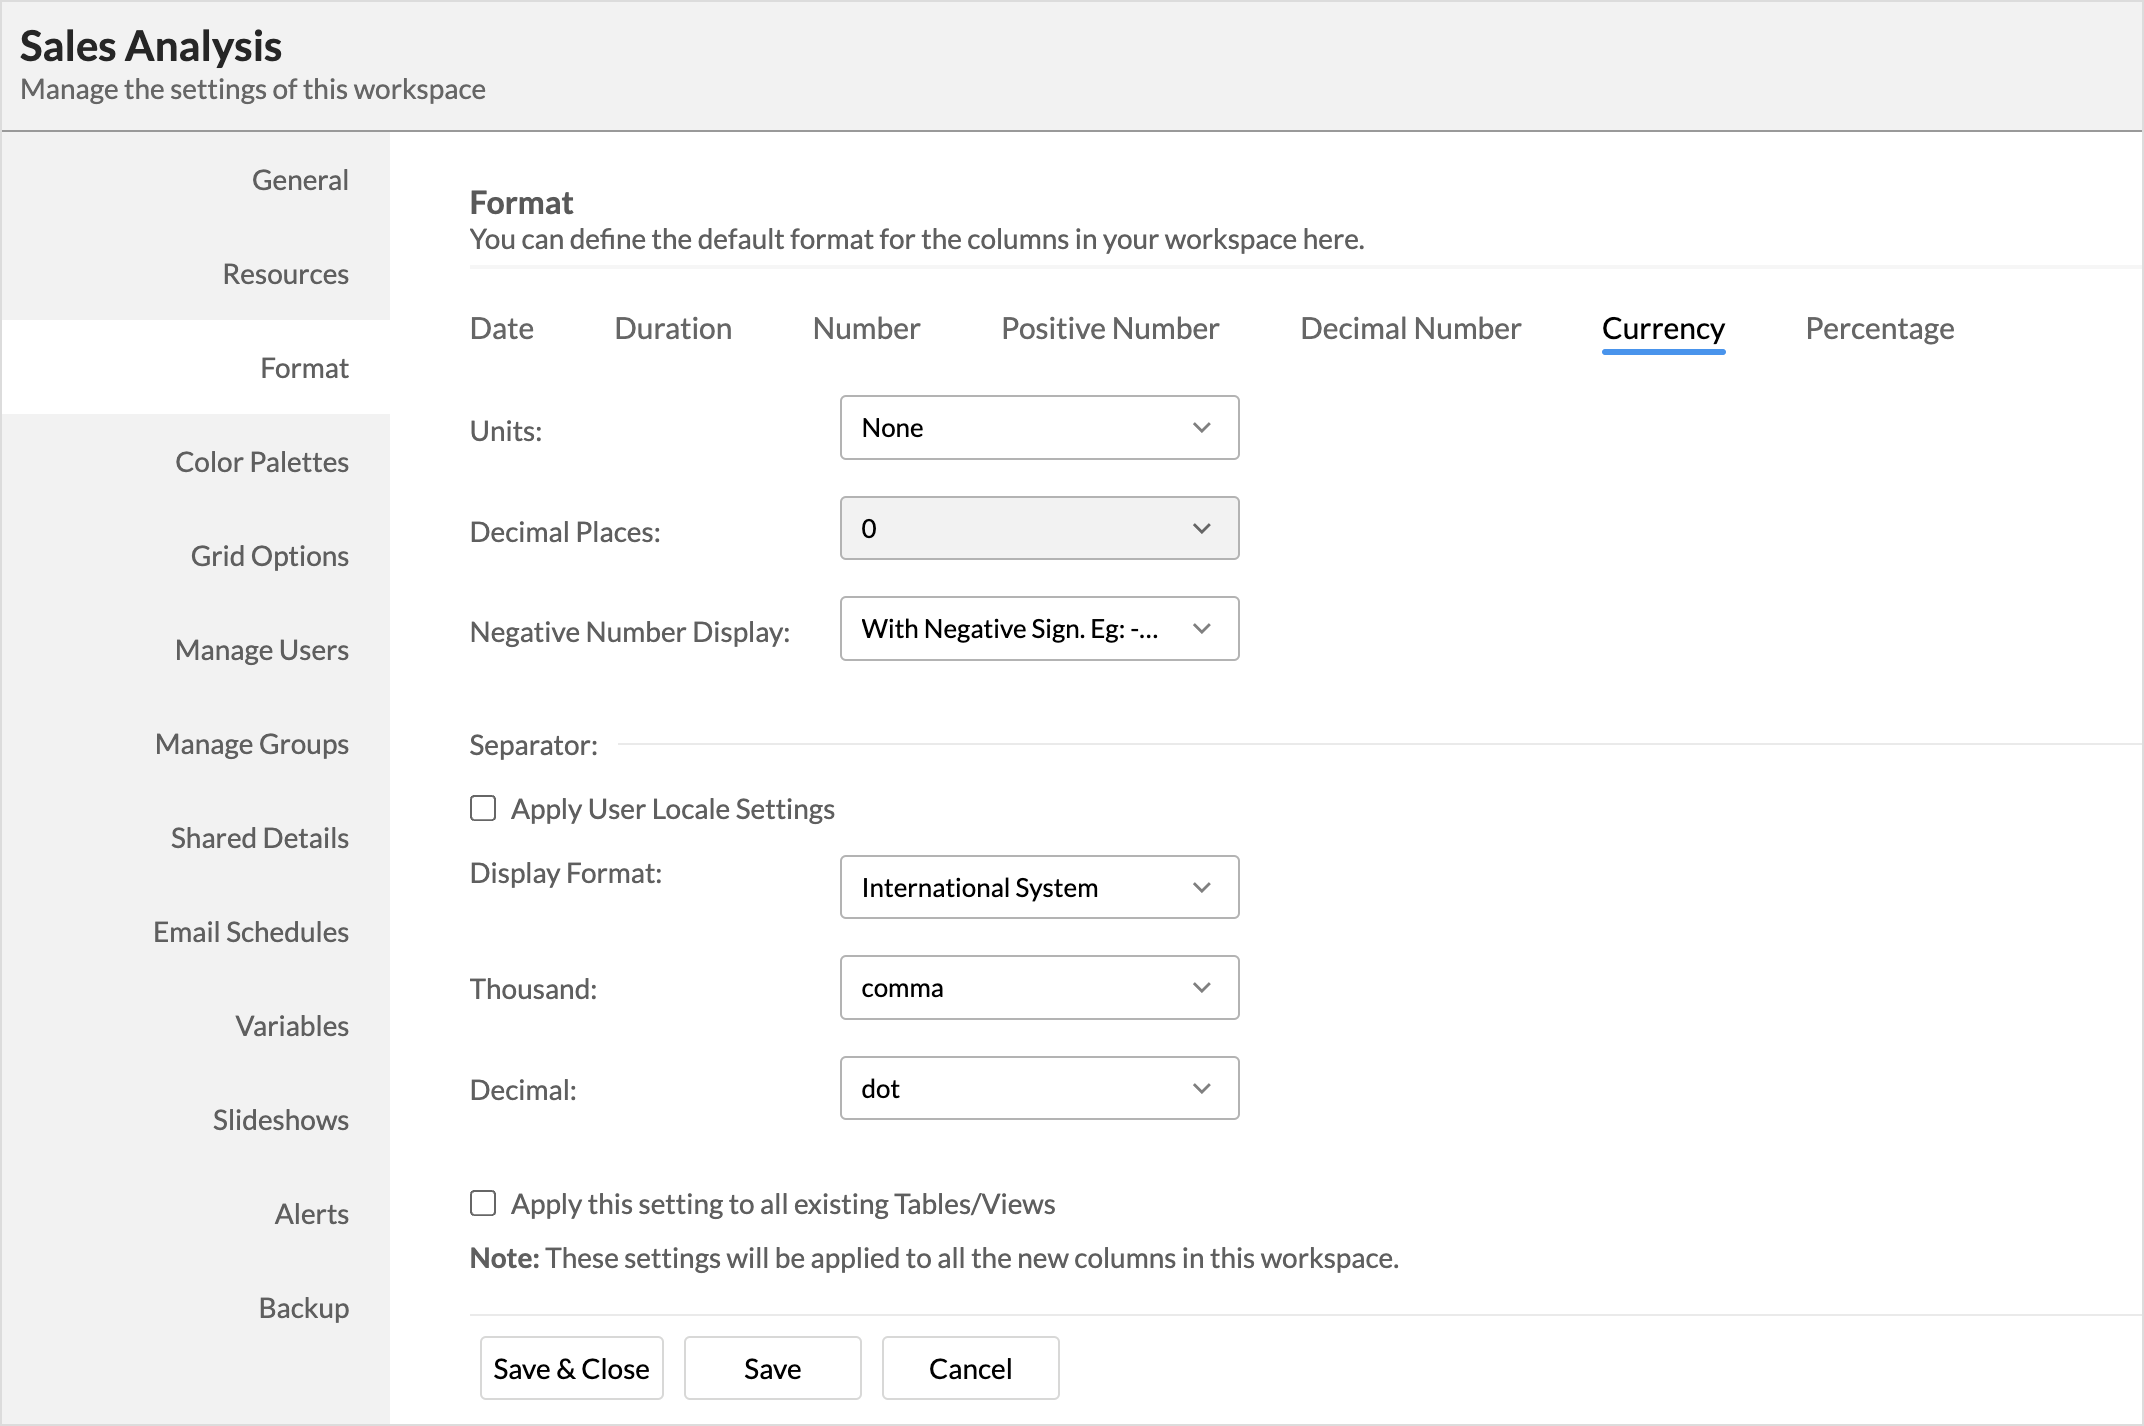
With the latest update, users can easily set and edit the display format of the currency data type columns from the workspace Settings tab. This ensures the maintenance of a unified and consistent format across all reports and dashboards.
Learn more
Data Storytelling - Zia Insights in Zoho Show
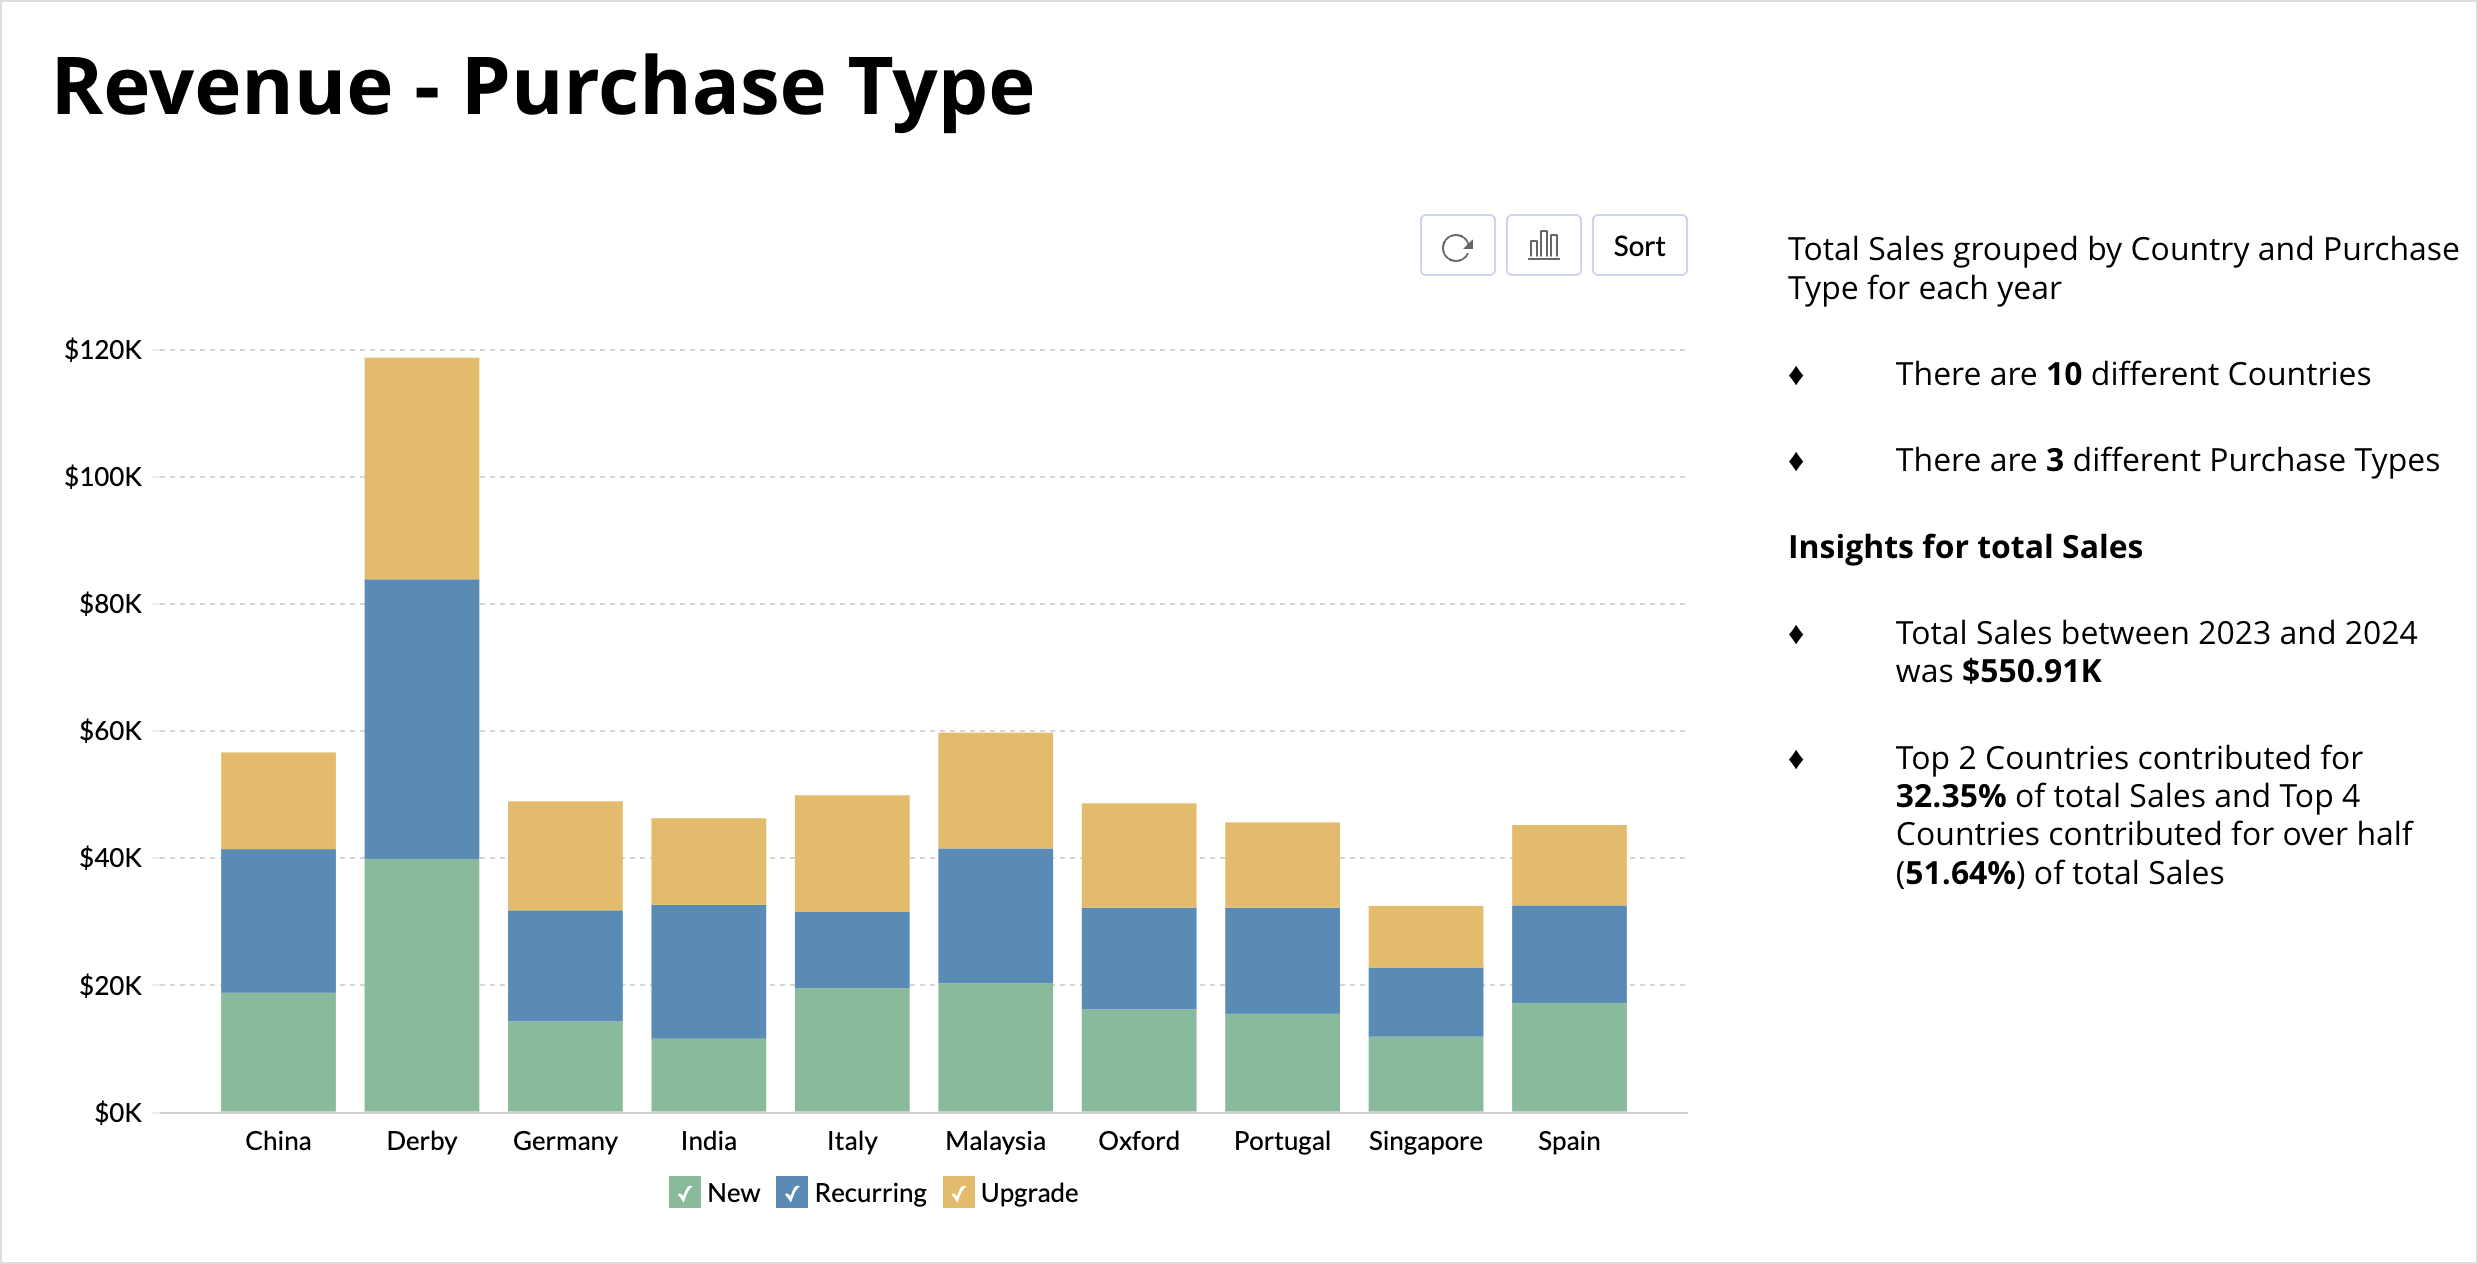
Introducing Zia Insights in Zoho Show! Enrich your presentations with compelling narratives backed by AI with Zia Insights. This option can be enabled while creating an advanced slide show. The generated narratives can also be edited.
Learn more
Introducing JS API
In case you have embedded reports of Zoho Analytics in your intranet, portal, blog, or business app, this new JavaScript API can help improve the user experience. Customize how your users can interact with the visualizations, like applying filters or triggering actions within the embedded environment.
Learn more
Wrap Text in Dashboards
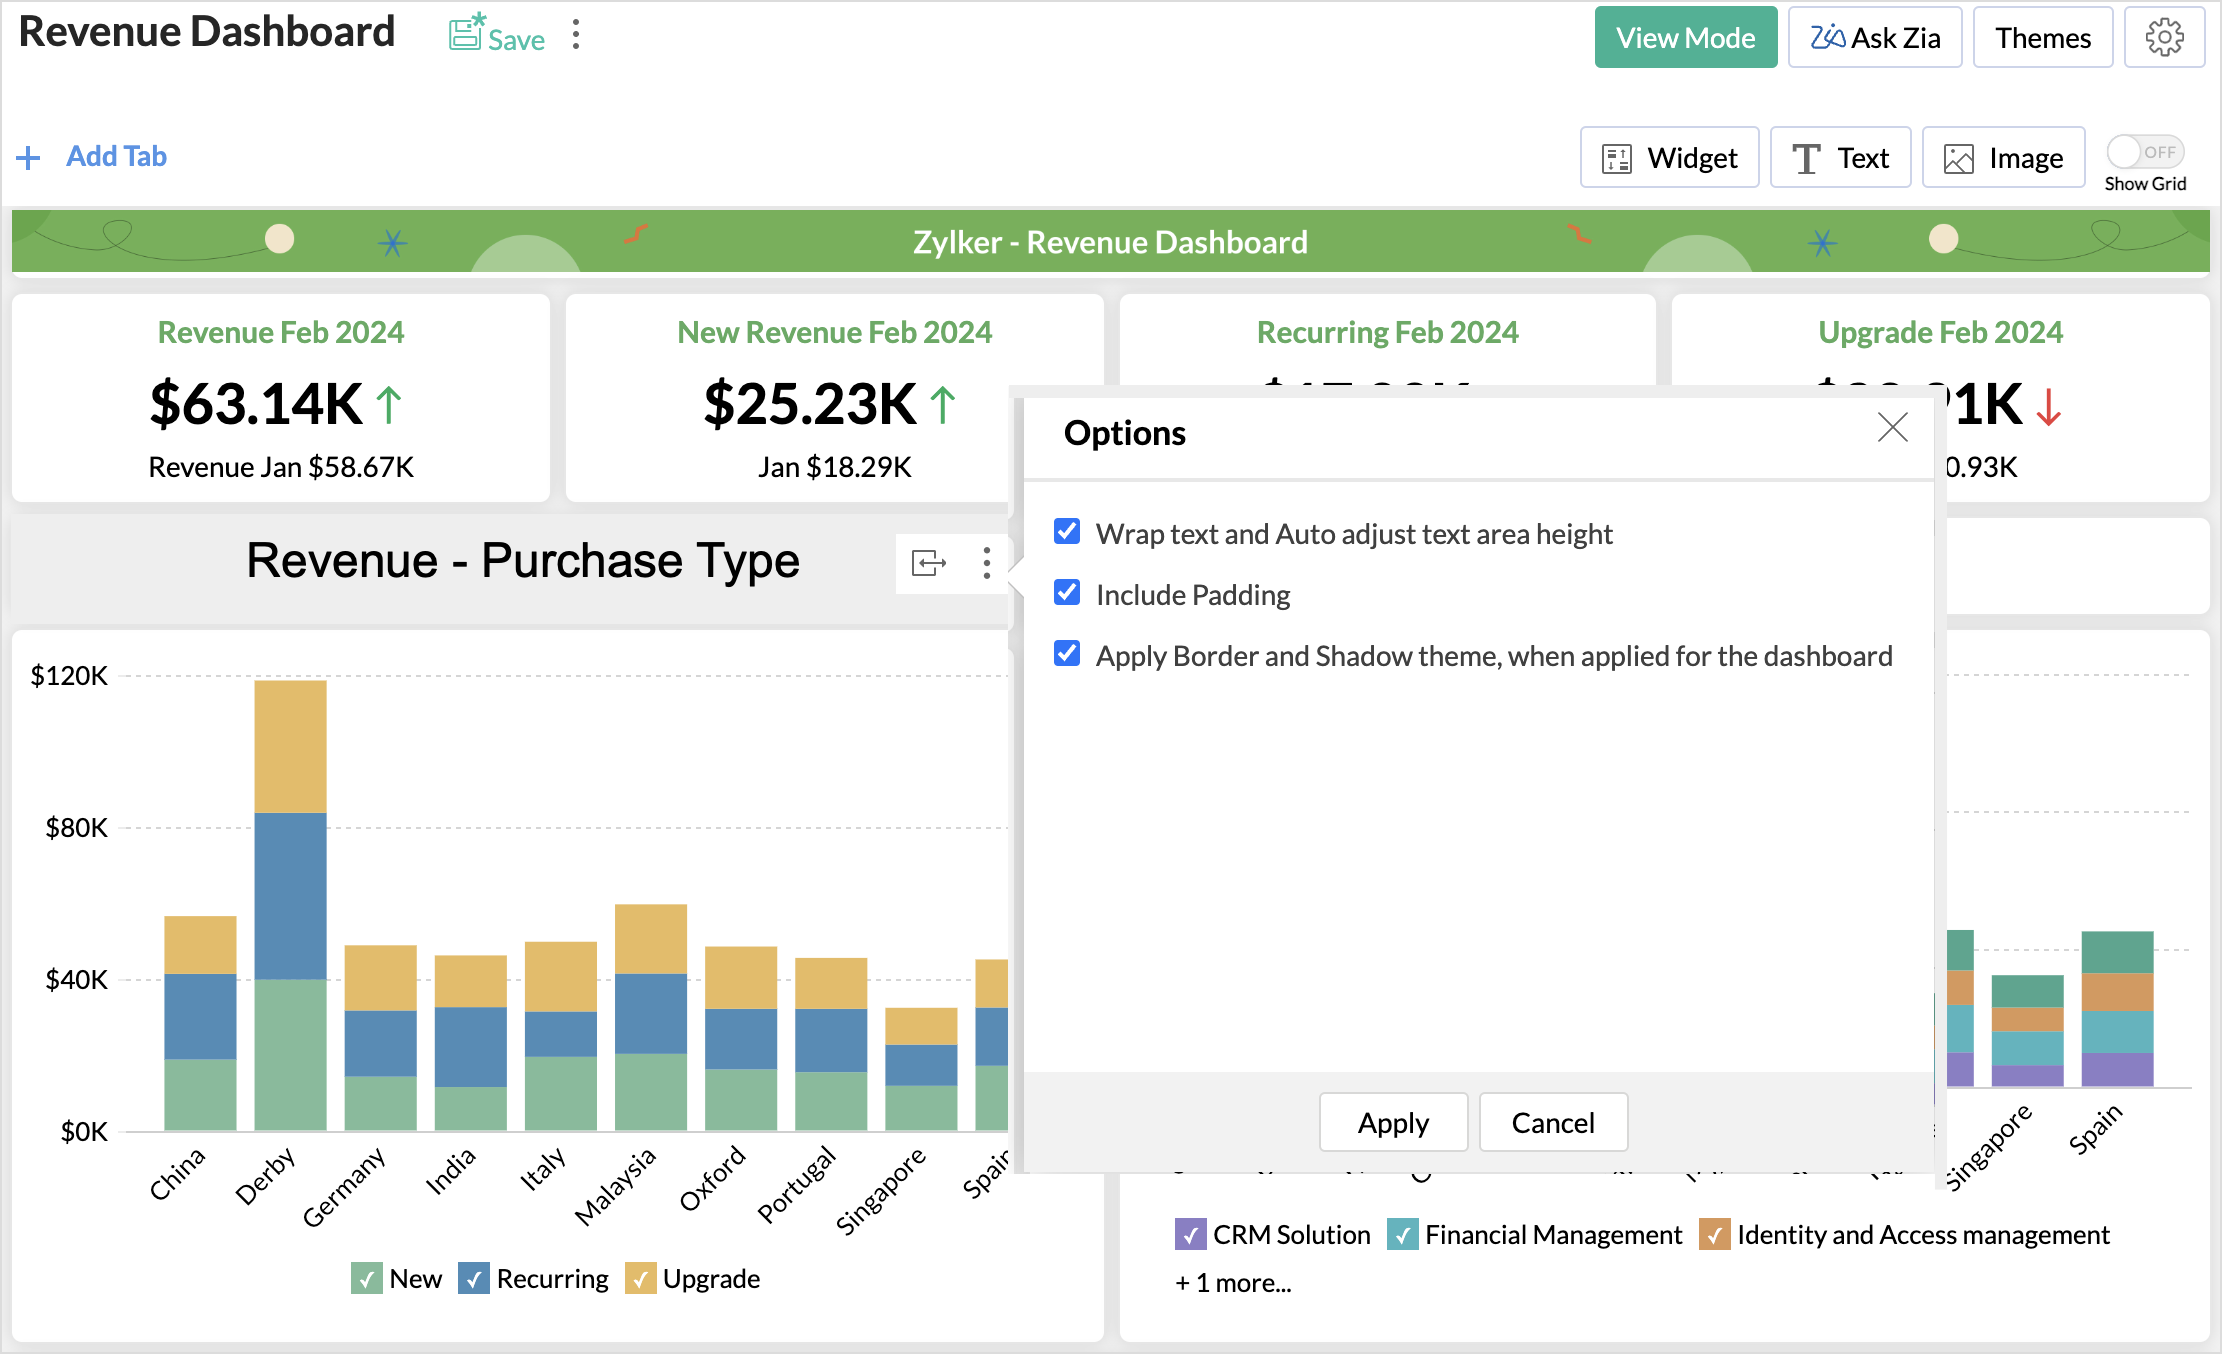
With the recent enhancement to the text element in dashboards, users can enable the wrap text option. This helps improve readability and prevents text from overflowing into adjacent components.
Learn more
New Field Support in Zoho Projects
Users can now sync data from the Comments field of the projects and task modules in Zoho Projects.
Learn more
Feb
26 February, 2024
You can now seamlessly import Pipedrive data into Zoho Analytics to gain enhanced insights. Attain a comprehensive understanding of your business processes, optimize sales strategies with detailed insights, and elevate overall efficiency through this robust integration.
Learn more
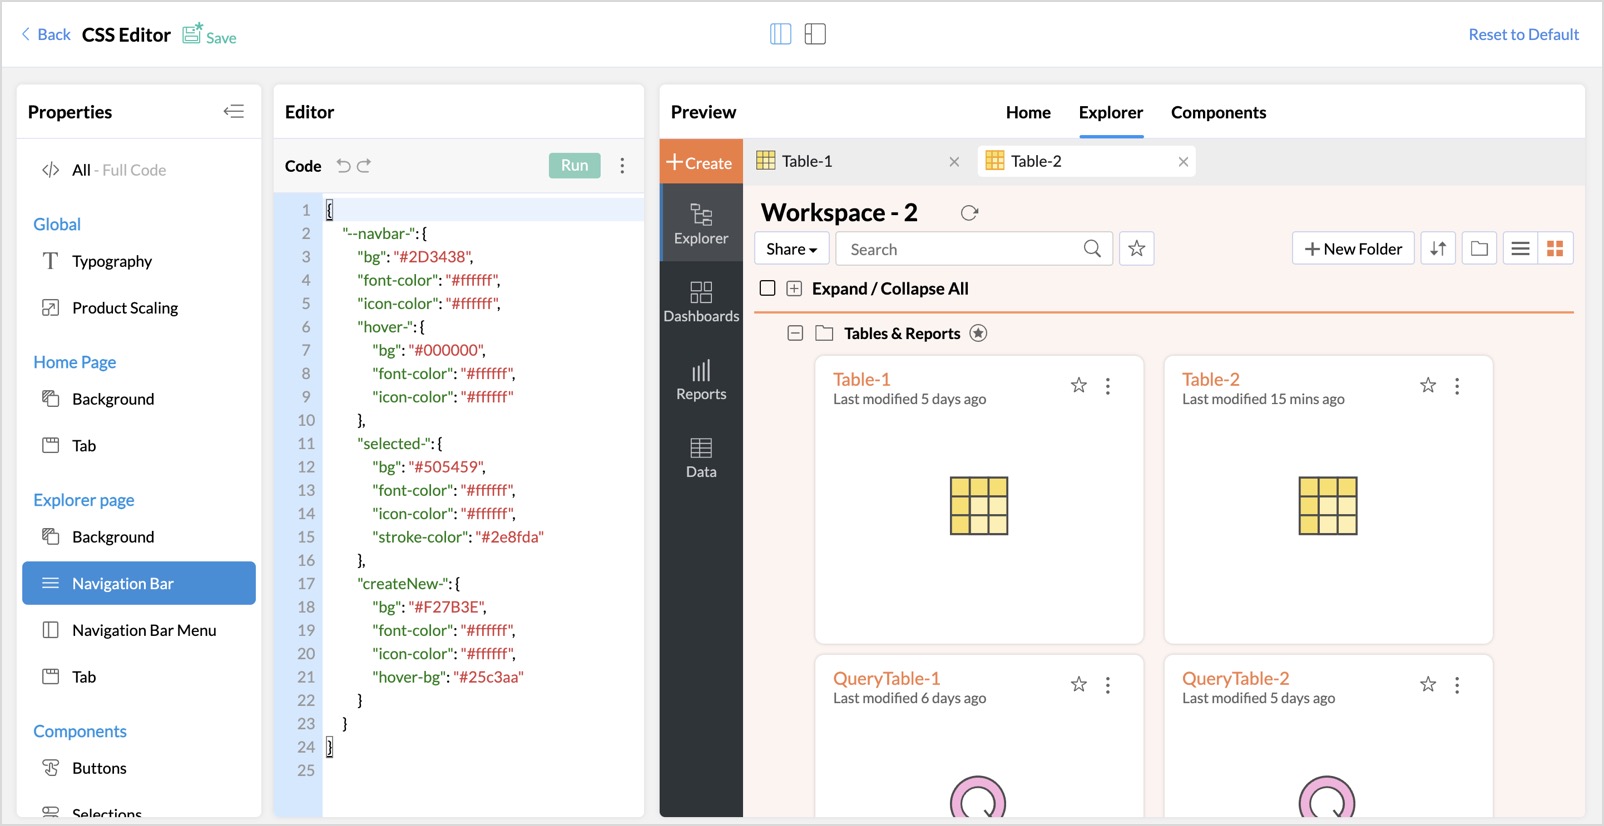
Elevate the visual appeal of your white labeled product and align it with your brand through the CSS customization feature. This latest addition to Zoho Analytics enables you to customize text, colors, and more on pages, tabs, selections, hover options, enhancing the overall look and feel.
Learn more
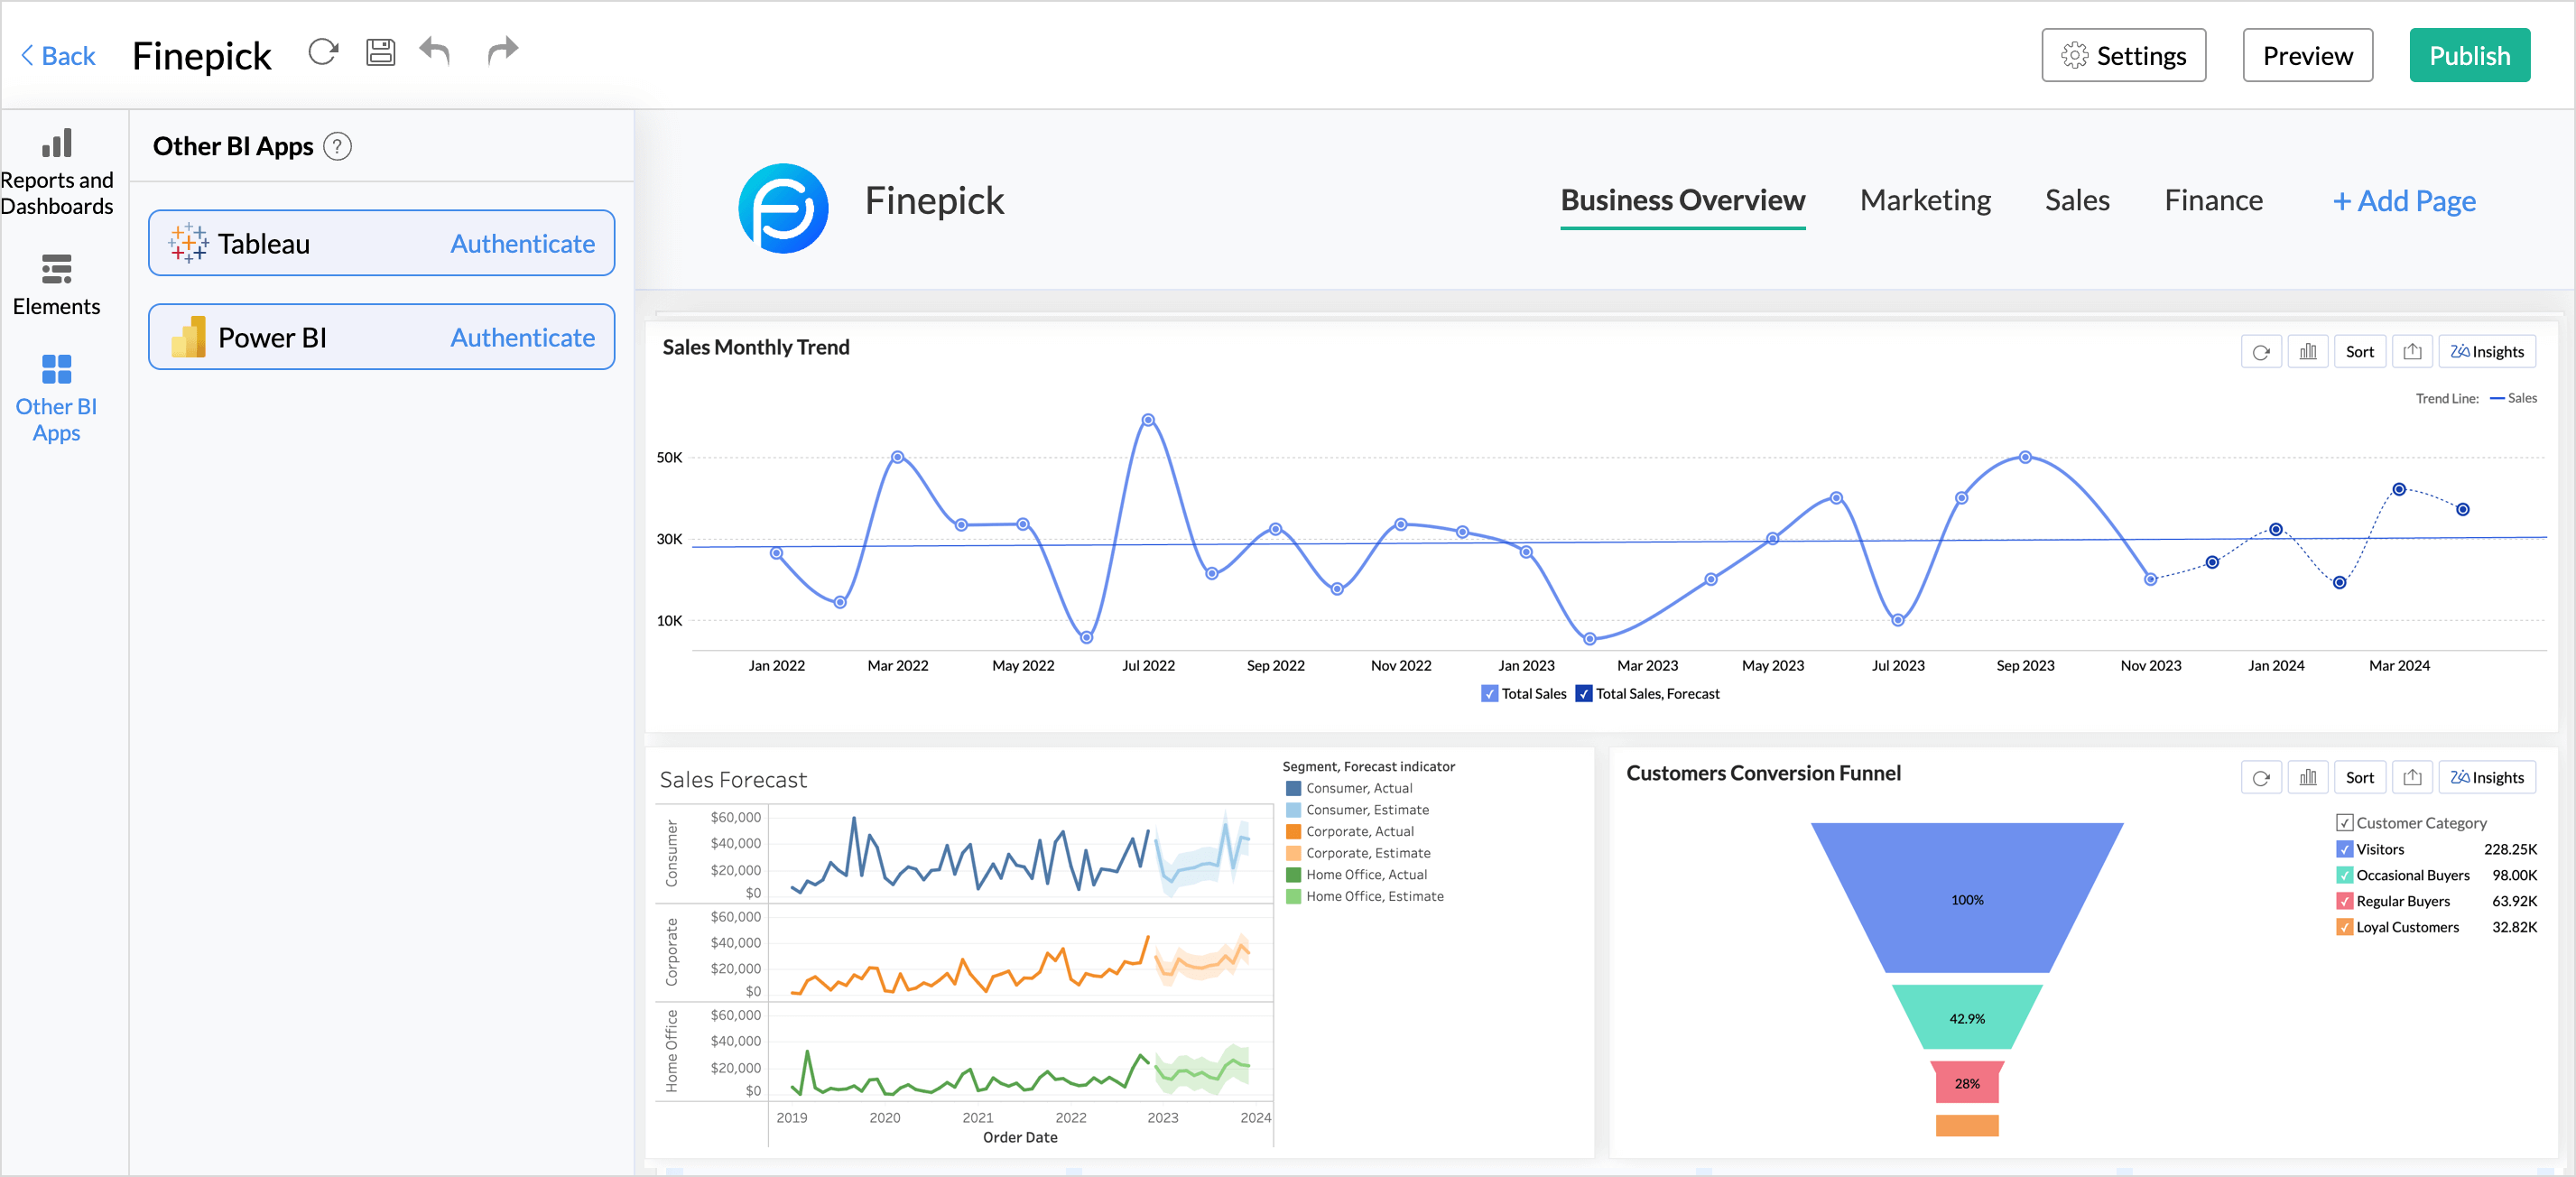
You can now embed Power BI reports to create unified portals for your organization's business needs. Having a unified portal improves collaboration, promotes centralized accessibility, and makes it easy for C-level executives to make robust business decisions.
Learn more
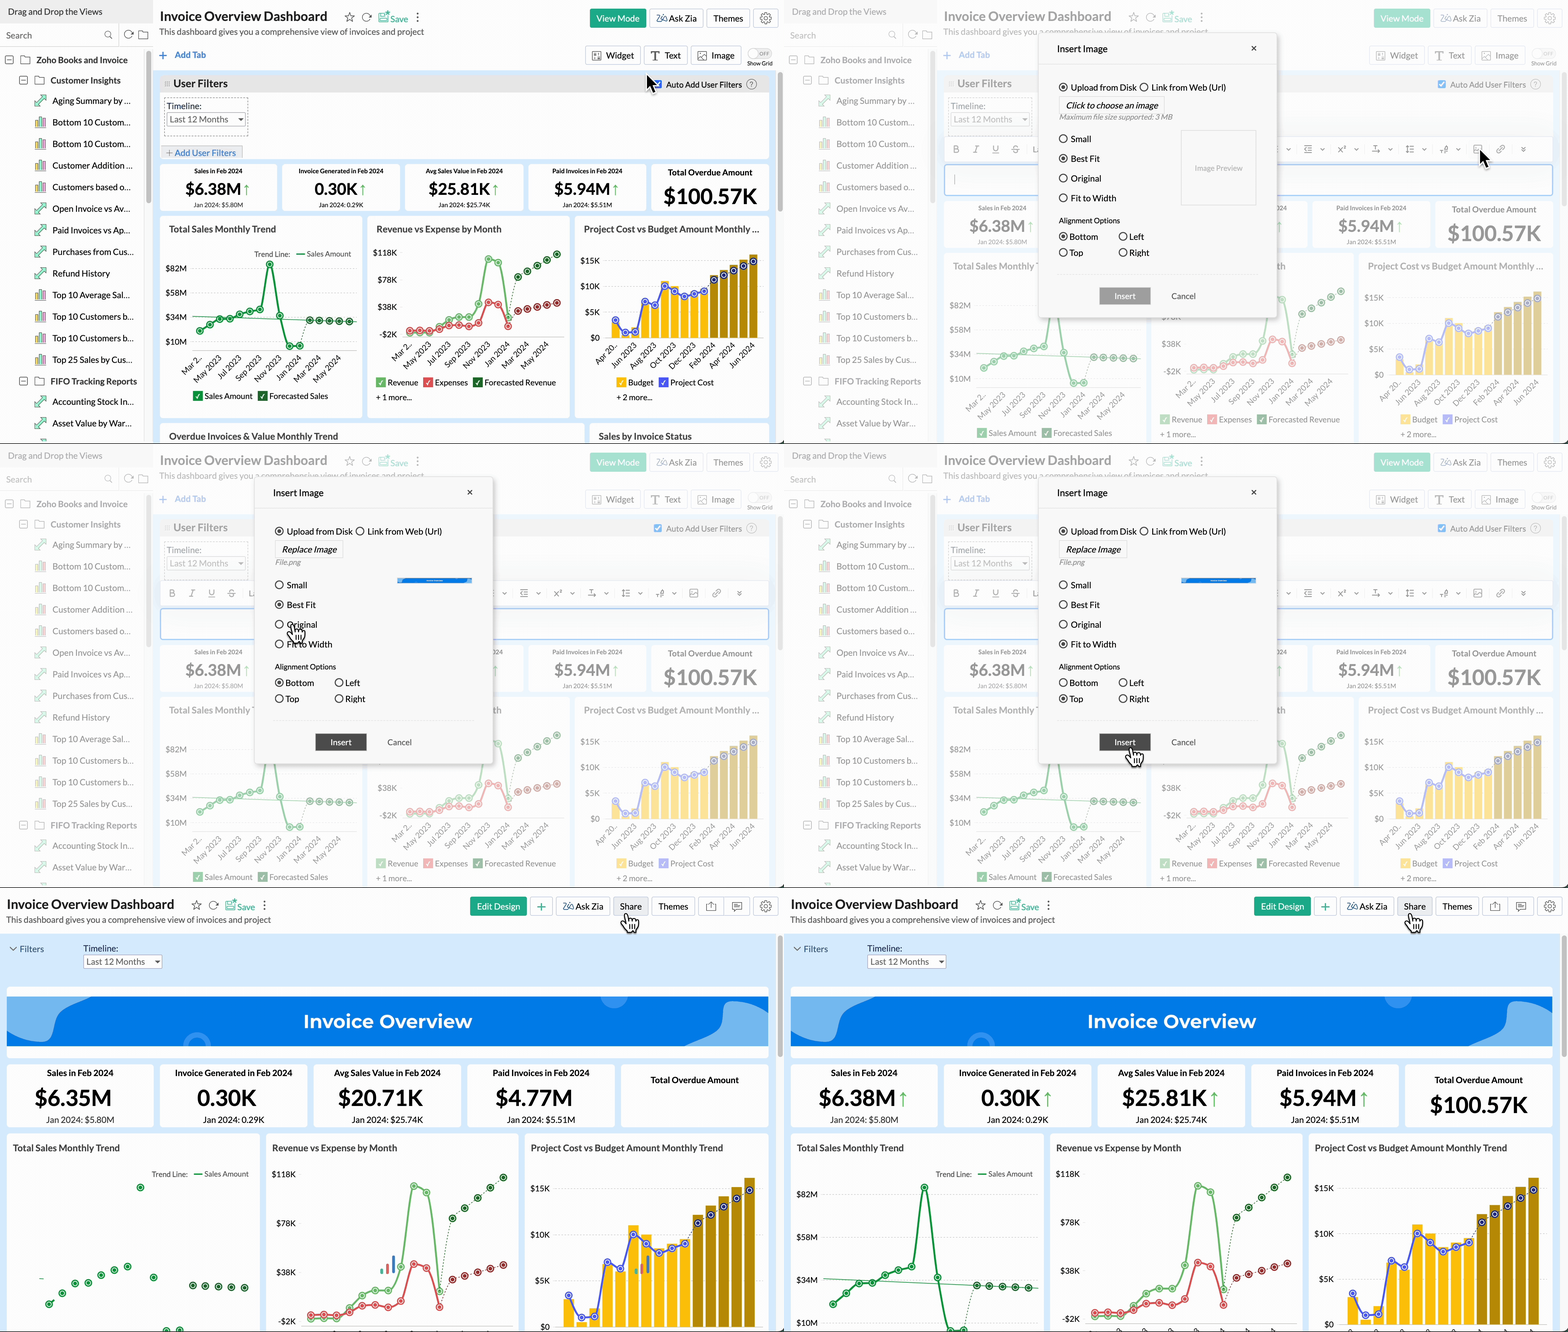
Explore Zoho Analytics' latest enhancement – an exclusive inline text editor within the Dashboard Designer page. Effortlessly add, edit, and format text for a seamless user experience.
Learn more
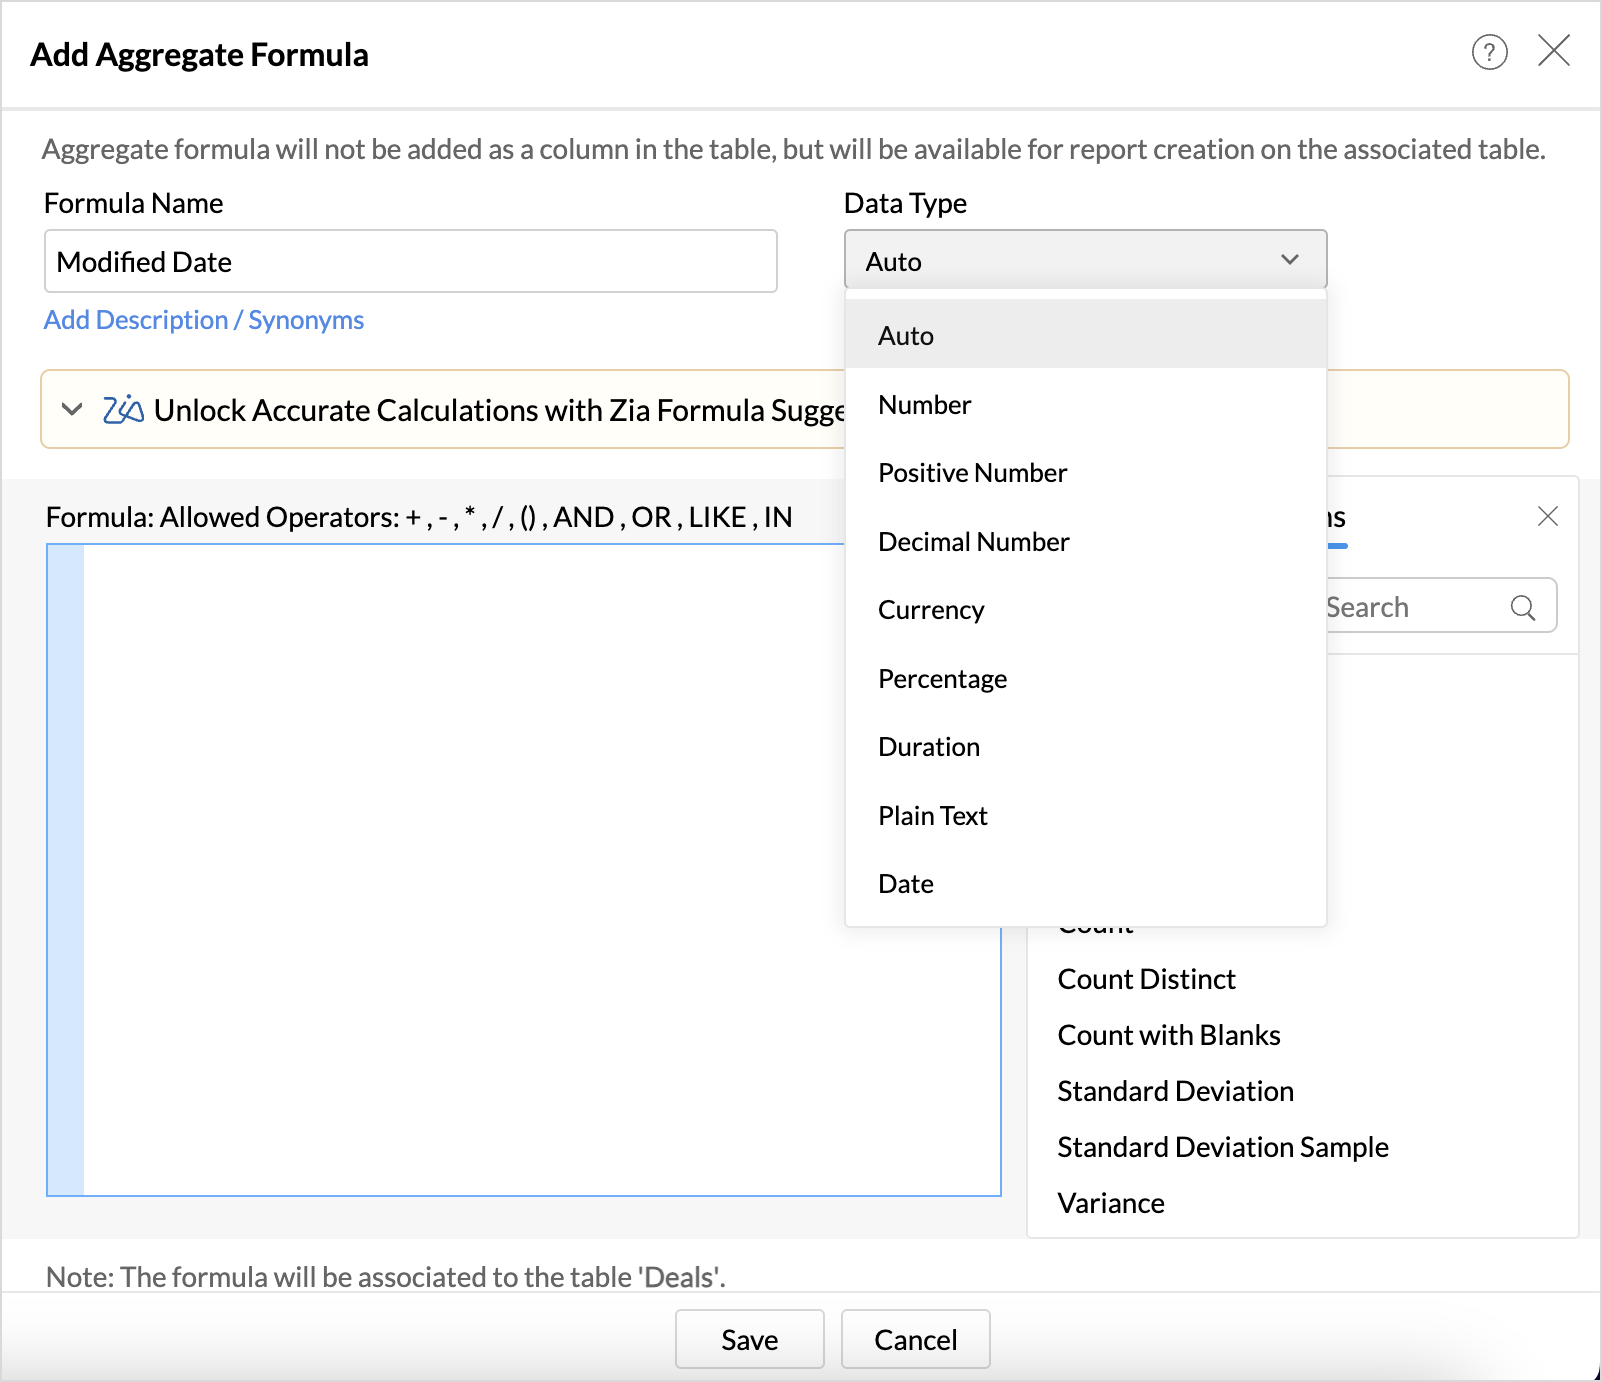
We are excited to announce that Zoho Analytics now supports the date and plain text as return data types in aggregate functions. This improvement proves immensely beneficial in scenarios such as cohort analysis, project milestone tracking, and various other use cases.
Learn more
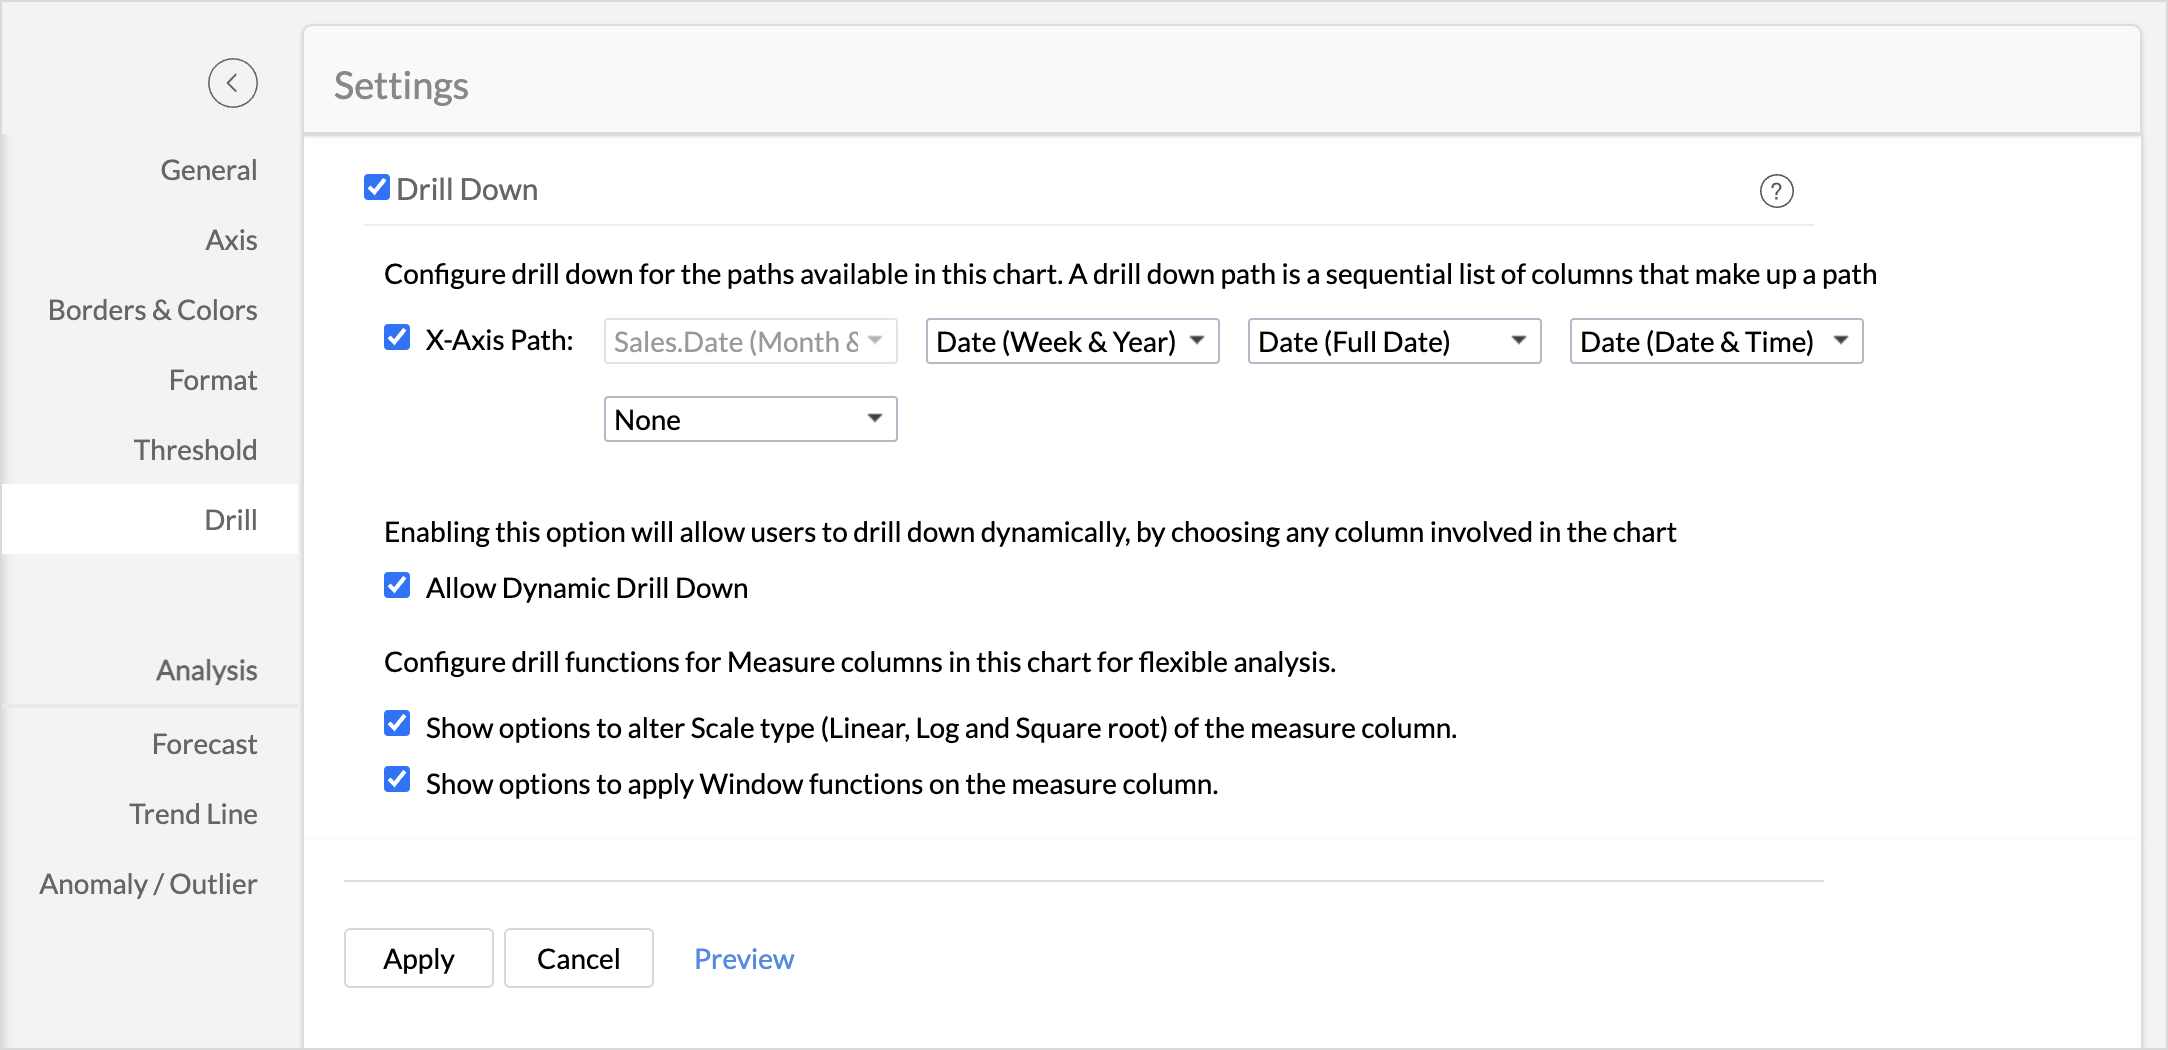
We are excited to announce that Zoho Analytics now allows you to customize the drill functions for the measure columns. You can allow the users to alter the scale type of the report and apply window functions to measure columns.
Learn more
Zoho Analytics now allows you to rename columns in query tables, even if they have dependent views or other query tables over them. Previously, this was permitted only to columns without any dependencies.
Learn more
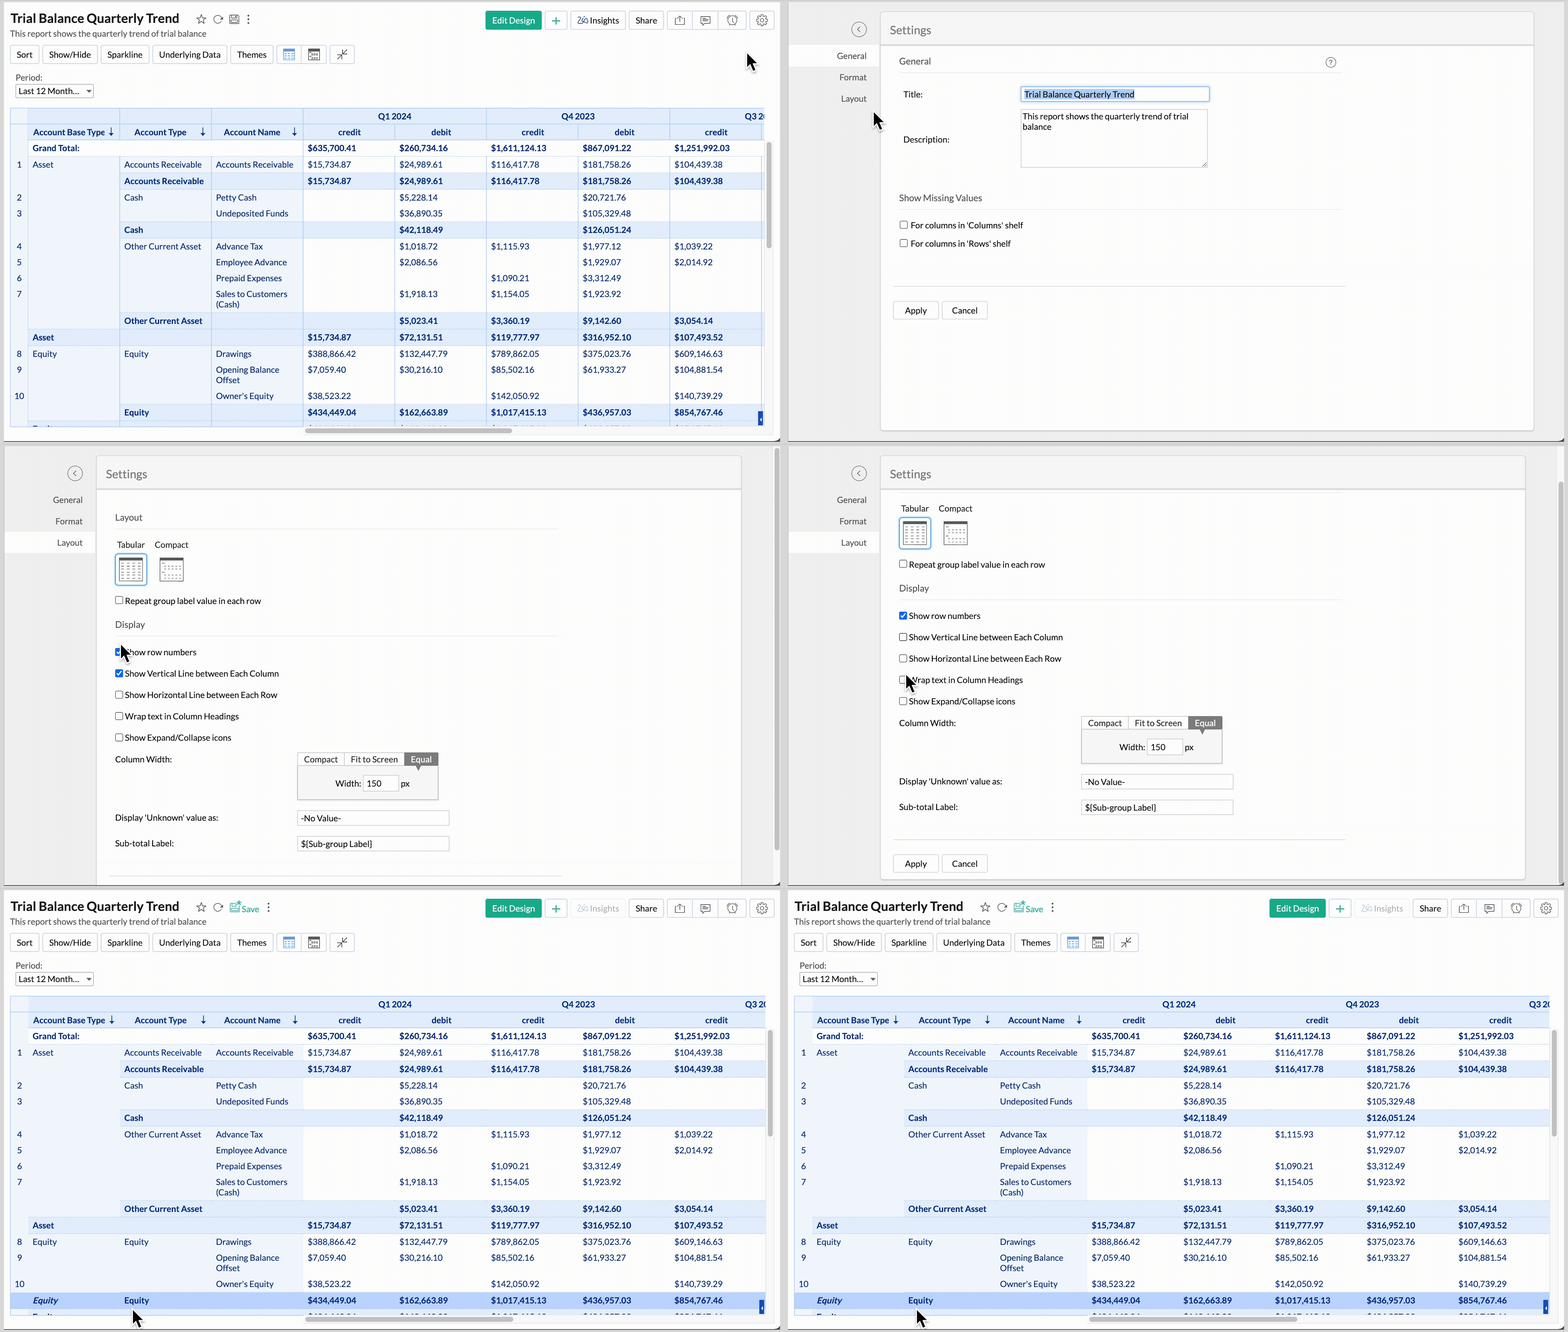
Zoho Analytics introduces vertical line removal in pivot tables, helping to enhance the readability and clarity of reports like financial statements for a more insightful data analysis experience.
Learn more
Jan
25 January, 2024
HyperSQL - Live Connect
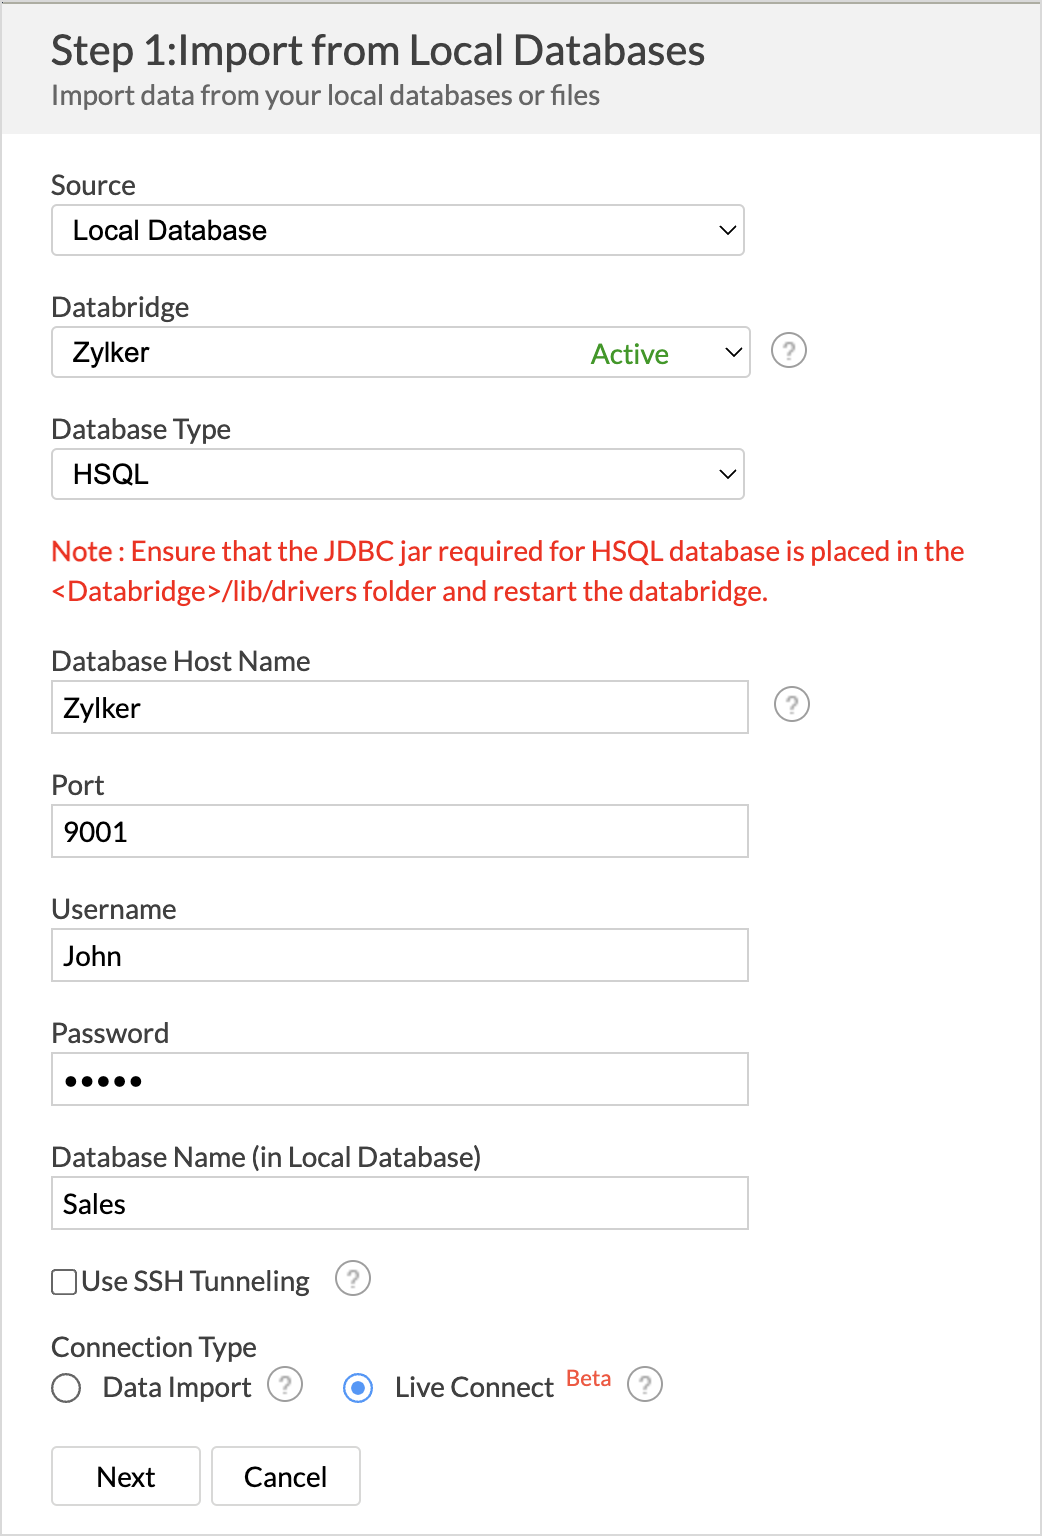
We have enabled Live Connect for the HyperSQL database. Live Connect helps you establish a direct connection with the database for real-time analysis.
Learn more
Dashboards - Auto Merge of User Filters
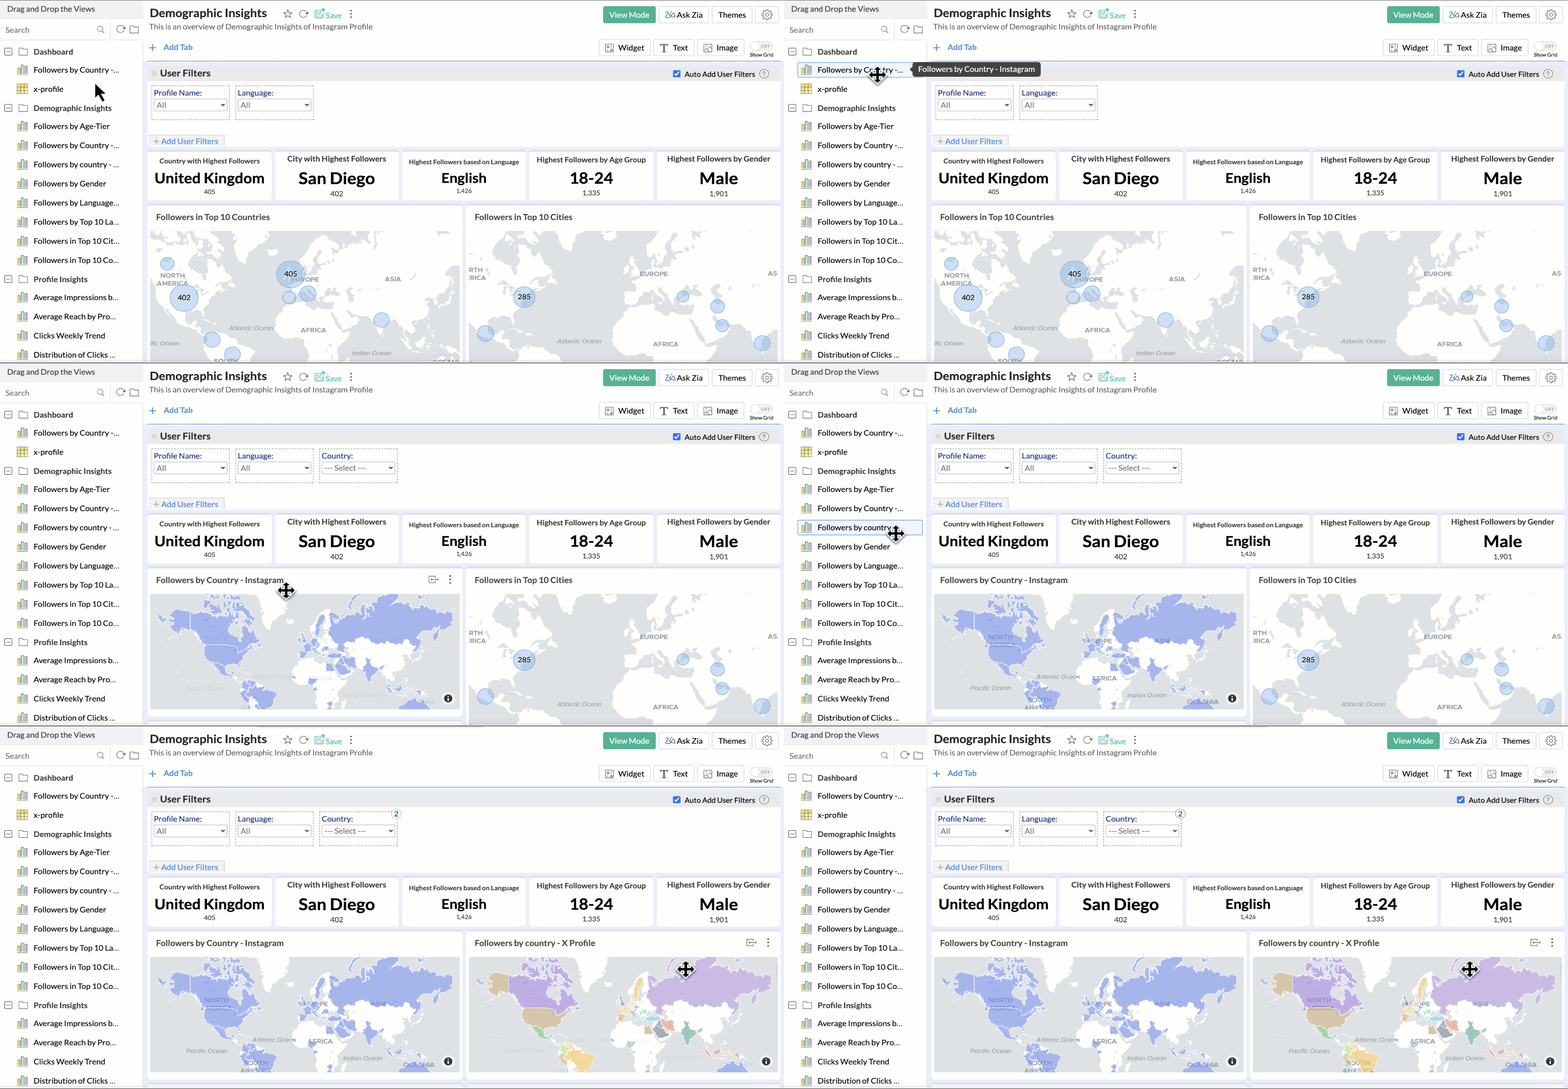
We've made a significant enhancement to the user filters in the dashboard. Previously, users had to drag and drop columns manually onto each other for mapping, but now, when you add a column to the user filter tab, mapping between columns of the same type happens automatically.
Learn more
Charts - Dependent Field Movement
With the recent update, we have removed the restrictions on moving dependent columns while creating reports. You can now freely re-order and rearrange columns as needed.
Learn more
Open AI - Enhancement
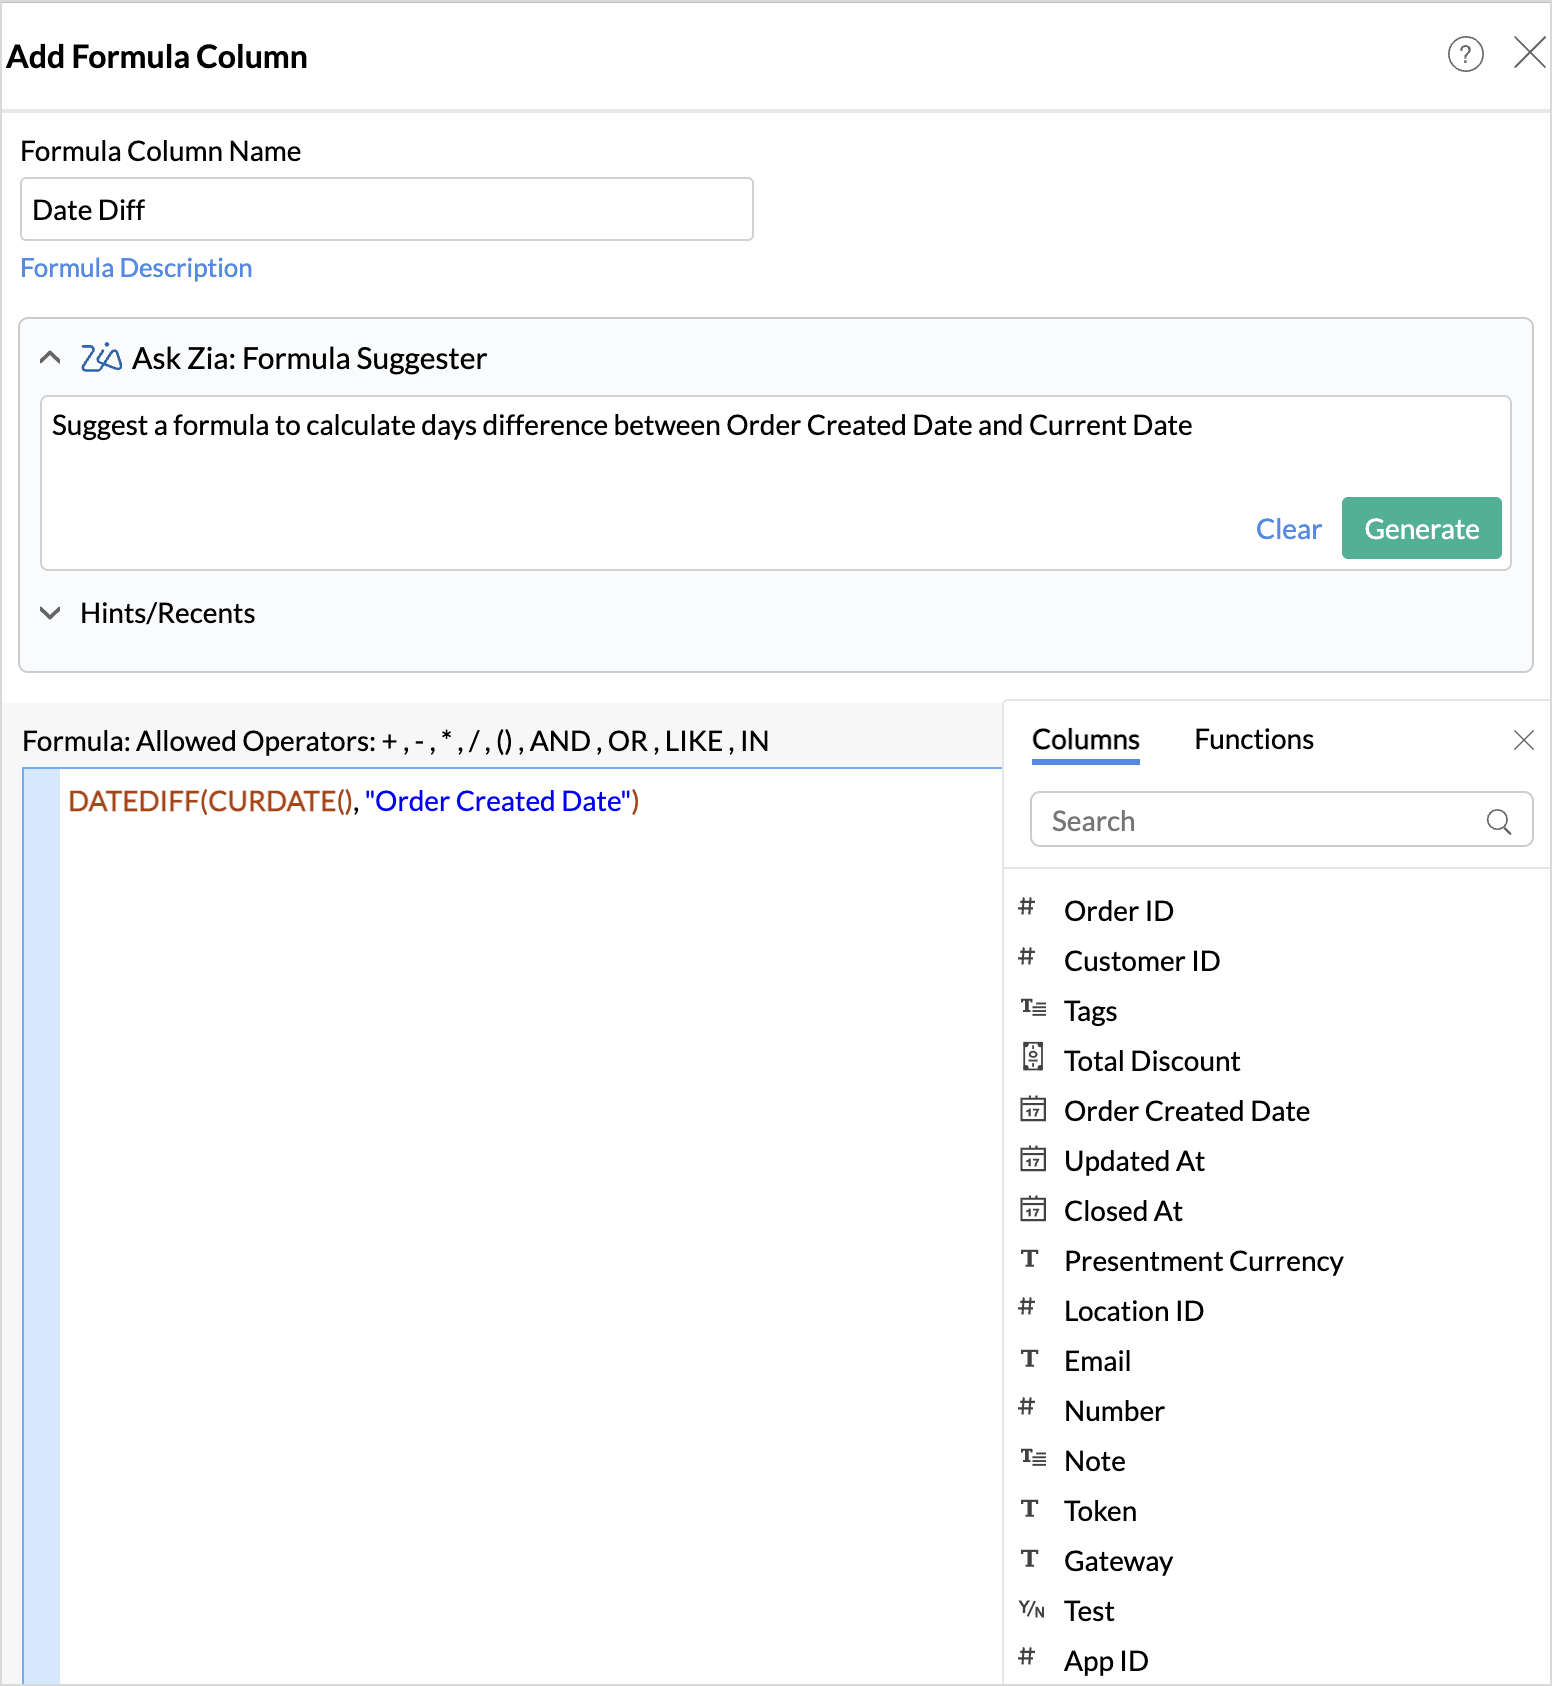
The data model of the table is now shared with Open AI while using Formula Suggester. This helps in getting the most appropriate formulas for the questions asked.
Learn more
Shopify App Analytics
Import and analyze Google Ads and YouTube Ads data with Shopify. Gain a holistic view of your e-commerce business by analyzing the effectiveness of your advertisements, campaigns, and make informed decisions to optimize your online business strategies.


