Constructing Questions for Ask Zia
Ask Zia simplifies data interpretation by enabling users to analyze data using natural language. It eliminates the need to build complex reports manually or configure multiple groupings. Users can ask questions in natural language to analyze their data, ranging from descriptive analysis to predictive analysis. It can also highlight key drivers and explain why certain trends or results occurred, helping users quickly move from data to understanding.
- Who can Use Ask Zia - Access and Permissions
- Context Retention
- Level of Detail in Queries
- Best Practices for Using Ask Zia
- Descriptive Analysis
- Diagnostic Analysis
- Predictive Analysis
- Keywords for Ask Zia
Who can Use Ask Zia - Access and Permissions
Users with Administrator privileges, Shared users and Custom roles users, can interact with Ask Zia and perform conversational analysis on their data, subject to the data access permissions defined for their role.
Context Retention
Ask Zia maintains context throughout a conversation, understanding each query in relation to previous questions. This allows users to ask follow-up questions naturally without repeating the metrics or filters while continuing the conversation.
- Real-time type-ahead assistance suggests relevant fields such as columns, dimensions, measures, and functions, and may also recommend suitable visualizations or existing reports related to the query.
- Context-aware follow-up suggestions: During a conversation, Ask Zia analyzes the current query and proposes logical next steps, such as additional metrics, filters, or related analytical questions to refine the analysis.
- Proactive query recommendations: As users begin interacting with Ask Zia, it suggests relevant analytical questions by analyzing the data model, previous user interactions, and commonly used query patterns.
Level of Detail in Queries
The level of detail in a query determines how Ask Zia interprets the request and generates the resulting visualization. A query includes components such as metrics, dimensions, filters, aggregations, and geographic attributes. The combination of these elements defines the scope and granularity of the analysis.
By progressively adding these elements, users can move from a high-level overview to more focused and detailed insights. This flexible query structure allows Ask Zia to support both quick summaries and deeper exploratory analysis through natural language queries.
- Metrics and Dimensions: Metrics represent the quantitative values being analyzed, such as revenue, sales, profit, or count of records. Dimensions provide context by grouping these metrics across categories like product, region, time period, or salesperson. Combining metrics with one or more dimensions enables users to compare performance across categories, identify patterns, and analyze variations within the data.
- Filters and Conditions: Filters allow users to restrict the dataset to specific criteria or time periods. Queries can include filters based on text values, numeric ranges, exact dates, date ranges, or relative time periods.Applying filters helps narrow the analysis to relevant subsets of data, making it easier to focus on specific segments or conditions.
- Geographic Analysis: Geographic attributes such as country, state, region, or city can be included in queries to analyze data by location. When geographic fields are used, Ask Zia automatically generates map-based visualizations to display regional distribution and spatial trends in the data.
- Aggregations and Summary Functions: Aggregation enables users to summarize data using functions such as sum, average, count, minimum, and maximum. These functions help compute summary statistics and evaluate overall performance of a metric.
Ask Zia automatically interprets aggregation terms expressed in natural language and applies the appropriate calculation to the selected metric, allowing users to analyze summarized results without manually defining calculations.
Best Practices for Using Ask Zia
- Start with simple queries: Begin with a high-level question and progressively refine it with follow-up queries to explore the data further.
- Use clear metric and dimension names: Use terms that closely match the column names in your dataset so Ask Zia can interpret the query accurately.
- Include relevant filters: Apply filters such as time periods, categories, or conditions to narrow the analysis to the most relevant data.
- Group metrics by dimensions: Analyze metrics across one or more dimensions to compare performance across categories or segments.
- Leverage follow-up queries: Use conversational context to refine the analysis without repeating the entire question.
- Specify time periods for trend analysis: Include time context such as months, quarters, or years when analyzing trends or performance over time.
- Gradually increase query detail: Add dimensions, filters, or sorting progressively to move from high-level summaries to deeper insights.
Descriptive Analysis
Descriptive analysis focuses on understanding What has happened with the data. This includes summarizing metrics, comparing and identifying patterns. This is used to jump start data exploration.
Overall Performance
Provides a high-level summary of key business metrics such as total sales, revenue, or number of orders. It helps quickly understand the overall performance of the business during a specific period.
What is the total sales for Jan 2026

Category or Segment-wise Analysis
Analyzes performance across different segments such as region, product category, or customer group. This helps identify which segments contribute the most to sales.
Show me the total sales by Region and Product Category

Rank and Top Performers
Identifies entities with the highest or lowest values for a given metric, allowing to understand relative performance across different categories.
top 10 Product by Sales

Time-based Analysis
Examines how metrics change across different time periods such as days, months, or quarters. This helps track performance at specific points in time.
Show monthly revenue for the last year
Correlation between Metrics
Correlation helps find if and how strongly two measures are related to each other. If a measure or variable increases or decreases together, they are positively correlated. If one measure tends to increase and another one decreases, then they are negatively correlated. Zia computes the correlation using Pearson's Correlation Coefficient, which is the covariance of the two variables to the product of their standard deviations.
Region wise correlation between Sales & Cost

Trend Strength in the Data
Trend strength is a statistical measure used to determine how strongly data is moving in an upward or downward direction. It helps assess whether a trend is likely to continue or weaken.

Breakdown Analysis
Breaks down a metric into multiple hierarchical levels for deeper insights. For example, analyzing sales by region, then by category, and then by product.
Temporal Analysis
Examines how a metric changes across time periods. It helps identify trends, recurring seasonal patterns, and shifts in performance by comparing values over continuous or discrete time intervals.
Show the revenue trend for the last two years
Diagnostic Analysis
Diagnostic Analysis focuses on understanding why something happened in the data. It goes beyond simply describing results and probes the root causes, relationships, and contributing factors behind an outcome.
Diagnostic analysis can be performed in different ways depending on what you want to investigate. It focuses on identifying the factors responsible for a change or pattern in the data. Diagnosis can be based on:
- Increase or decrease analysis: Examining why a metric such as sales, revenue, or user activity has increased or decreased over a specific period.
- Segment-based diagnosis: Analyzing performance across different segments such as region, product category, customer group, or sales representative to identify which segment contributed to the change.
- Behavior-based diagnosis: Understanding patterns in user or customer behavior, such as purchasing trends, churn patterns, or engagement changes, to determine what influenced the outcome.
Predictive Analysis
Predictive analysis focuses on estimating future outcomes and identifying unusual patterns based on historical data. By analyzing past trends and patterns, Ask Zia can generate forecasts and detect anomalies that help users anticipate changes in performance and identify unexpected behavior in their data.
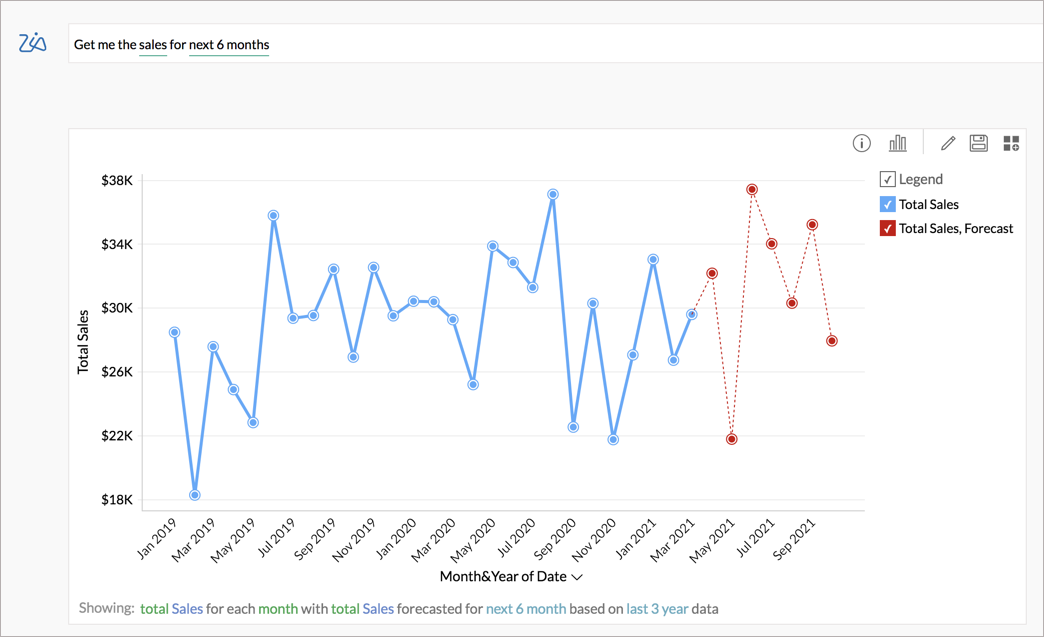
Forecast
You can forecast the data by simply asking for the future data. The following example will predict how the future sales for the next 6 months that will most likely be.
Get me the sales for next 6 months
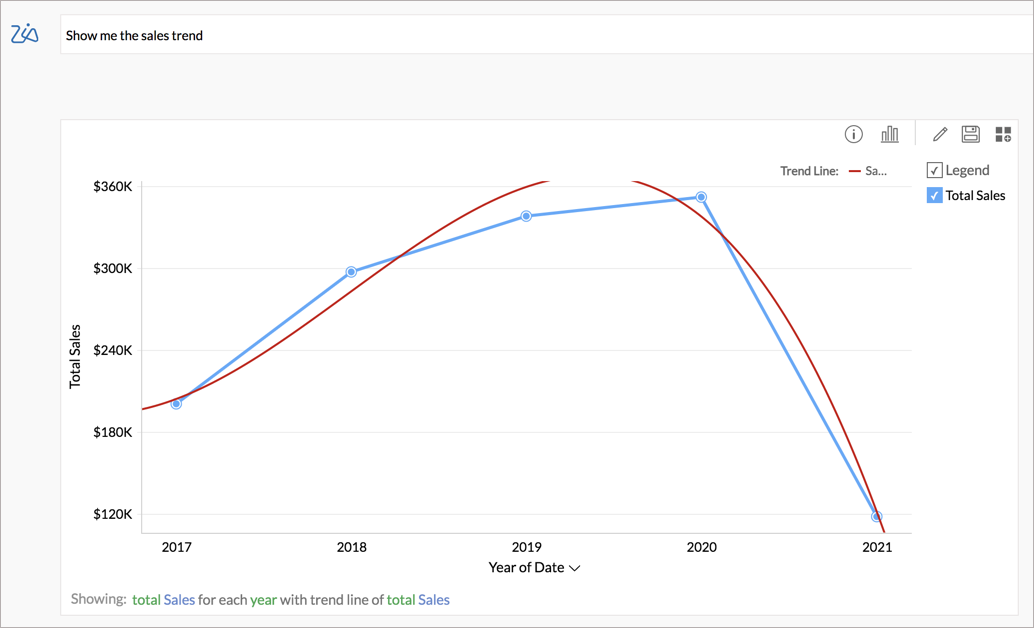
Trend Line
Trend analysis helps understand how a metric changes over time. By evaluating historical values across a selected time dimension, Ask Zia identifies patterns such as growth, decline, or seasonal fluctuations, enabling users to track the overall direction of performance.
Show me the Sales Trend
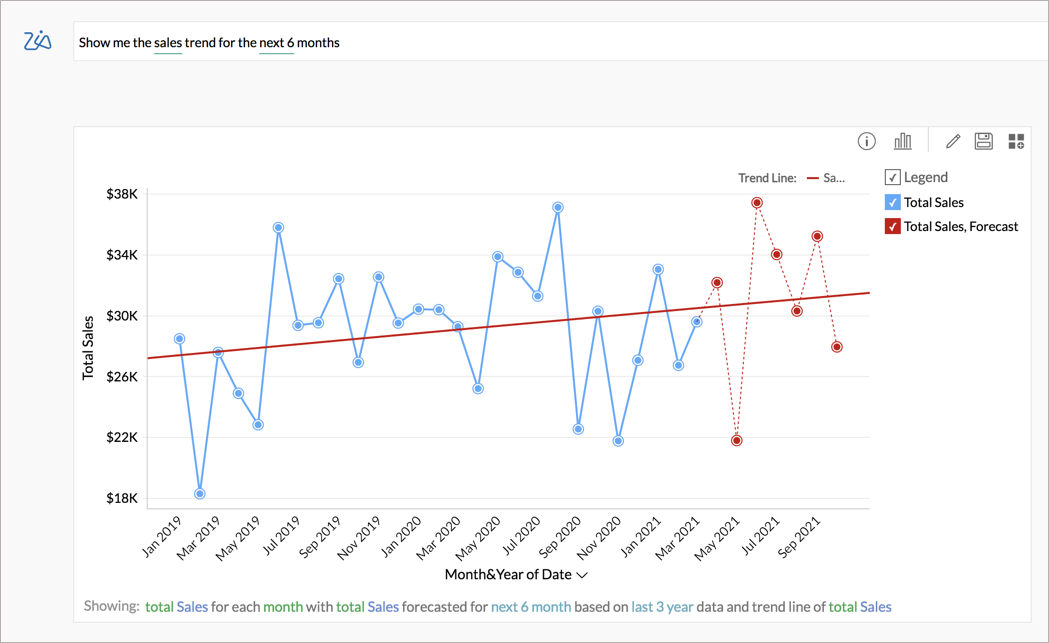
Forecasting Trend
Ask Zia can add both forecasting and trendline to you chart. The following question forecast the sales for the next 6 months and also predict the sales trend.
Show me the Sales Trend for next 6 months
Keywords for Ask Zia
The following is the list of keywords that Ask Zia can interpret and create appropriate insights.
Summary Options | |
| Functions | Keywords |
| Summary | sum, total, tot |
| Minimum | minimum, min |
| Maximum | maximum, max, highest, high |
| Count | count, number, no, total number, distinct count, unique, unique count |
| Others | standard deviation, std dev, variance |
Advanced Summary Options | |
| Functions | Keywords |
| Running Total | running total, running tot., running sum |
| Percentage of | percentage, total percentage, %, percent, percentage of total, total %, % of total, pct of total, % of sum, sum percentage, sum pct, contribution, contribution of total |
| Difference From | difference, difference from, diff, growth |
| % of Difference From | % of difference, pct of difference, difference %, % diff, difference percentage, difference in percentage, |
| % of Previous Value | percentage of previous, % of previous, pct of previous, prev %, previous value % |
Group by Options | |
| Functions | Keywords |
| Numeric | actual, range, as range, dimension, as dimension |
| Date-Actual | year, yearly, year over year, yoy, absyear quarter, quarterly, quarter over quarter, qoq, absquarter month, monthly, month over month, mom, month and year, absmonth week, weekly, week over week, wow, week and year, absweek day, daily, day over day, absday date, hour, hourly, minute, second |
| Date-Seasonal | seasonal day, seasonal month, seasonal year, seasonal week, seasonal quarter |
Filtering Options | |
| Functions | Keywords |
| Numeric | >, >=, greater than, above, over, beyond, higher than, more than, exceeds <, <=, lesser than, lower, lower than, less than, below, under equal to, equals to, equals, =, between |
| Units and Currency | thousands, k, millions, m, mn, billions, b, bn, Lakhs, L, Crores, C, Rupees, RS, ₹, Dollars, $ |
| By Range | top 10, top few, top, top most, highest, best bottom 10, bottom few, bottom, lowest, worst |
| Text | starts with, starts with, ends with, contains, is |
| Date-Actual | 2018, 2019, Q1 2019, Q4 of 2018, quarter 1 of 2019 January 2019, Jan 2019, 1/2019 15th october , 30 july, nineth july 2017, third may 2016, 2 feb 2001, 2019 mar 4, 17/feb, twenty six october |
| Date-Seasonal | June, may, jul, oct, Sunday, saturday, thurs, tue 1st quarter, 2nd quarter, second quarter, third quarter, fourth quarter, first quarter, quarter 4, quarter1 |
| Date-Relative | this year, previous year, last year, past year, recent year, previous 3 years, next 3 years, last 3 year, recent 3 years, last nine years, previous few years, recent few years, past few years, recent few decades, previous few decades, past few decades, next few decades, last few years, last decade, recent decade this quarter, previous quarter, last quarter, this quarter, recent quarter, previous 9 quarters, last 9 quarters, next 9 quarters, recent 5 quarters, previous five quarters, last three quarters, recent few quarters, next few quarters, previous few quarters, past few quarters, last few quarters this month, previous months, last months, past month, recent months, previous 6 months, next 6 months, last 6 months, recent 6 months, previous thirteen months, recent seventeen months, previous few months, recent few months, previous month, current may, previous november, this apr, past mar this week, last week, past week, recent week, last few weeks todat, yesterday, tomorrow, recent 3 days, past 21 days, recent few days, next few days, next day, recent day recent 22 hours, recent 13 hours, next hour, past hour |
| Filter Negation | not, except, excluding, without, neither, other than, ignoring, apart. apart from, ! =, exclude, exceeding |
Sorting Options | |
| Functions | Keywords |
| Ascending | ascending order, ascending, increasing order, alphabetical order, alphabetical order (a-z) |
| Descending | descending, descending order, decreasing order, alphabetical order (z-a) |
| By Column | sorted, sort, sort by column |