Why are 3D charts not supported in Zoho Analytics?
Until recently Zoho Analytics had both 2D as well as 3D charts. But, having analyzed the usefulness of 3D charts deeper especially from the user experience point of view, we have decided to completely stop the support for 3D charts.
3D charts pose the following challenges in terms of usability and intuitiveness.
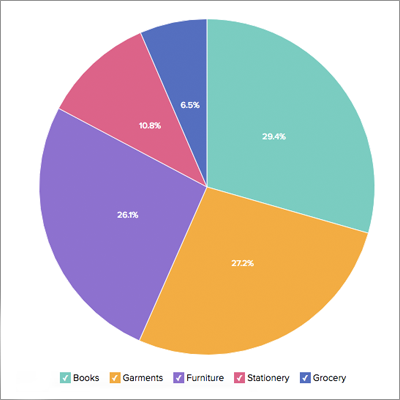
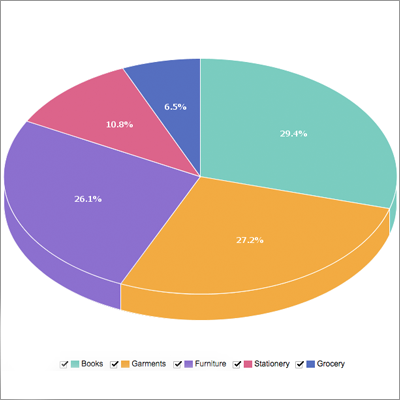
1. Parallax distortions in the sizes of the data points
The 3D variant distorts the true relationship between the values in the series. In the below example, we have highlighted the same chart in 2D and 3D. The Garments slice is truncated making it look like it holds a larger value when compared Books. This is because it is difficult to convey the third dimension in a two-dimensional surface. Therefore negatively affecting the accuracy and speed at which one can interpret data.
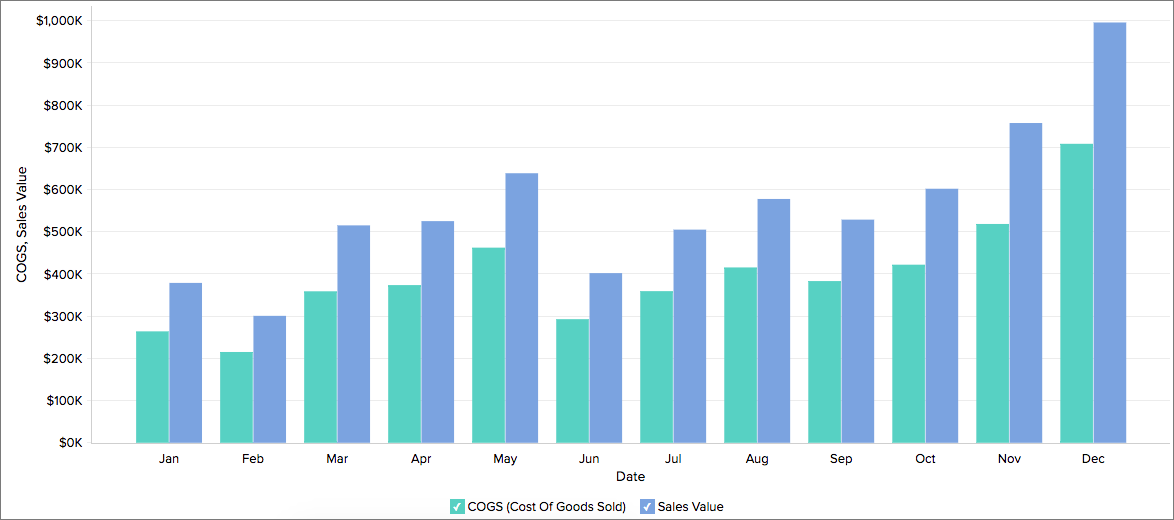
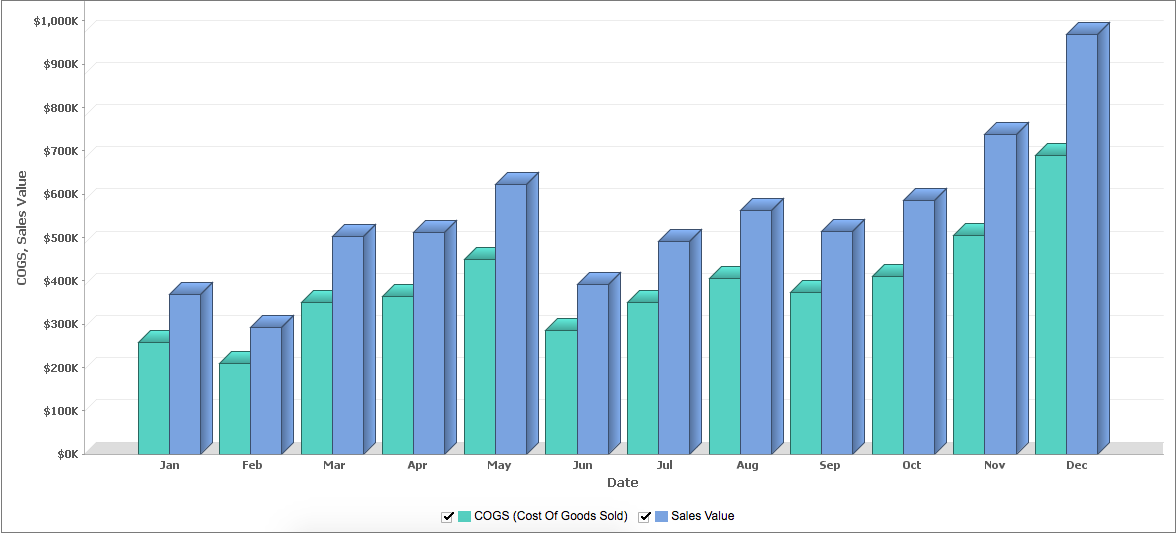
2. The numerical axis of a bar chart should start with Zero
This is difficult to achieve when using a 3D bar. In the below image the axis starting at Zero is not very evident due to the elevation of 3D bars. Therefore it is difficult for the eye and the brain to interpret data.
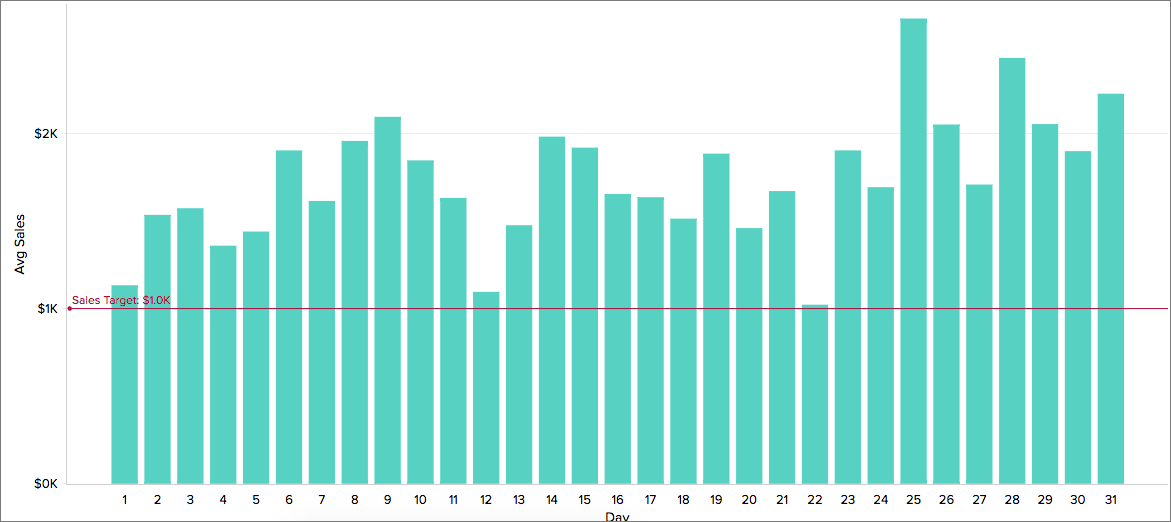
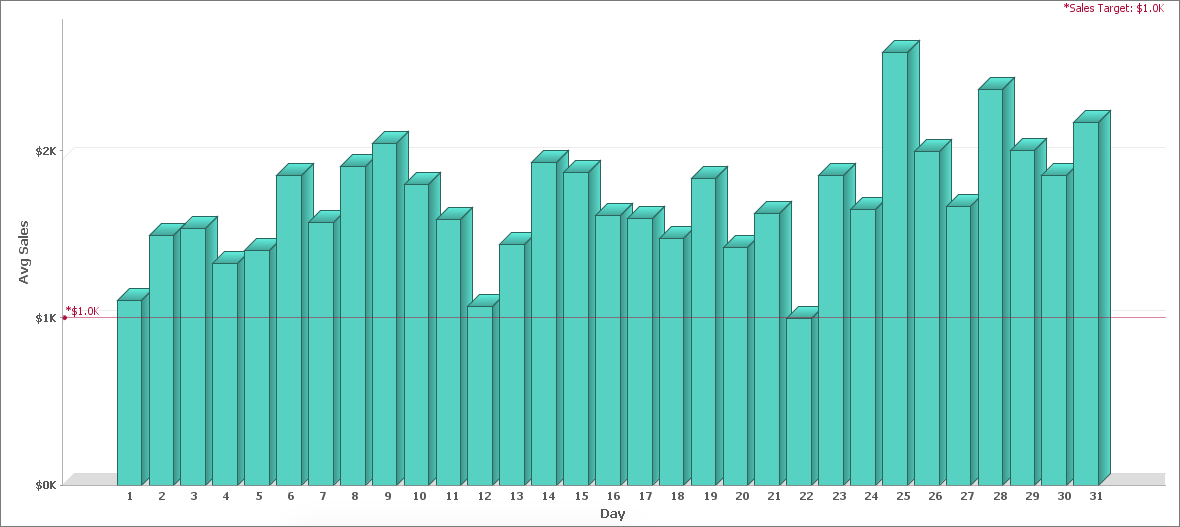
3. Difficulty in identifying patterns
One of the main purposes of displaying data in a chart is to facilitate the identification of patterns. The identification of patterns are much better in a 2D graph than on a 3D graph.
Let us consider the below example: the 3D bars in the COGS bar for March and April looks the same but if you look closer in a 2D chart the values are actually different.
2D Combo Chart