What-If Analysis
Zoho Analytics supports What-if Analysis using Variables. What-If Analysis enables you to do powerful scenario analysis on your data. It enables you to measure the difference in outcome when one or more variables change. This helps in effective decision-making, as you can visualize the business impact that can arise from such changes ahead of time.
Setting up What-If Analysis
This section explains how to set up a What-If Analysis.
Step1: Create a Variable to parameterize the dynamic input for What-if Analysis.
Step 2: Use the Variable in the Aggregate Formula to compute the metrics you want. The formula will essentially capture the impact of the variable.
Step 3: Create a report using the Aggregate formula stated above.
Step 4: Add the Variable in the User Filter of the report or dashboard. This User Filter will act as the dynamic input for the report or dashboard.
Step 1: Creating Variables
Zoho Analytics What-if Analysis allows you to visualize the impact of one or more parameters over your metrics. To parameterize dynamic inputs for your What-if Analysis, you need to create a Variable. Create a Variable with a List or Range of values as what-if input. In the below example, we've defined a list of discount percentages as a variable.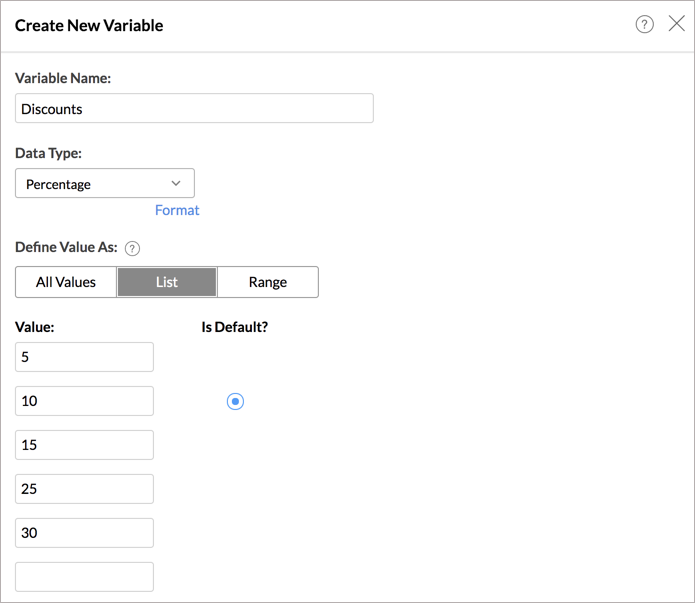
Step 2: Creating Aggregate Formulas
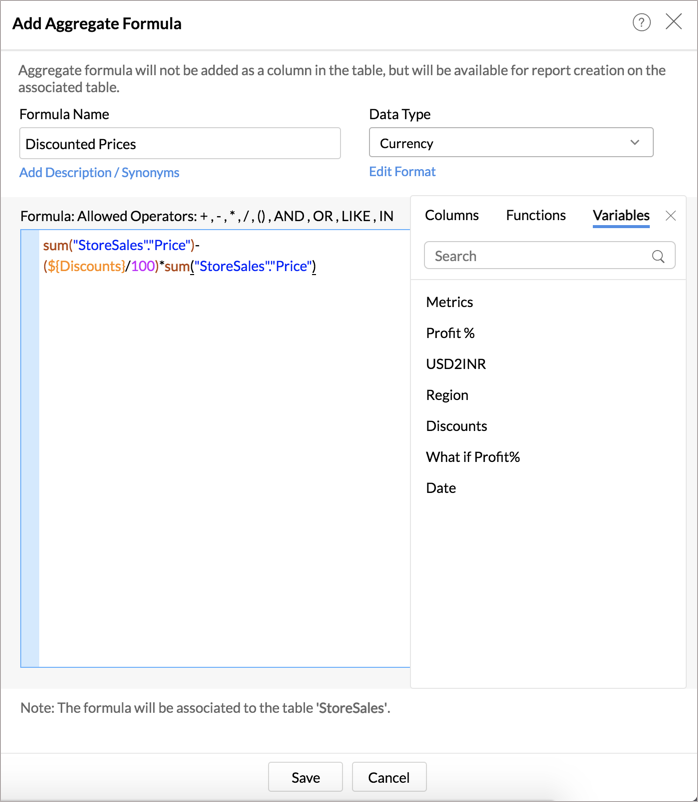
Construct a formula to compute your metrics. Insert the custom variables you have defined in step 1 appropriately in the formula so that you can visualize the impact as the dynamic value changes. You can insert one or more custom variables in your formula by clicking the variable in the Variables tab.
The below formula uses the variable Discounts to calculate the Discounted Prices.
Step 3: Creating Report
Create a report using the Aggregate Formula in step 2. The report will show the values based on the default value defined in the Variable.
In the below report, the Discounted Prices will be calculated for 10% discount based on the default value defined in the variable. 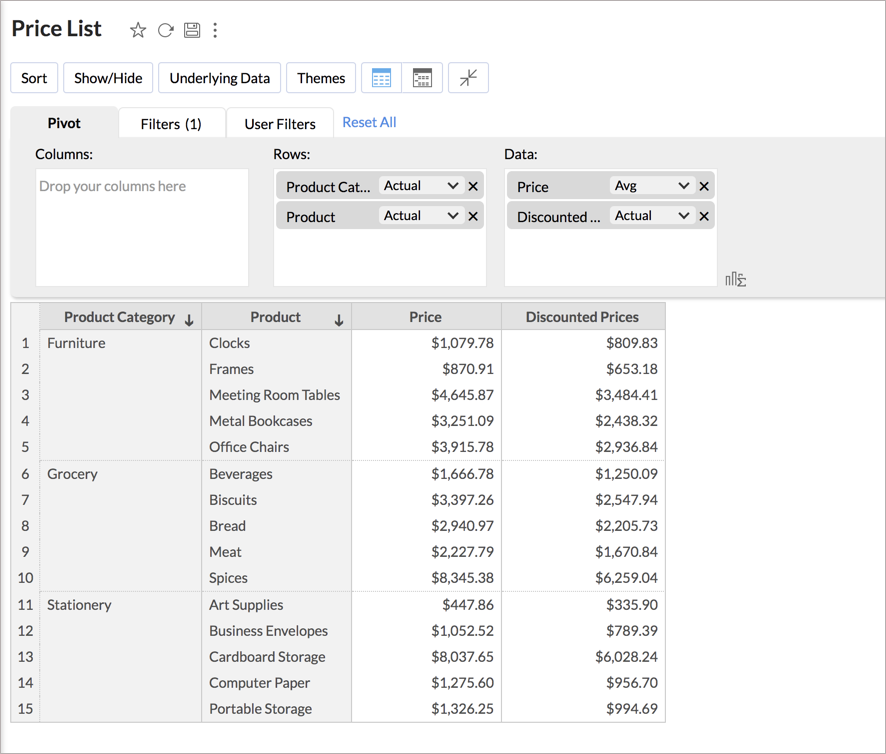
Step 4: Adding Variable as User Filter
All the Variables associated with the report will be listed in the Variables tab of the report designer. Add the Variable as a User Filter in your report. This allows you to change the formula input and thus make a dynamic calculation.
We've added the variable Discounts as a User Filter. 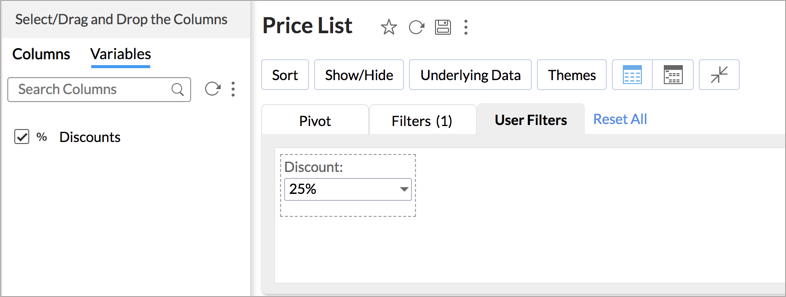
In the below example, as you change the discount, the Discounted Price will be calculated accordingly.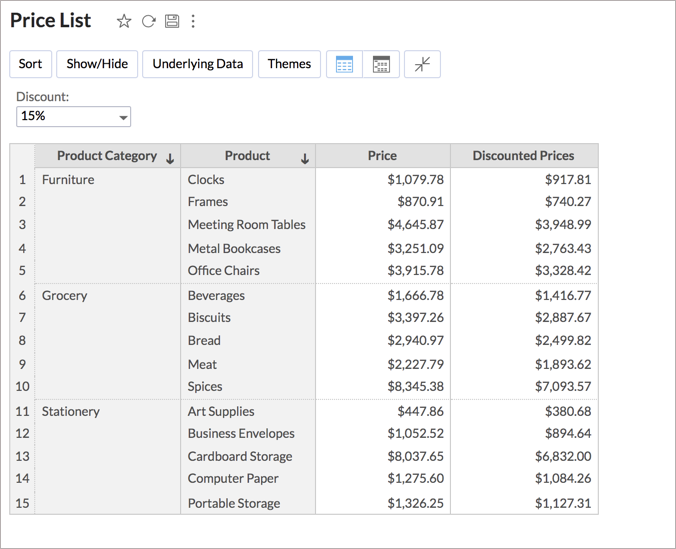
Forecast based on What-if
Zoho Analytics allows you to predict your future data trends in a chart, using the forecasting feature. You can apply What-If Analysis over forecast data also. Click Analytics > Forecast. Apply forecast over the What-if column.
What-If will be applied over the entire chart along with the forecasted data.
You can choose to apply the What-if factor over the forecasted data alone by selecting the Treat as What-if Forecasting checkbox. 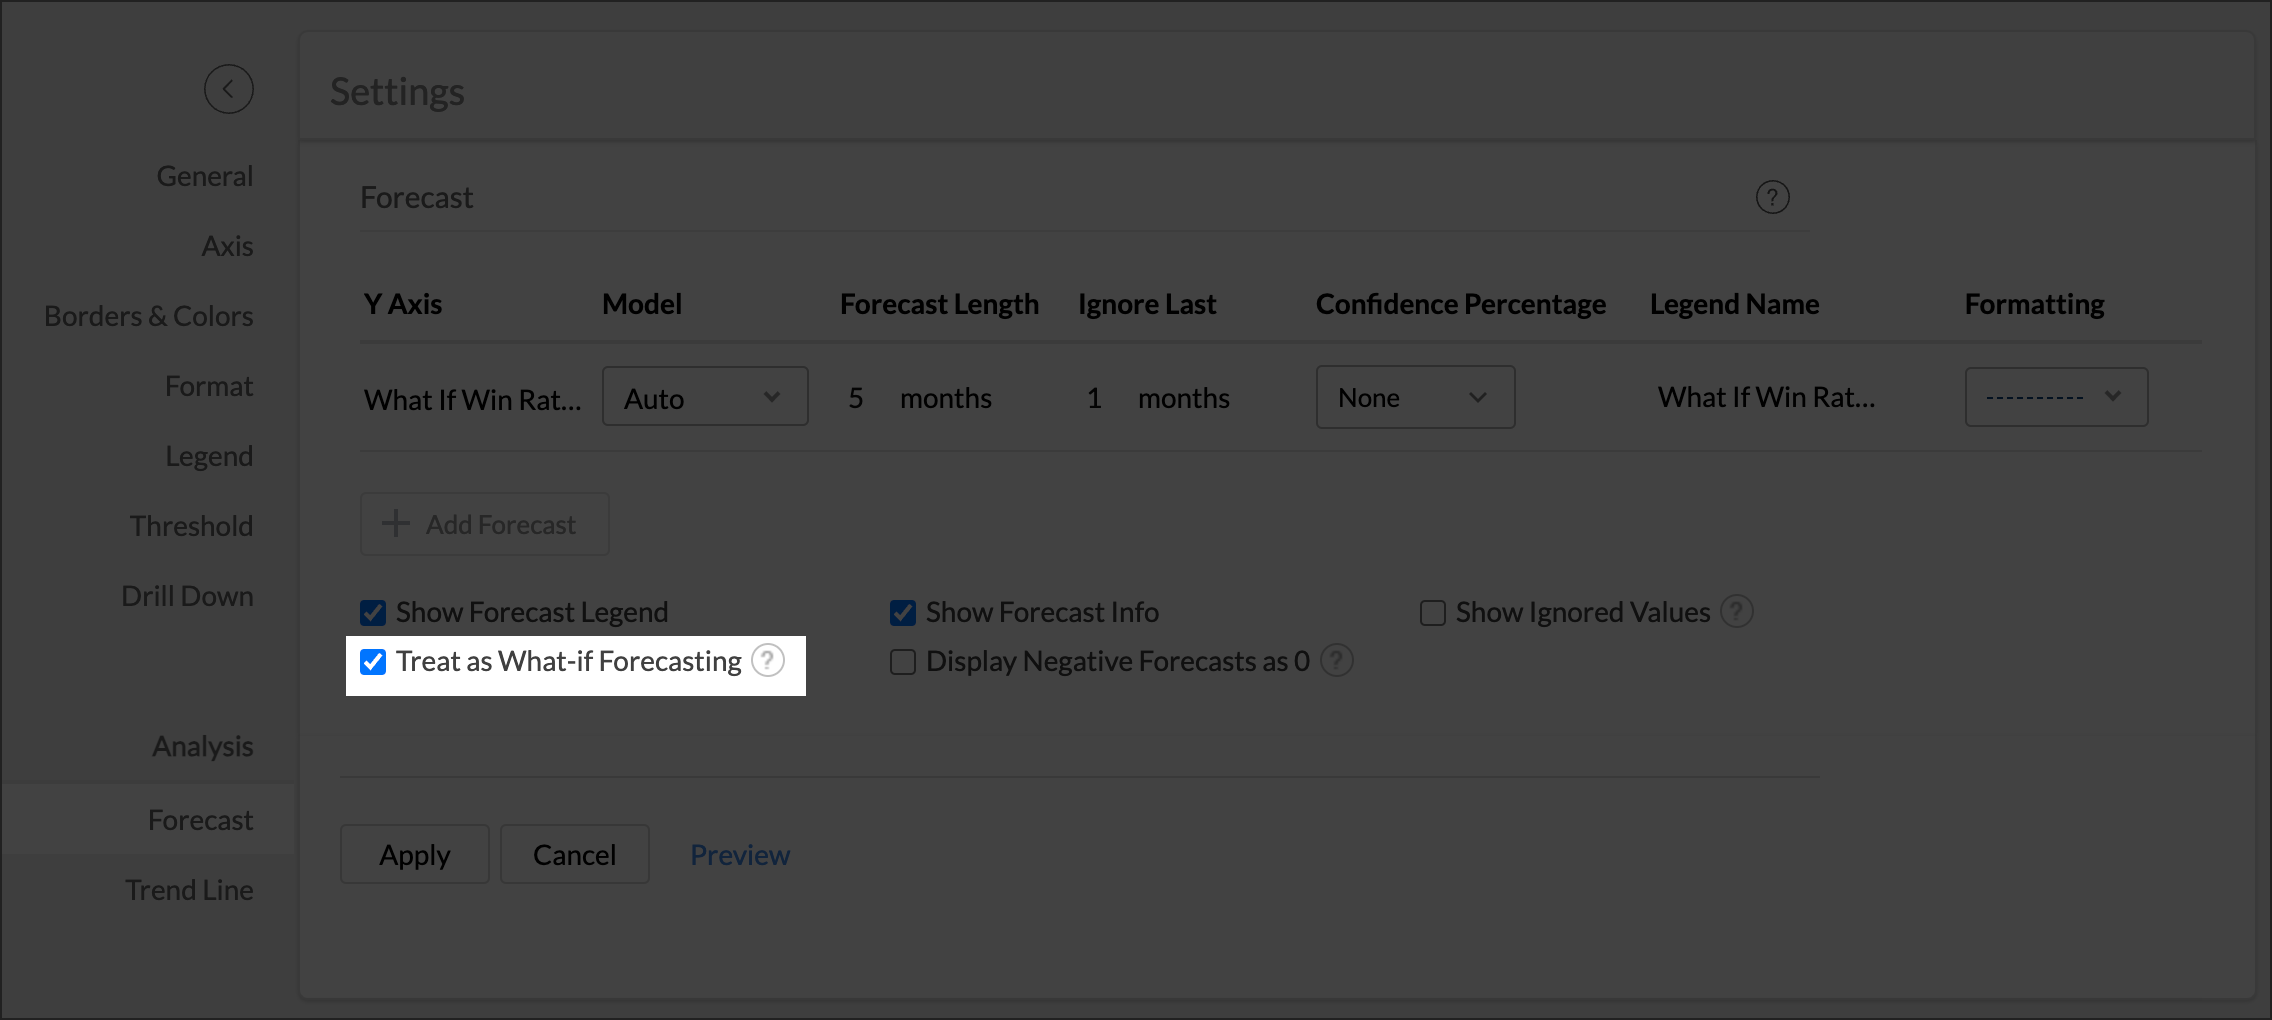
The following screen illustrates What-If Analysis for forecast data alone.
Click here to learn about how to set up forecasting.
Customizing What-If variable for Shared Users
You can define different sets of values for your shared users depending on the need .
Here, we have defined different discount ranges for various user groups or user email addresses.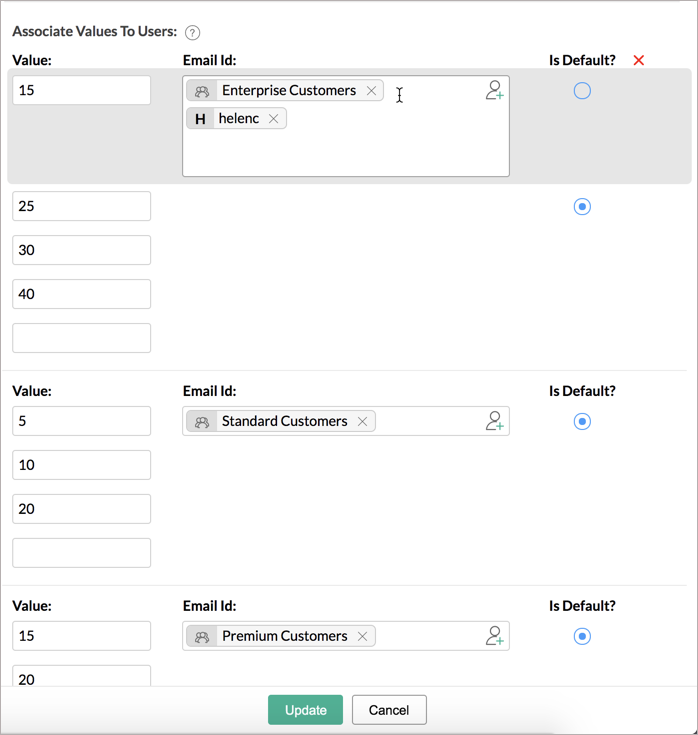
When the shared users access the report, the user filter will list all the variable value specified for them. they will be able to change the value to vizualize the impact of the variable.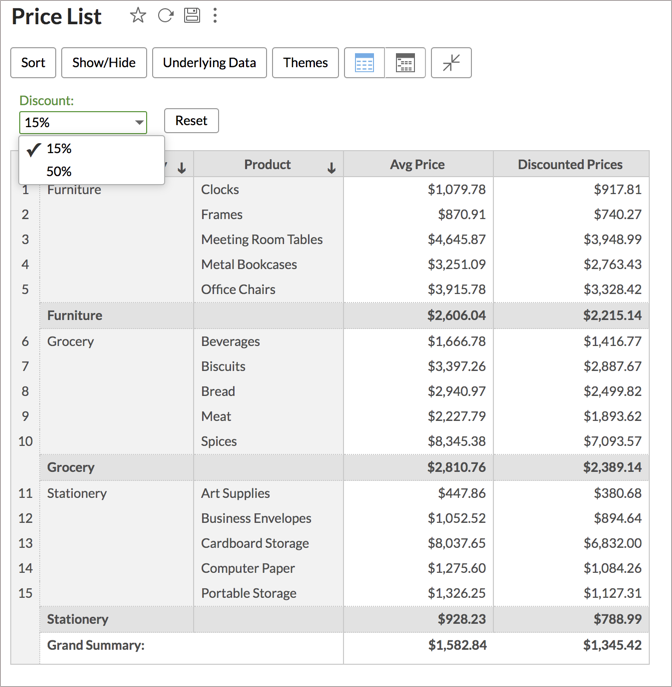
The below presentation explains the above-stated steps in detail.
Solutions
The following are a few demonstrative sample solutions for What-If Analysis.
Solution 1: Discount over Sales
The below solution explains how to calculate the influence of Discounts over Sales.
Solution 2: Win Rate % against Won Deals
The below solution explains how to calculate the impact of Win Rate % against Won Deals.
Solution 3: Projected Sales
The below solution explains how to create a report with Projected Sales with the possibility of -50% to 50% revenue change.
Solution 4: Change Summary Function
You can also apply different calculations within a report for each variable value.
The below presentation explains how to visualize different summary functions within the same report.