Zia Insights
Zia Insights, a generative AI tool that utilizes advanced analytical techniques and machine learning algorithms to analyze reports and dashboards, uncovering and delivering actionable insights.
Zia Insights provides answers (narratives) to various questions that arise while trying to interpret data and direct toward meaningful conclusions by offering Descriptive, and Predictive insights.
- Descriptive insights provide an overview of past performance and trends for specific data.
- Predictive insights indicate how a trend has evolved and the likelihood of its future change.
Topics Covered
- Invoking Ask Zia Insights
- Using Zia Insights
- Dynamic Insights based on Legend
- Explain Data - Zia Insights
- Customize Zia Insights
Invoking Zia Insights
Zia Insights can be invoked either from individual reports or from the reports that are embedded inside dashboards.
From a report
To access immediate insights on a report, open the required report and click the Zia Insights button on the top right corner. A popup appears displaying the required information.
From a dashboard
To access insights on a report embedded in a dashboard, open the dashboard, expand the required report and click the Zia icon on the top right corner. A popup appears, displaying the detailed insights on the selected report.

Using Zia Insights
Types of narratives
Text insights
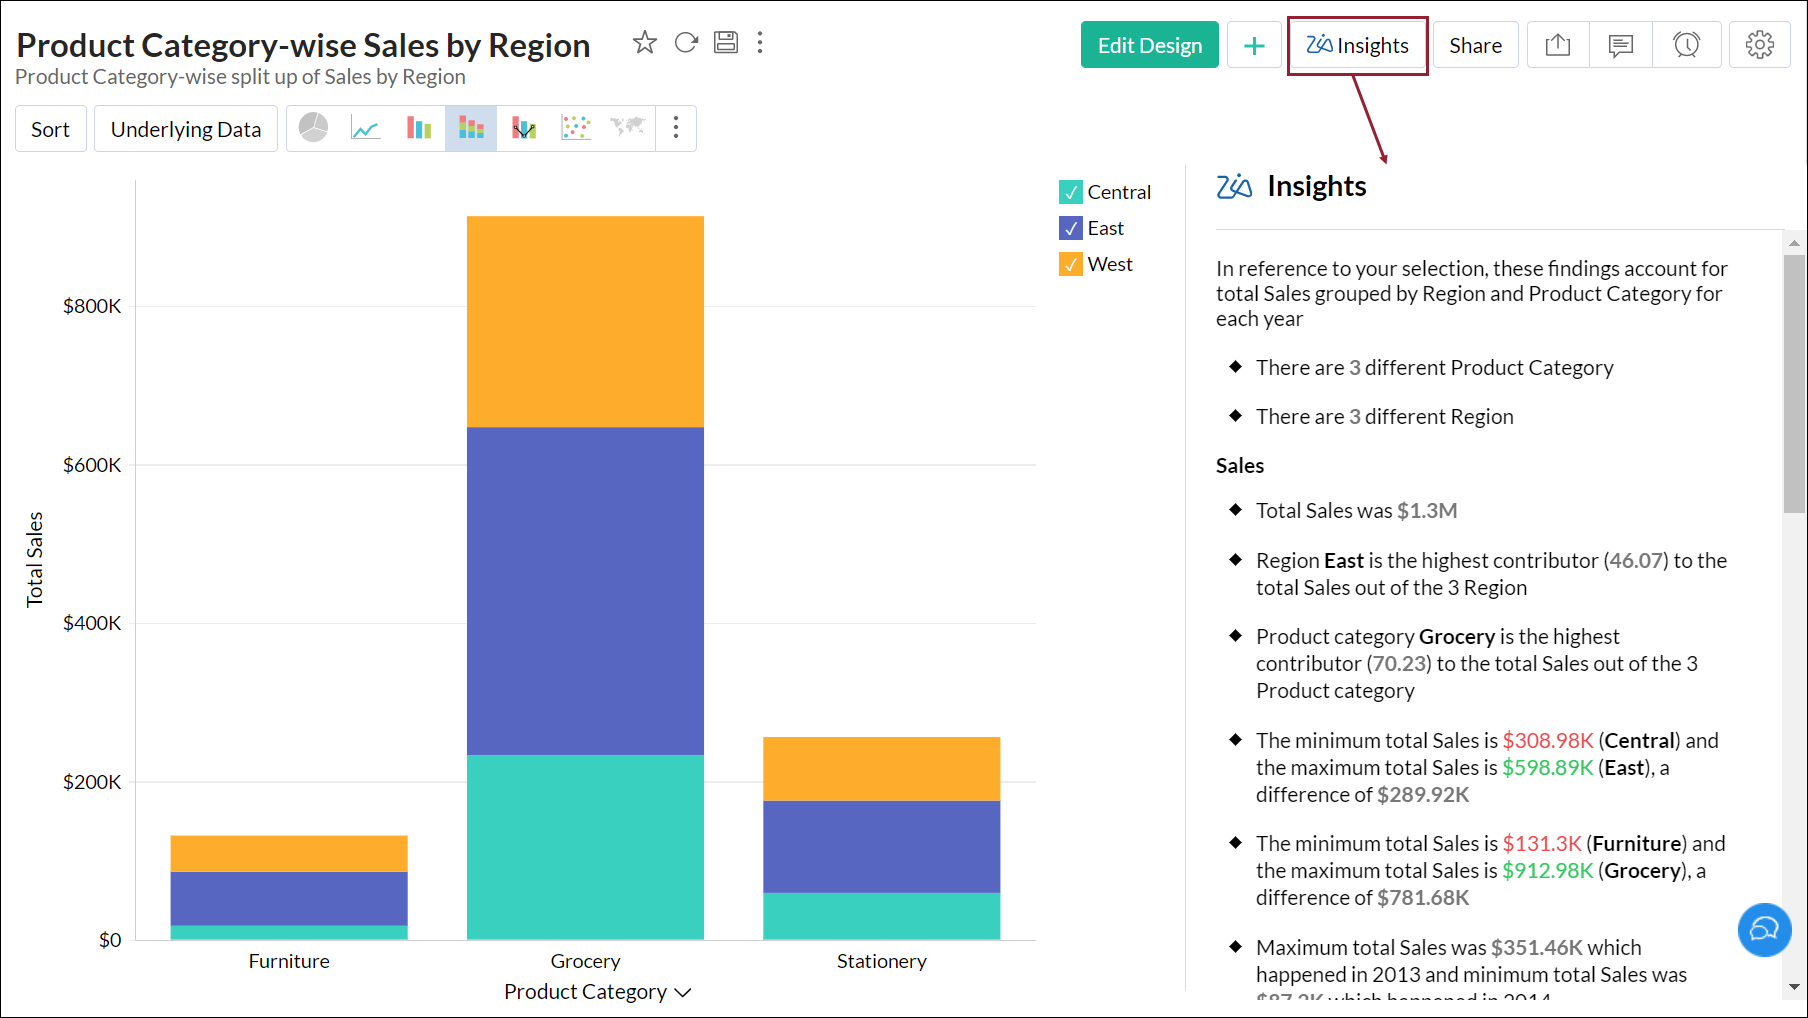
Ask Zia delivers a descriptive summary of key insights from every visualization in plain language, making it easier for users to discover underlying patterns that may not be evident at the surface. These descriptive insights can also be seamlessly added to presentations for more effective data storytelling.

Visual insights
Zia's Visual Insights identifies key performance indicators (KPIs) in a report that contribute to observed trends. It offers focused insights on these KPIs, helping end users gain a deeper understanding of the factors driving certain trends or anomalies.

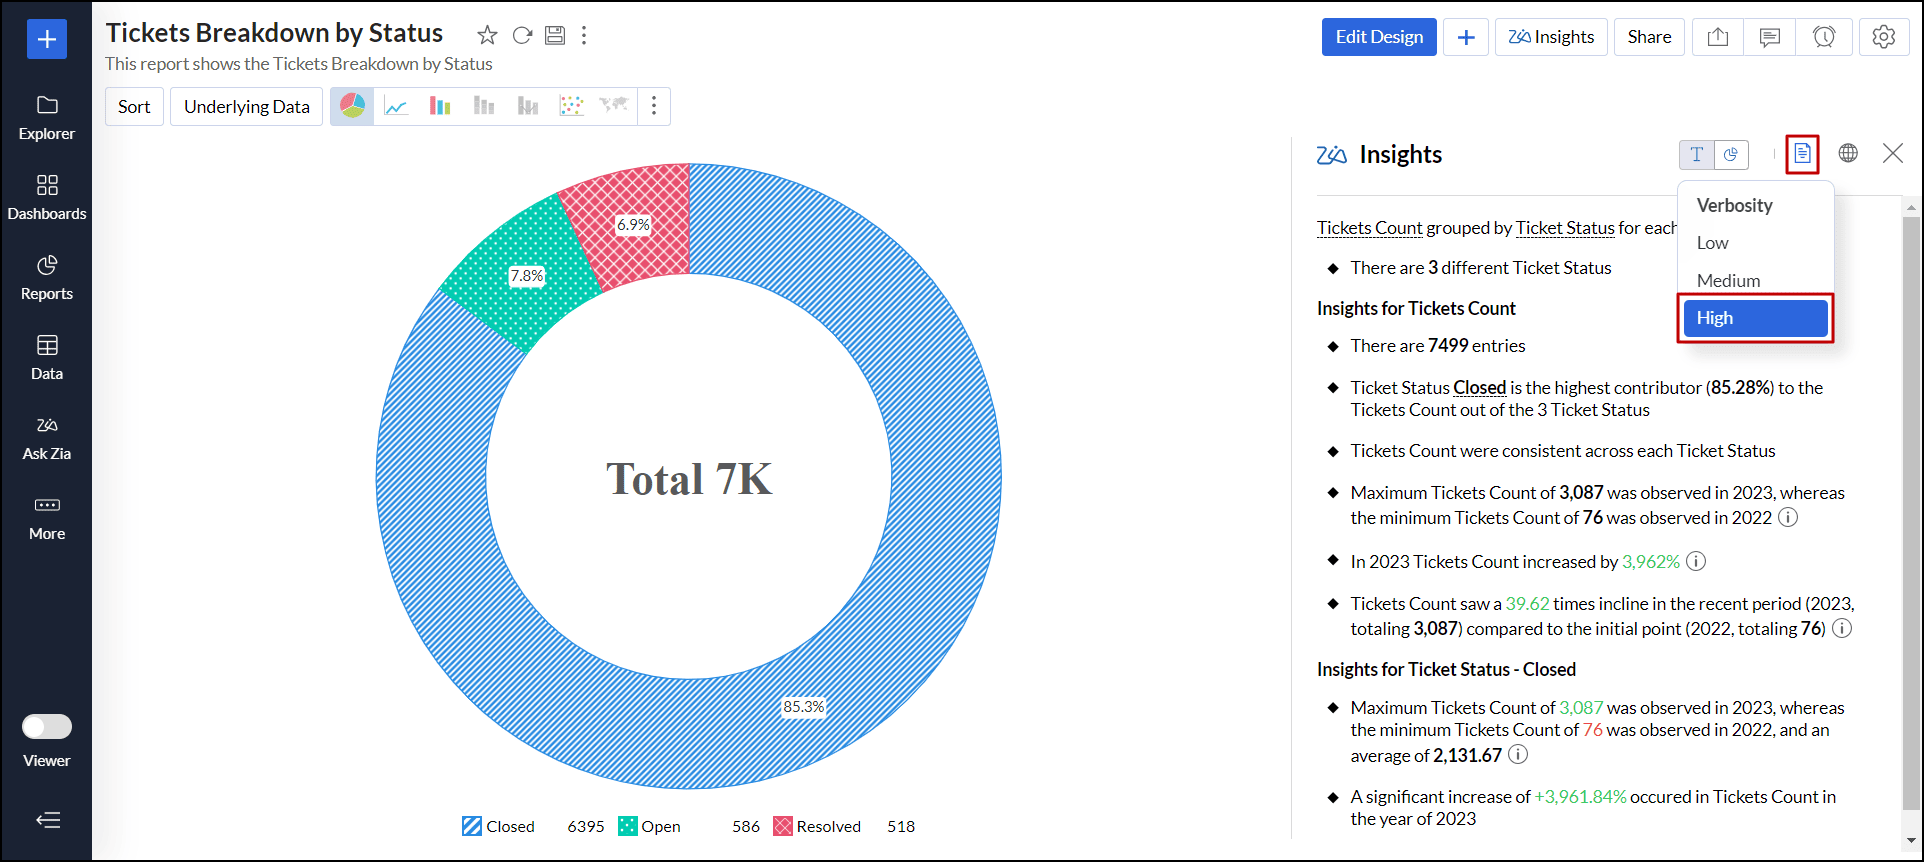
Verbosity
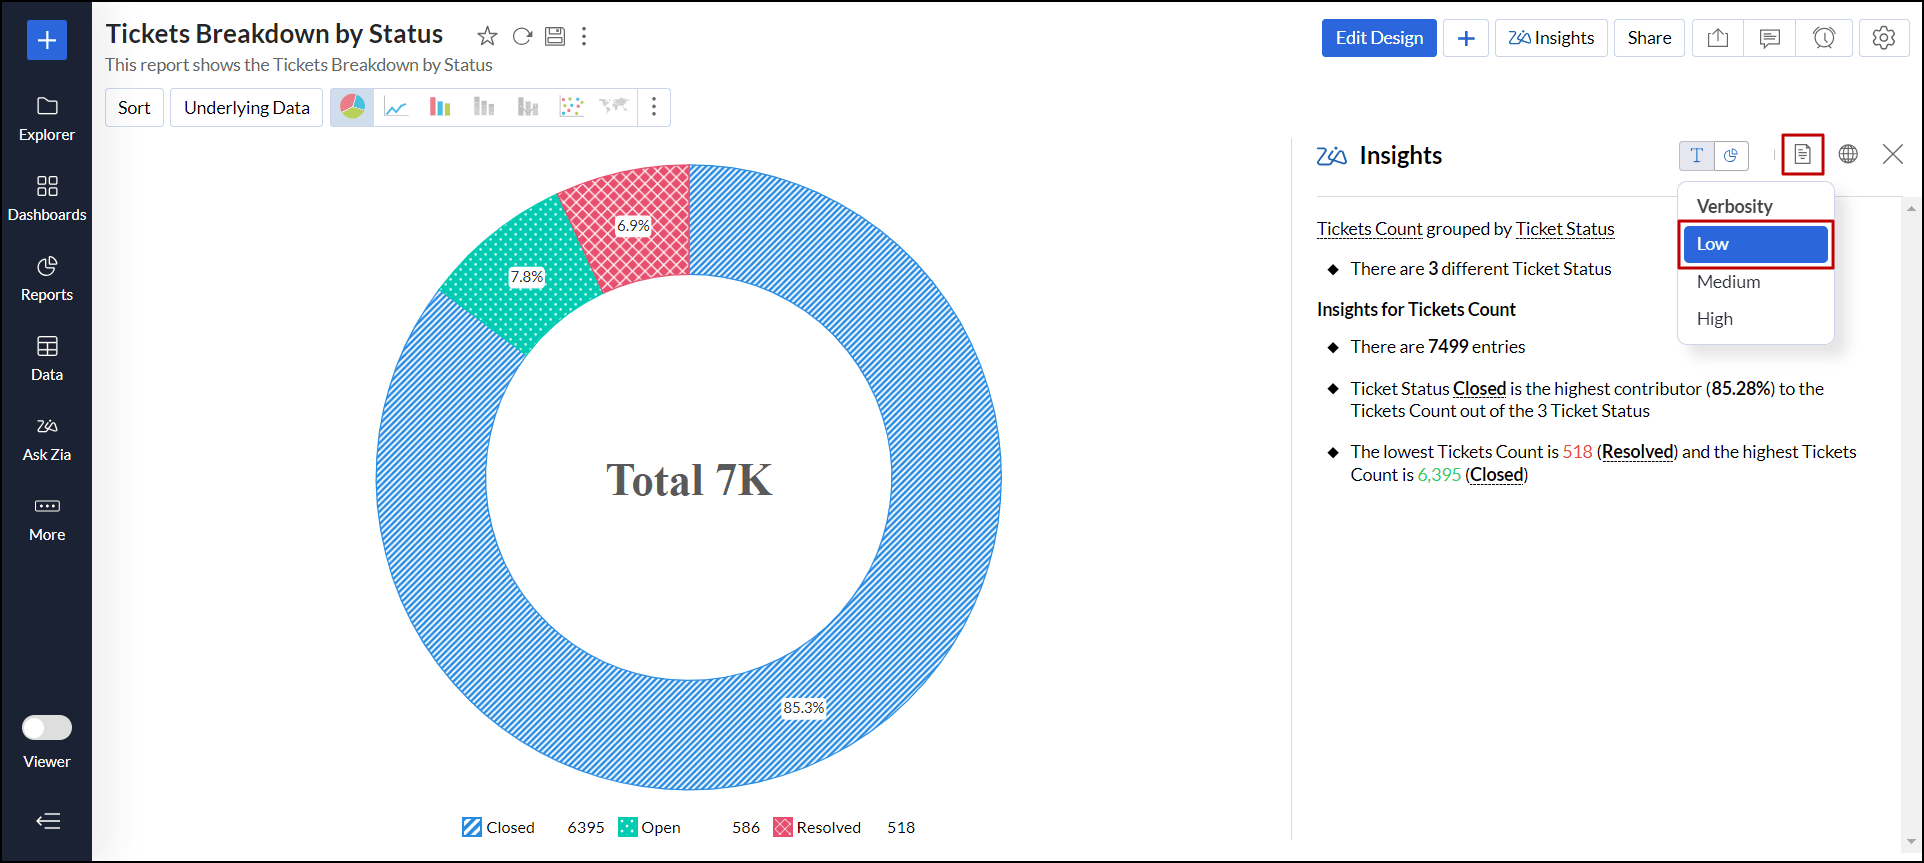
Zia Insights offers three distinct narration levels to customize how narrative insights are displayed.
- Low: The low level delivers straightforward insights directly inferred from the report.
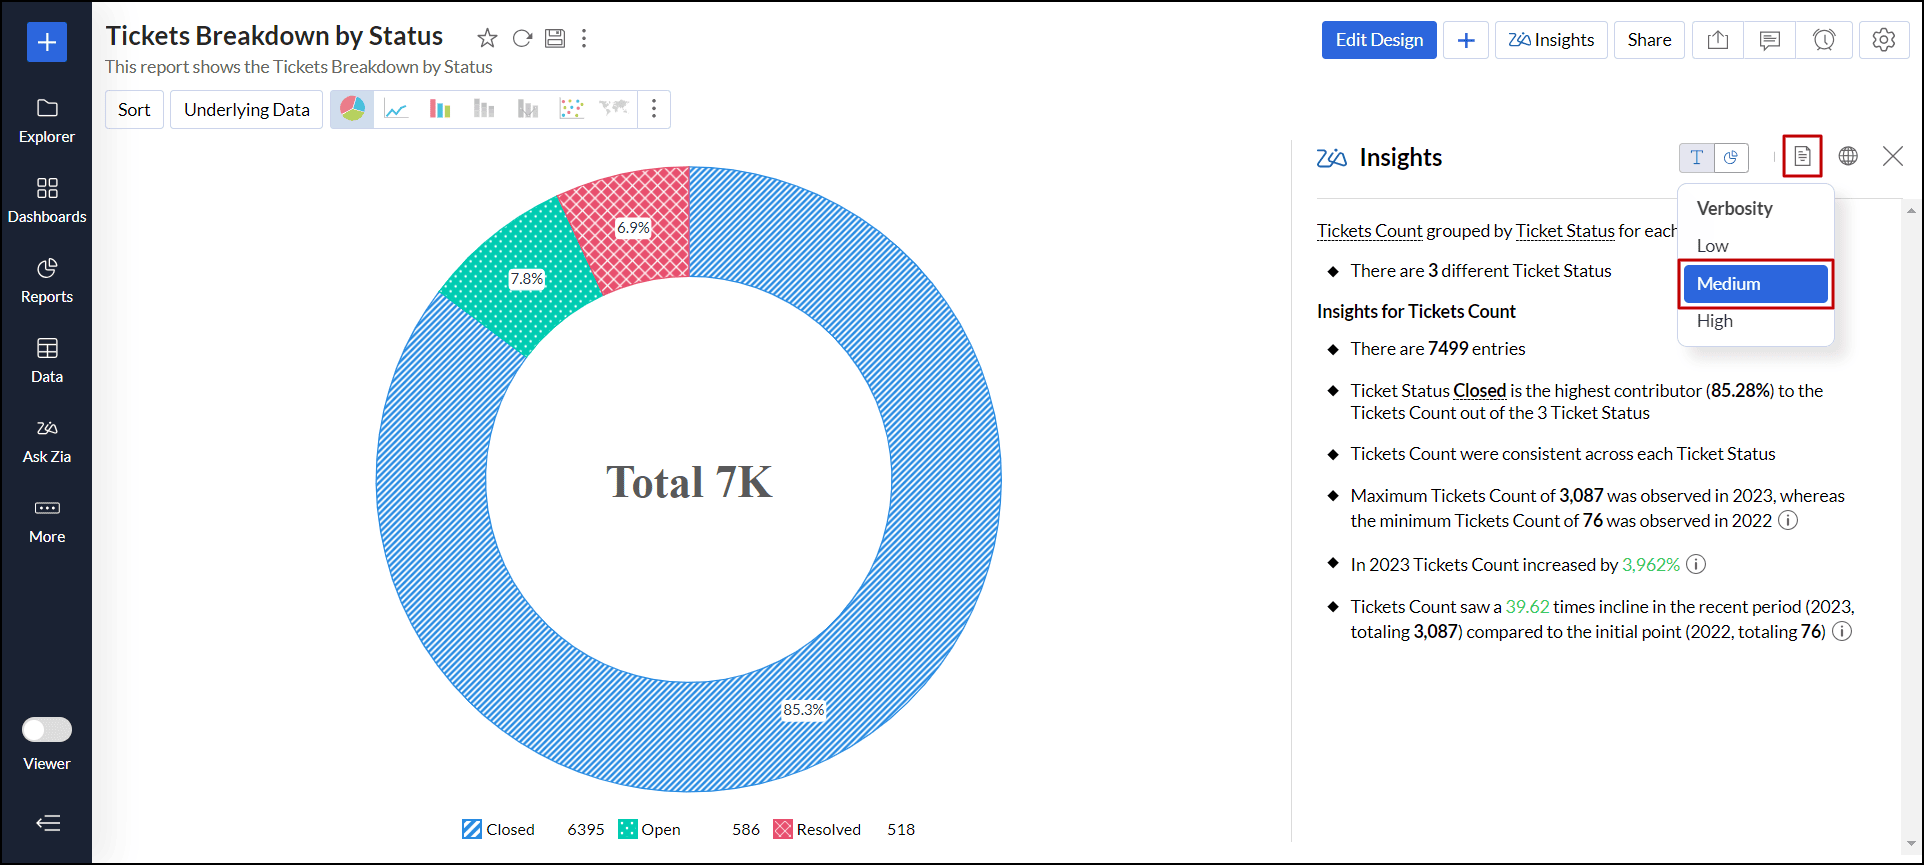
Medium: The medium level incorporates date as an additional dimension, generating insights based on time series and seasonality.
Note: If a formula column is included in the report, the date series will not be added to avoid inaccuracies.
- High: The high level includes both time series insights and insights for each sub-section.
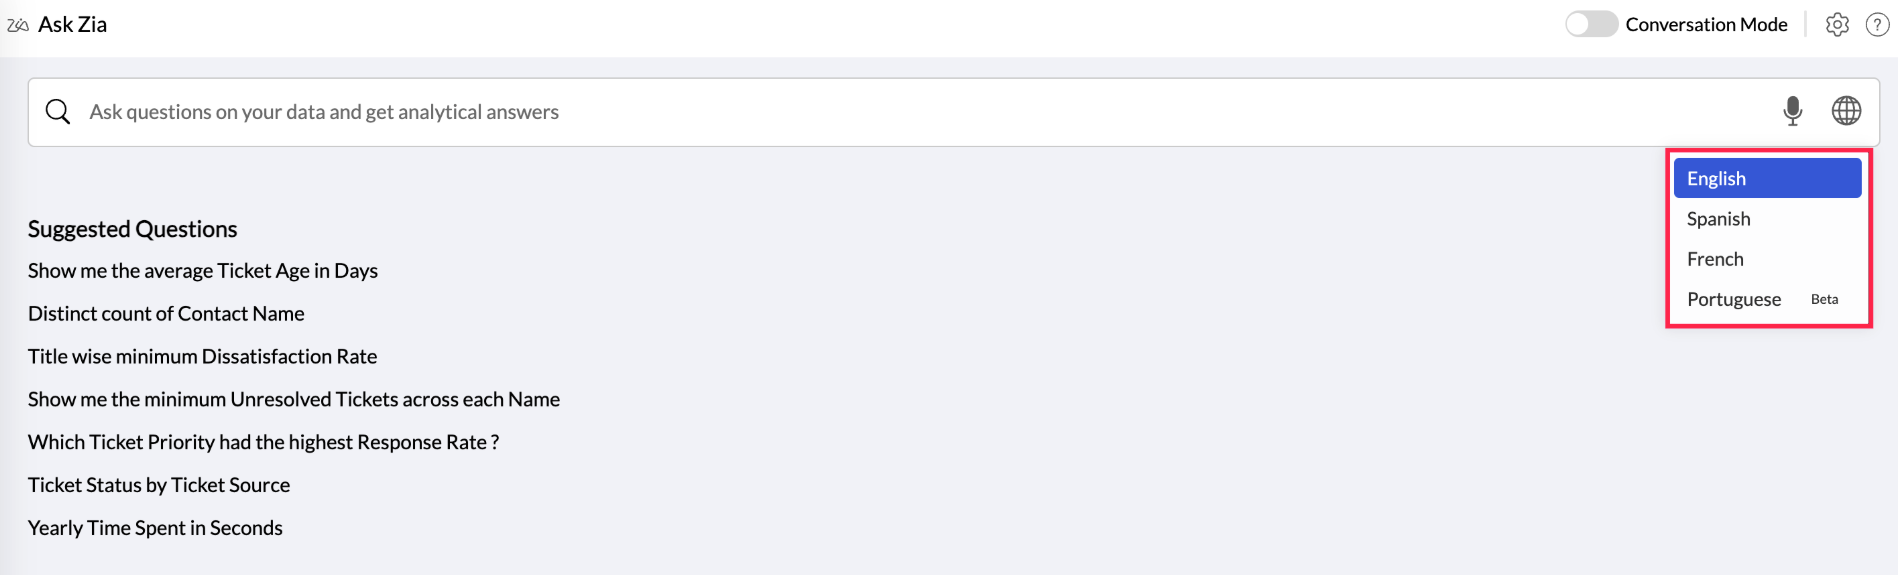
Language
Ask Zia now supports English, Spanish, Brazilian Portuguese and French (Beta) languages.The language specified in your Zoho Analytics account will be the default language for Zia Insights. However, you can change this using the Language Settings option in the Zia Insights dialog.
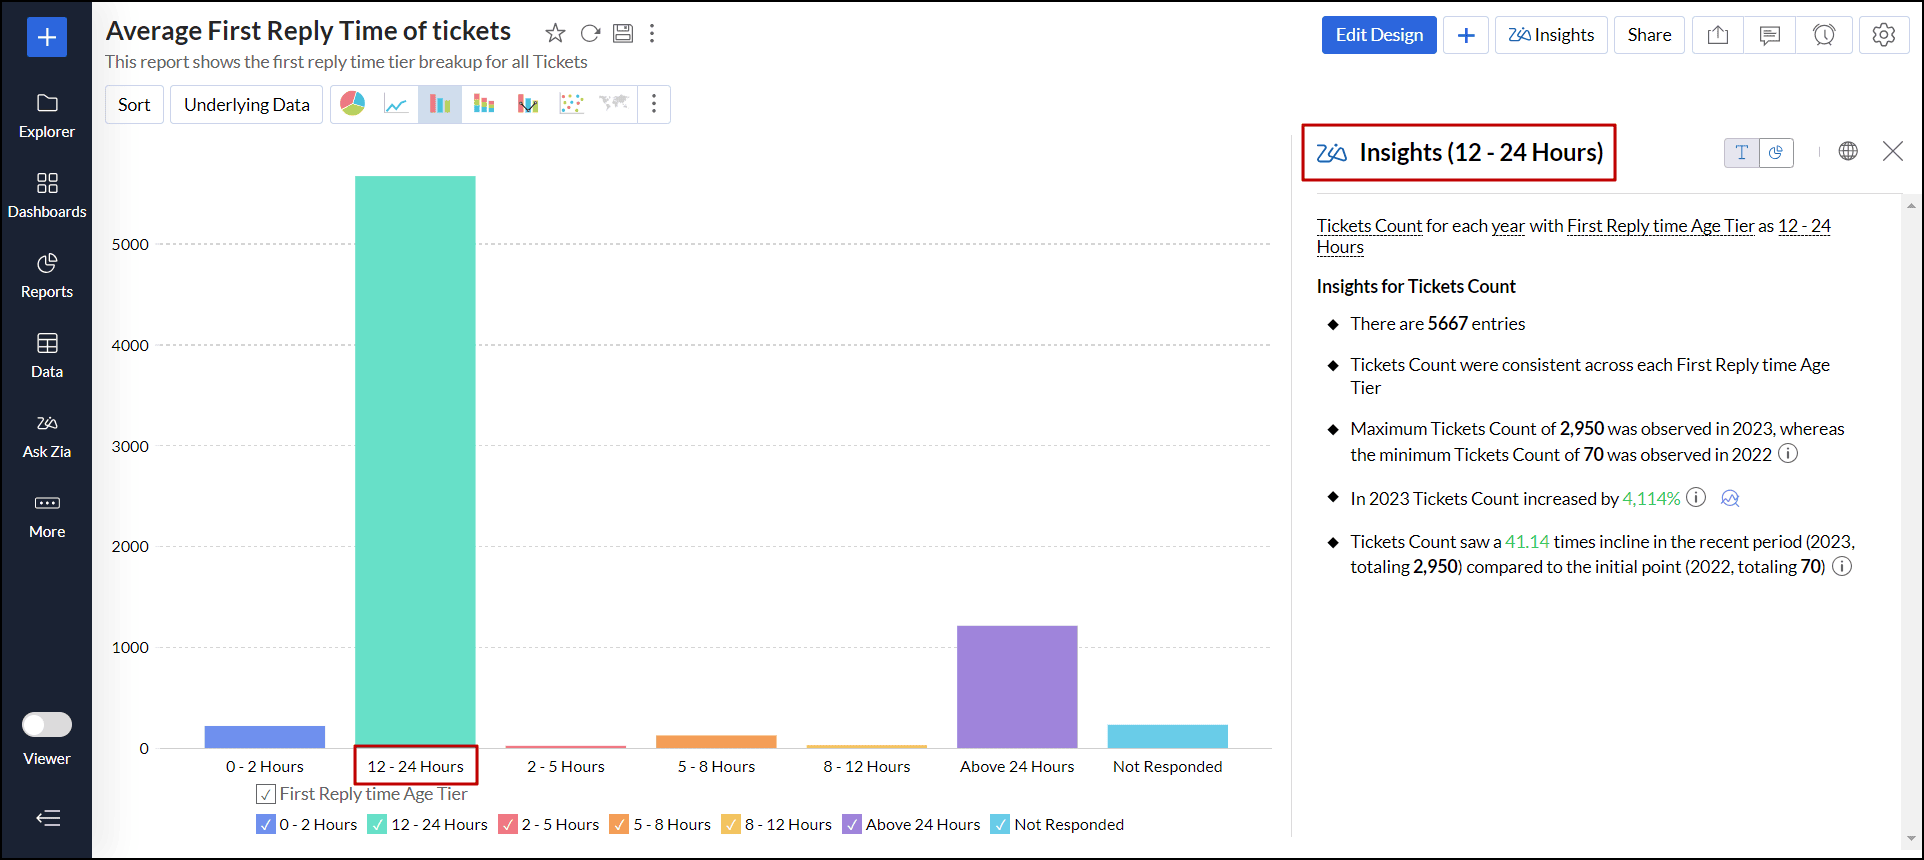
Dynamic Insights based on Legend
Zia Insights provides insights dynamically based on the selection made in the legend filter to help you dig deeper and derive insightful information based on the area or category of interest as per the selection.
Explain Data - Zia Insights
The Explain Data - Zia Insights helps you quickly uncover insights specific to a KPI. It compares the chosen data point with other data points, helping to understand the correlation, trends, contributing factors, and outliers in the data. Follow the steps below to do this.
- Open the desired report in view mode.
Click a data point in the report, and choose Explain Data - Zia Insights.
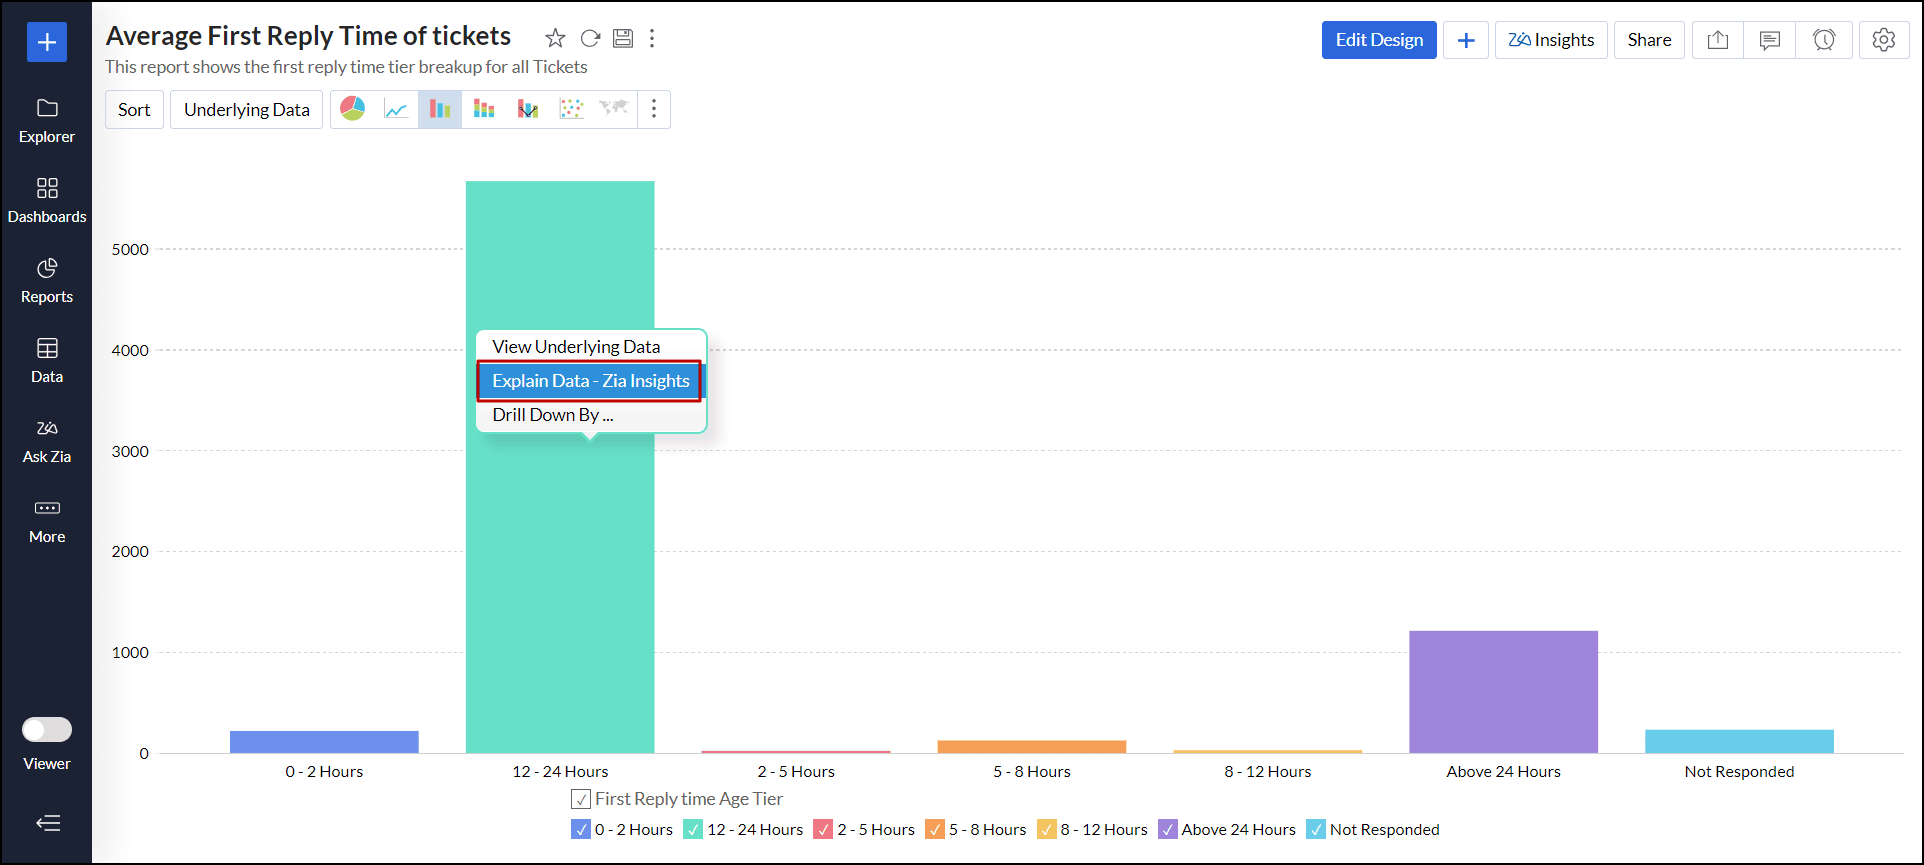
Insights for the selected data point will be displayed on the right. Refer to this section to learn about the type of insights generated.


Customize Zia Insights
Zoho Analytics allows you to customize and control the factors used to generate insights. Refer to the below sections to learn more.
Terminologies used
- Metric: It holds numerical values like customer satisfaction score, revenue, etc.
- Measure: It is a specific value or quantity calculated based on metrics. Example: Overall customer satisfaction, Overall ticket count, Total sales, etc.
- Dimension: The values in this column help to organize and analyze data. Example: Ticket status, Product Type, Location, Time, Contact name, etc.
- Time Series: A column that includes data points recorded at specific time intervals, such as dates, times, or timestamps.
Explain by Columns
This option allows you to select the columns you want to use for generating Zia Insights. It is recommended to choose at least one metric column and one dimensional column for effective insights.
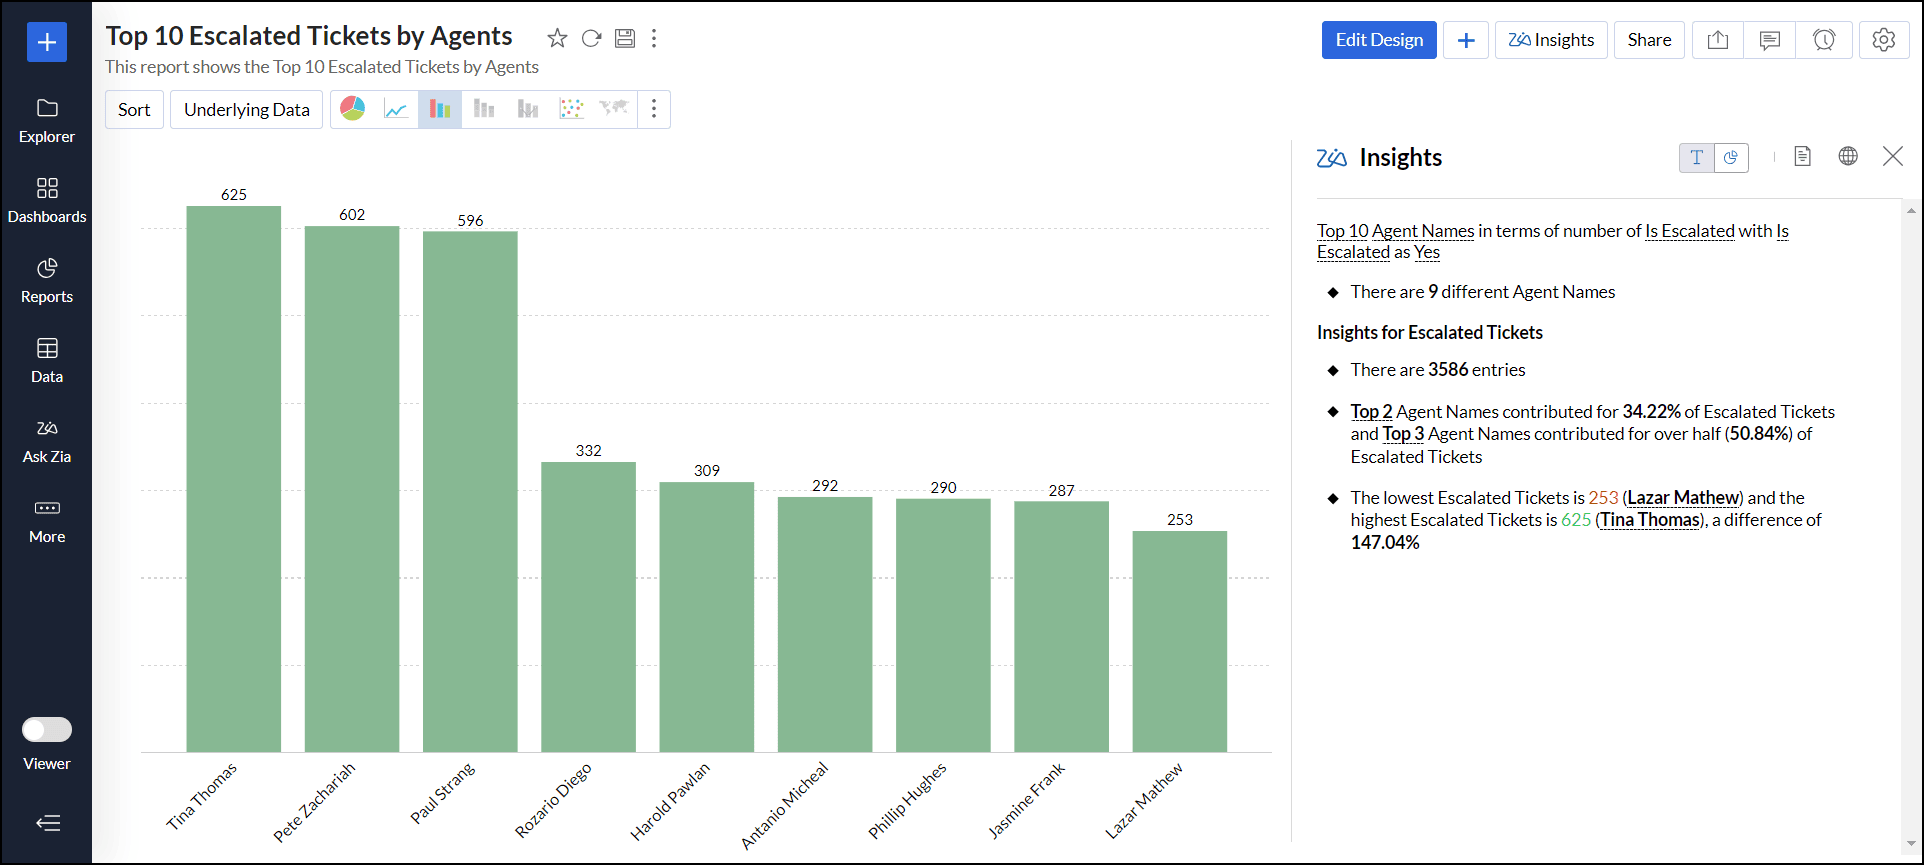
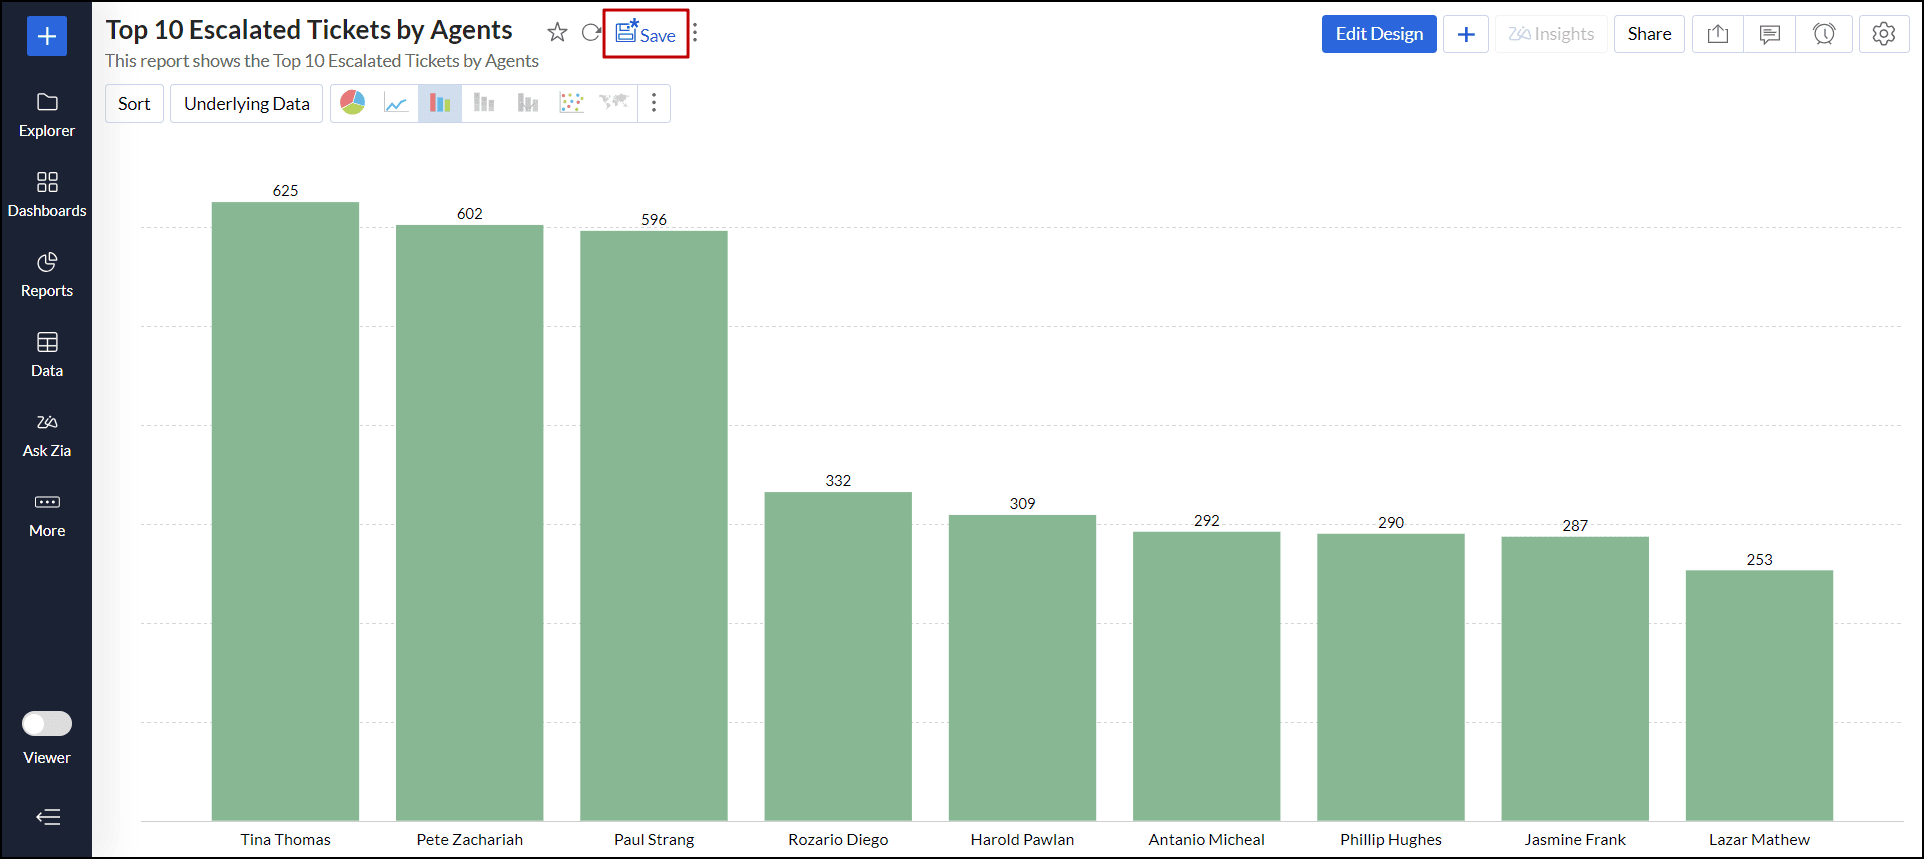
Open the desired report. For example, let's use the chart "Top 10 Escalated Tickets by Agents" to customize the Zia Insights. The initial Zia Insights are generated based on the Contact Name and Is Escalated tickets column.
Click the Settings icon at the top right corner.

In the dialog that appears, navigate to the Zia Insights tab and expand the Explain by Columns option. All the columns used in the report are selected by default.
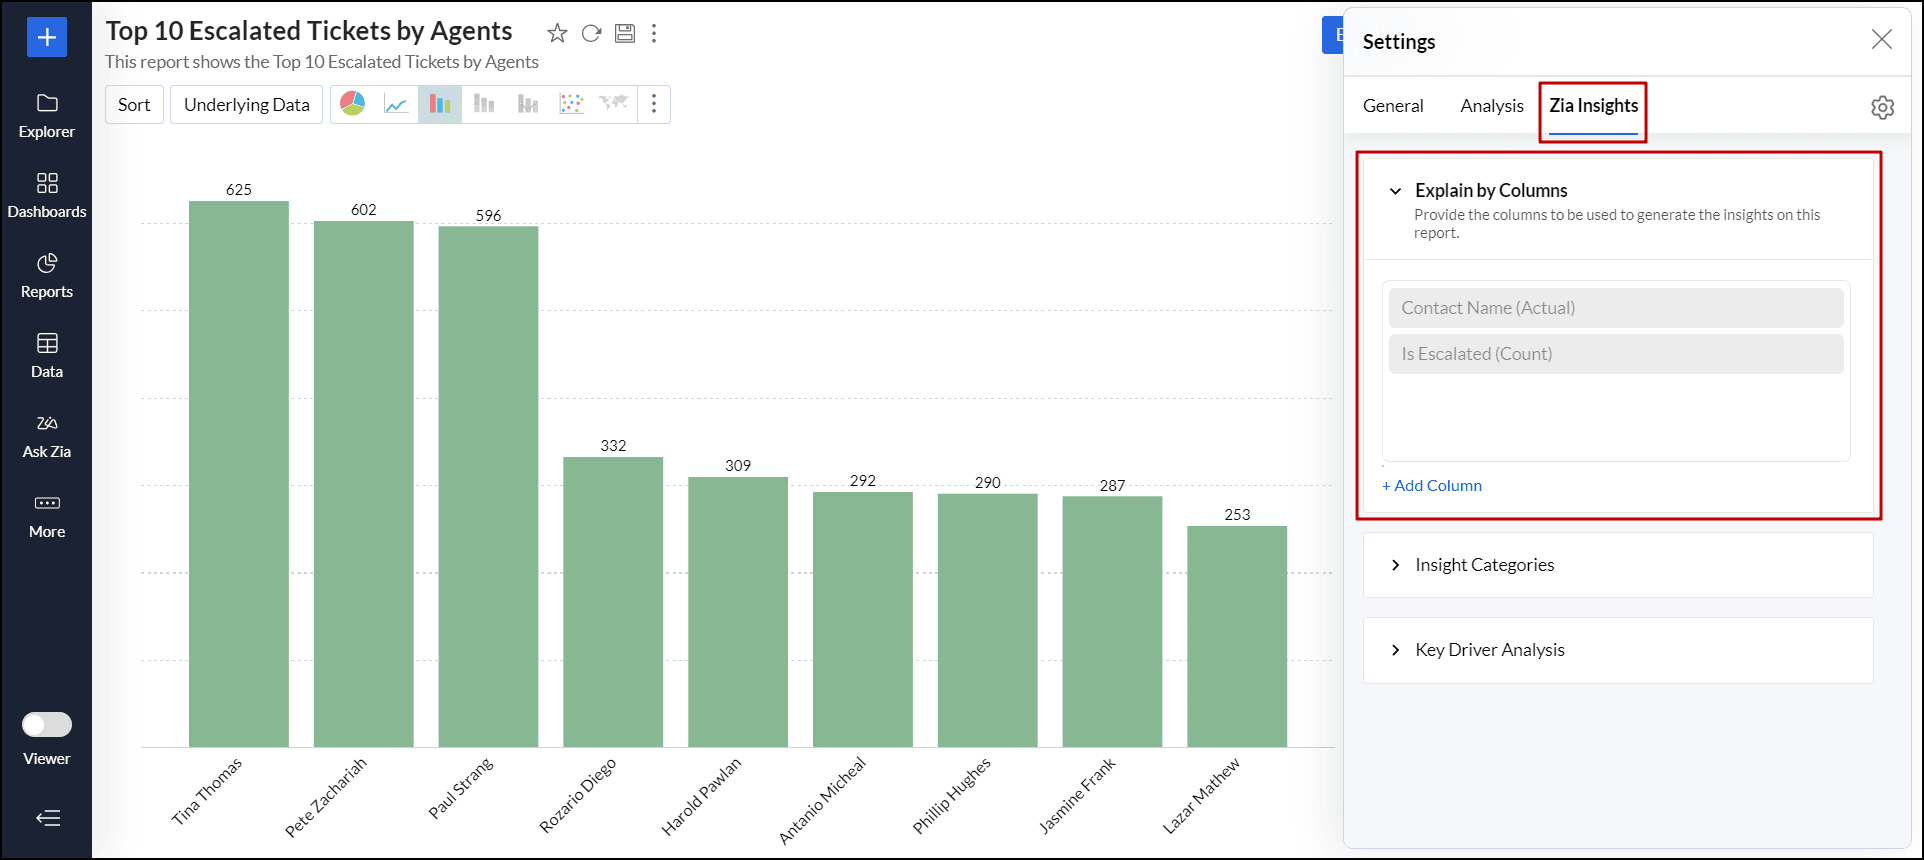
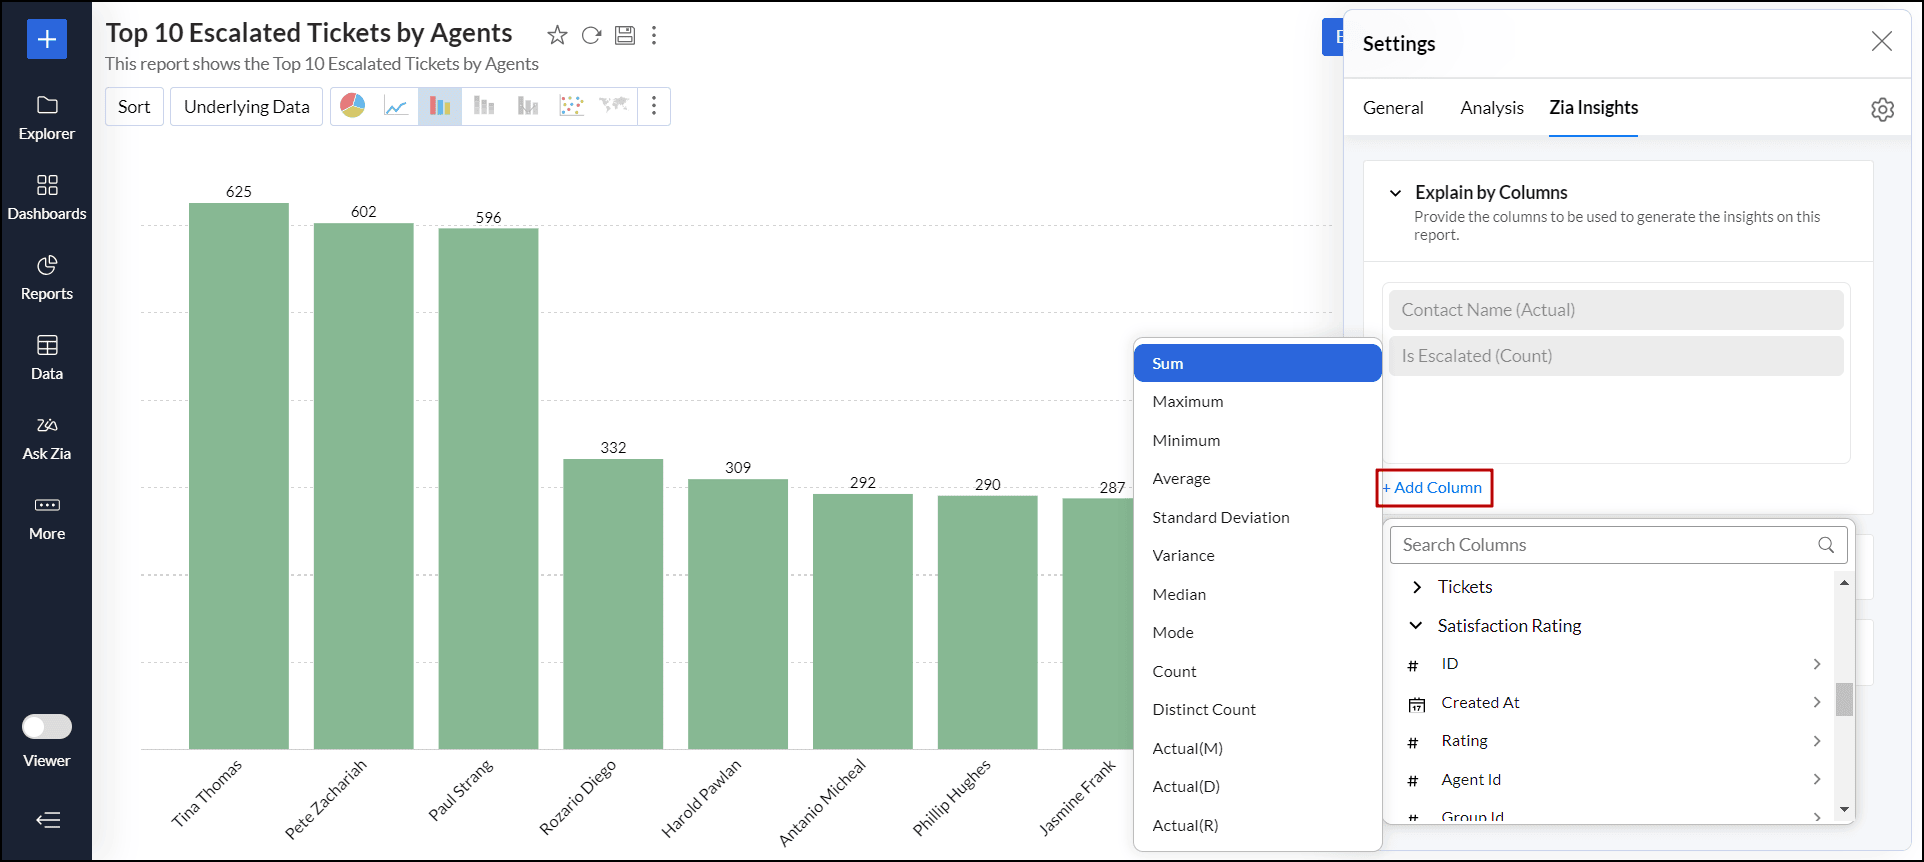
Click Add Column to include the relevant metrics or dimensional columns to be used for generating insights. In this example, we use the Rating column to assess the satisfaction rate of the agents with the highest number of escalated tickets.
Click Save to save the report.


The selected column (Rating) will now be used to generate Zia Insights.

Insights Categories
Zoho Analytics enables you to select the types of insights to be generated for reports, ensuring you focus solely on the insights you need. Zia Insights is categorized into the following five analyses.
Contribution Analysis
Contribution analysis enables you to segment data and identify the factors that significantly contribute to the overall results. For contribution analysis, at least one measure and one dimension column are needed. The following are the different categories of contribution analysis.
- Total Contribution: It gives the cumulative sum of a measure column present within the dimension column. Example: The total ratings (measure) for the top 10 agents (dimension column) with the highest number of escalated tickets.
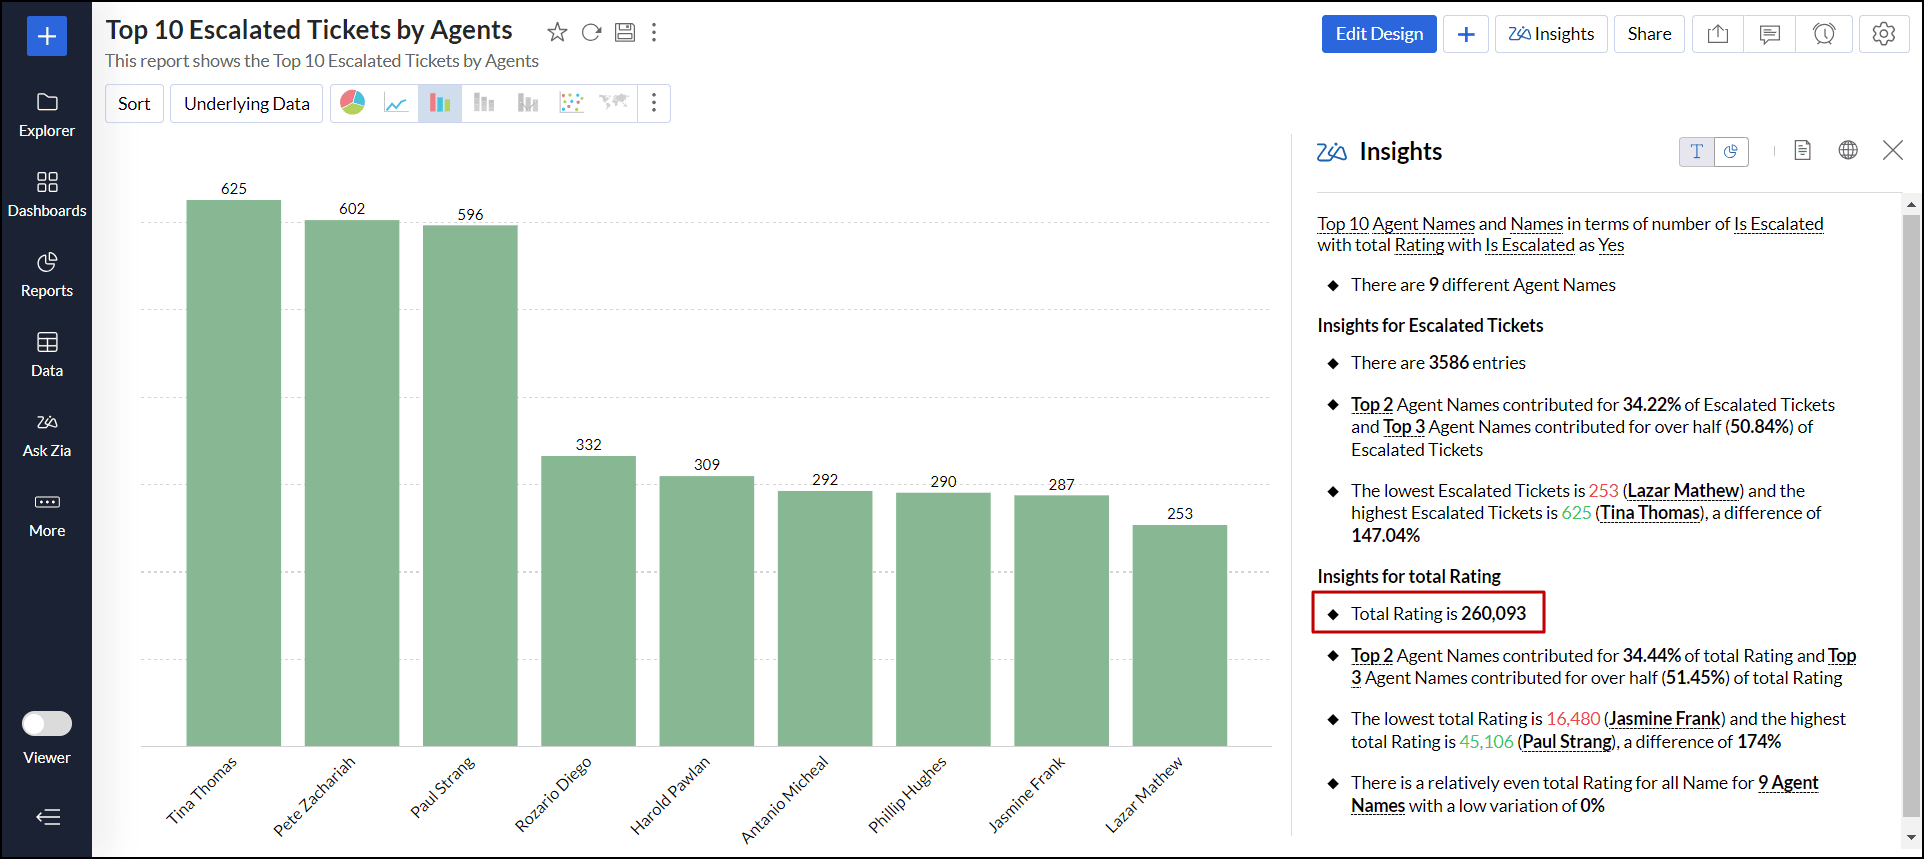
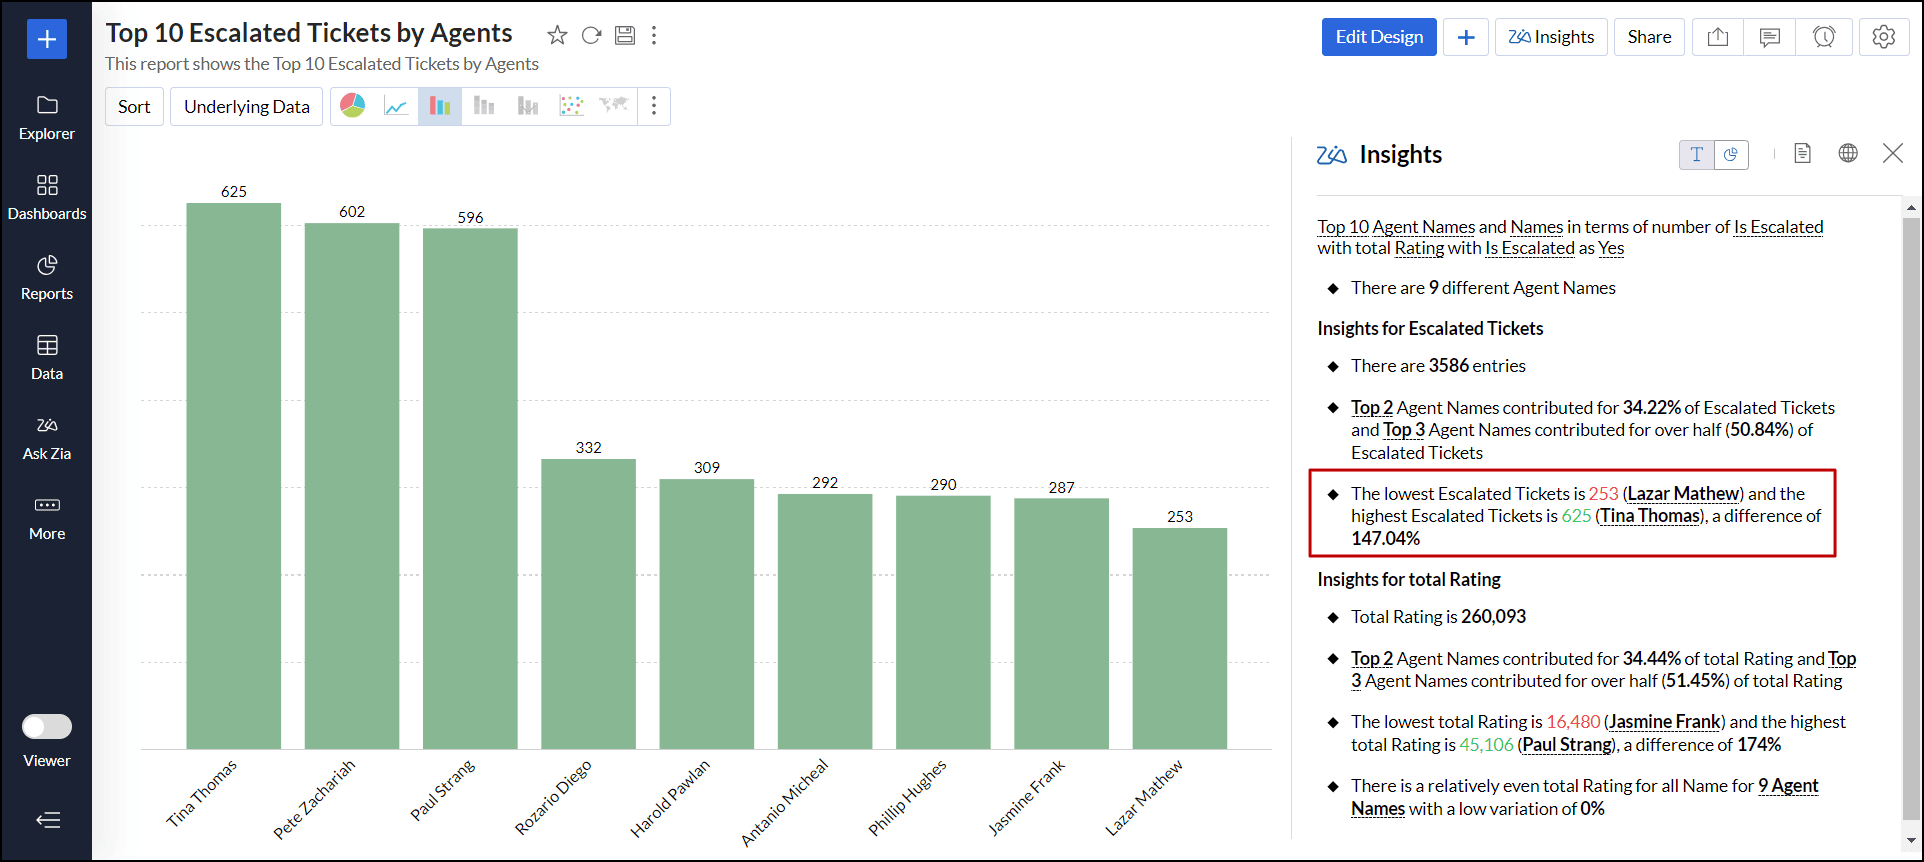
- Extreme Value (Min and Max): It highlights the most and least performing factors, providing a clear understanding of the range and variability. Example: Displays the agent name with the lowest number of escalated tickets and the highest number of escalated tickets.
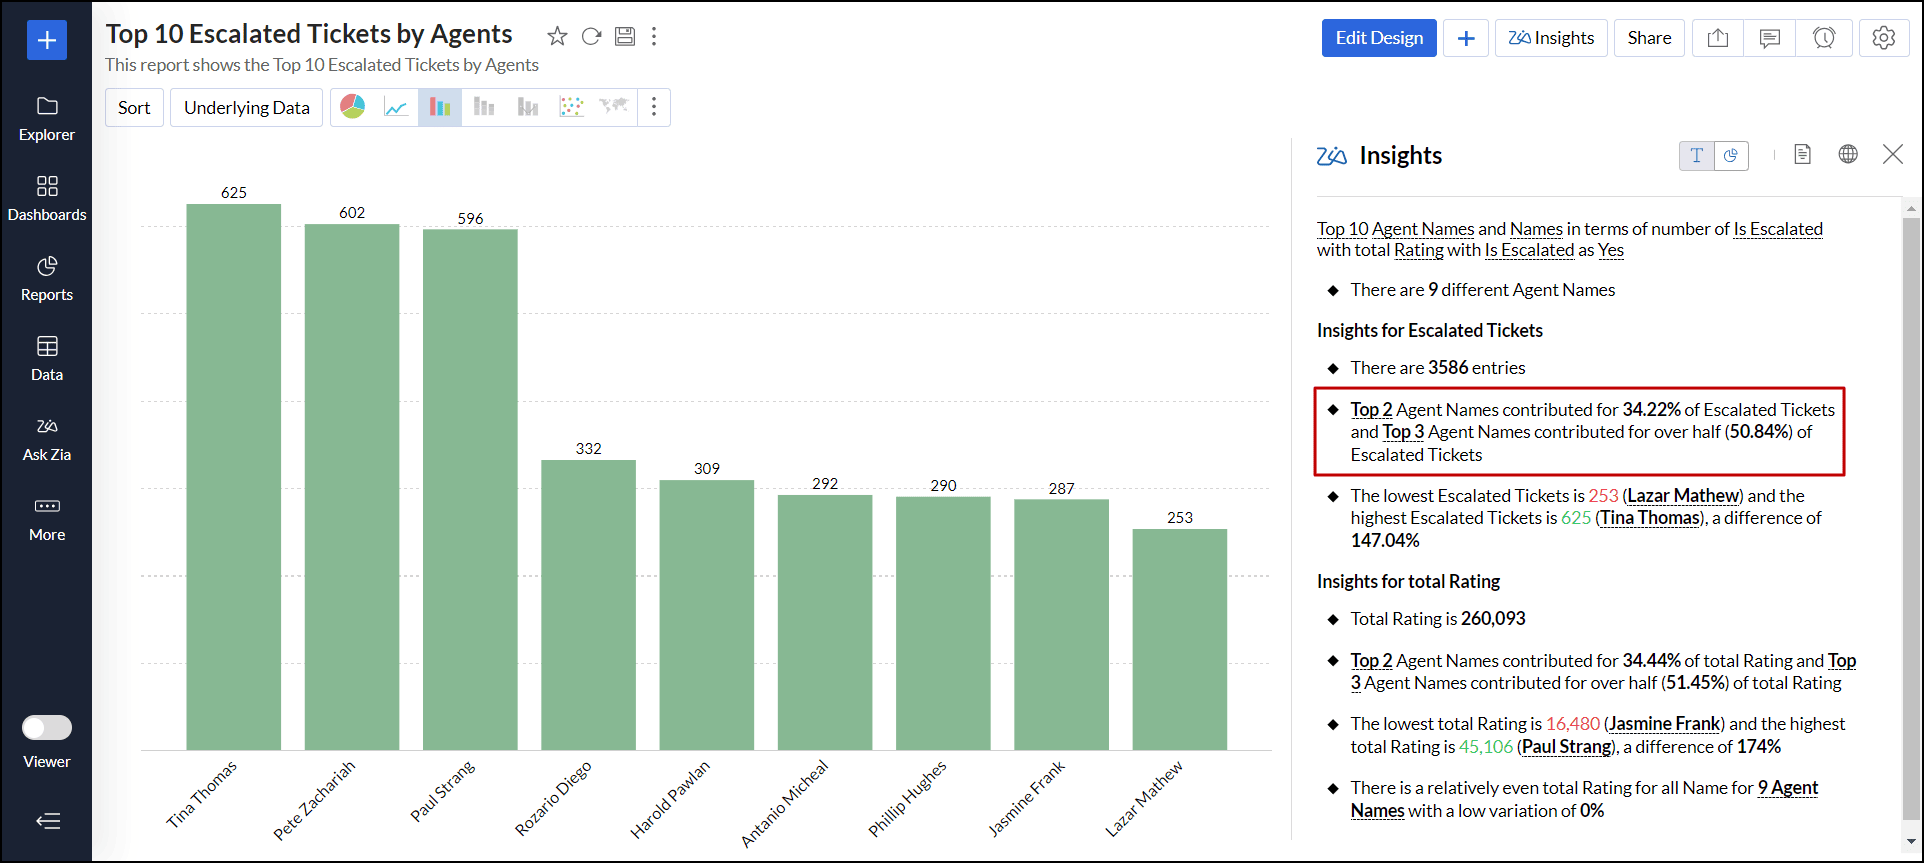
- Top Contributions: Gives the factor that contributes the most to the overall result of a metric. Example: Provide the name of the top agent who contributed to the overall escalated ticket count.
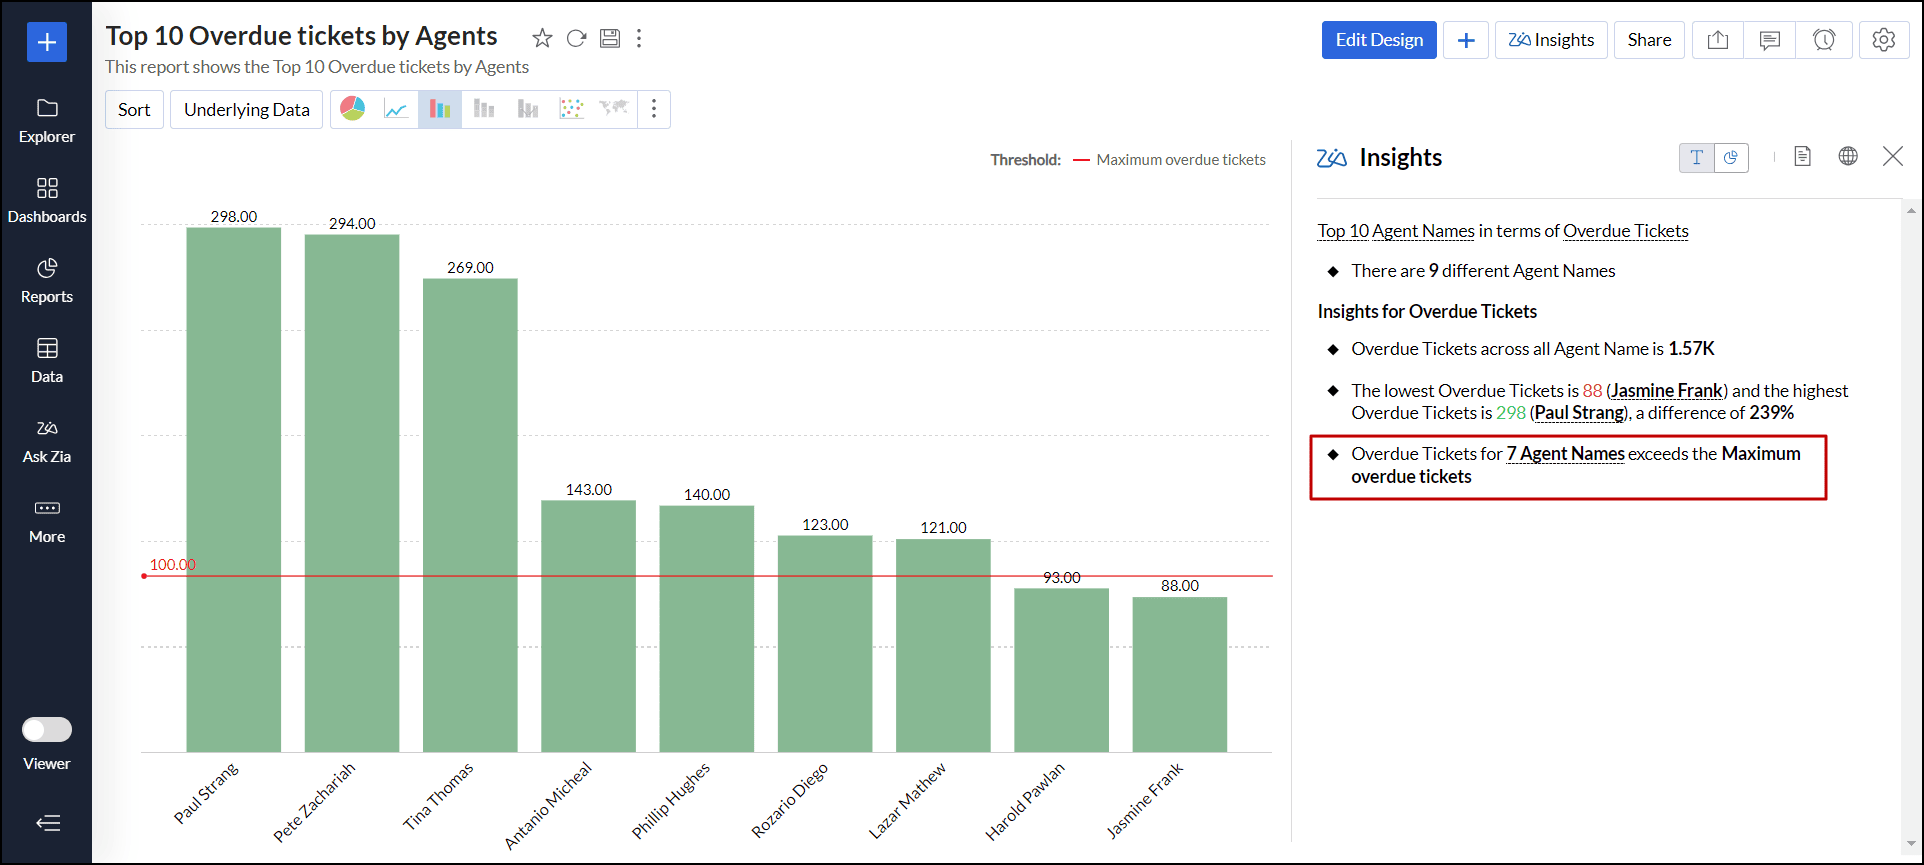
- Exceeding Threshold: It lists the metrics or values that exceed the predefined threshold. Example: It shows the total number of agents whose overdue tickets exceed the defined threshold.
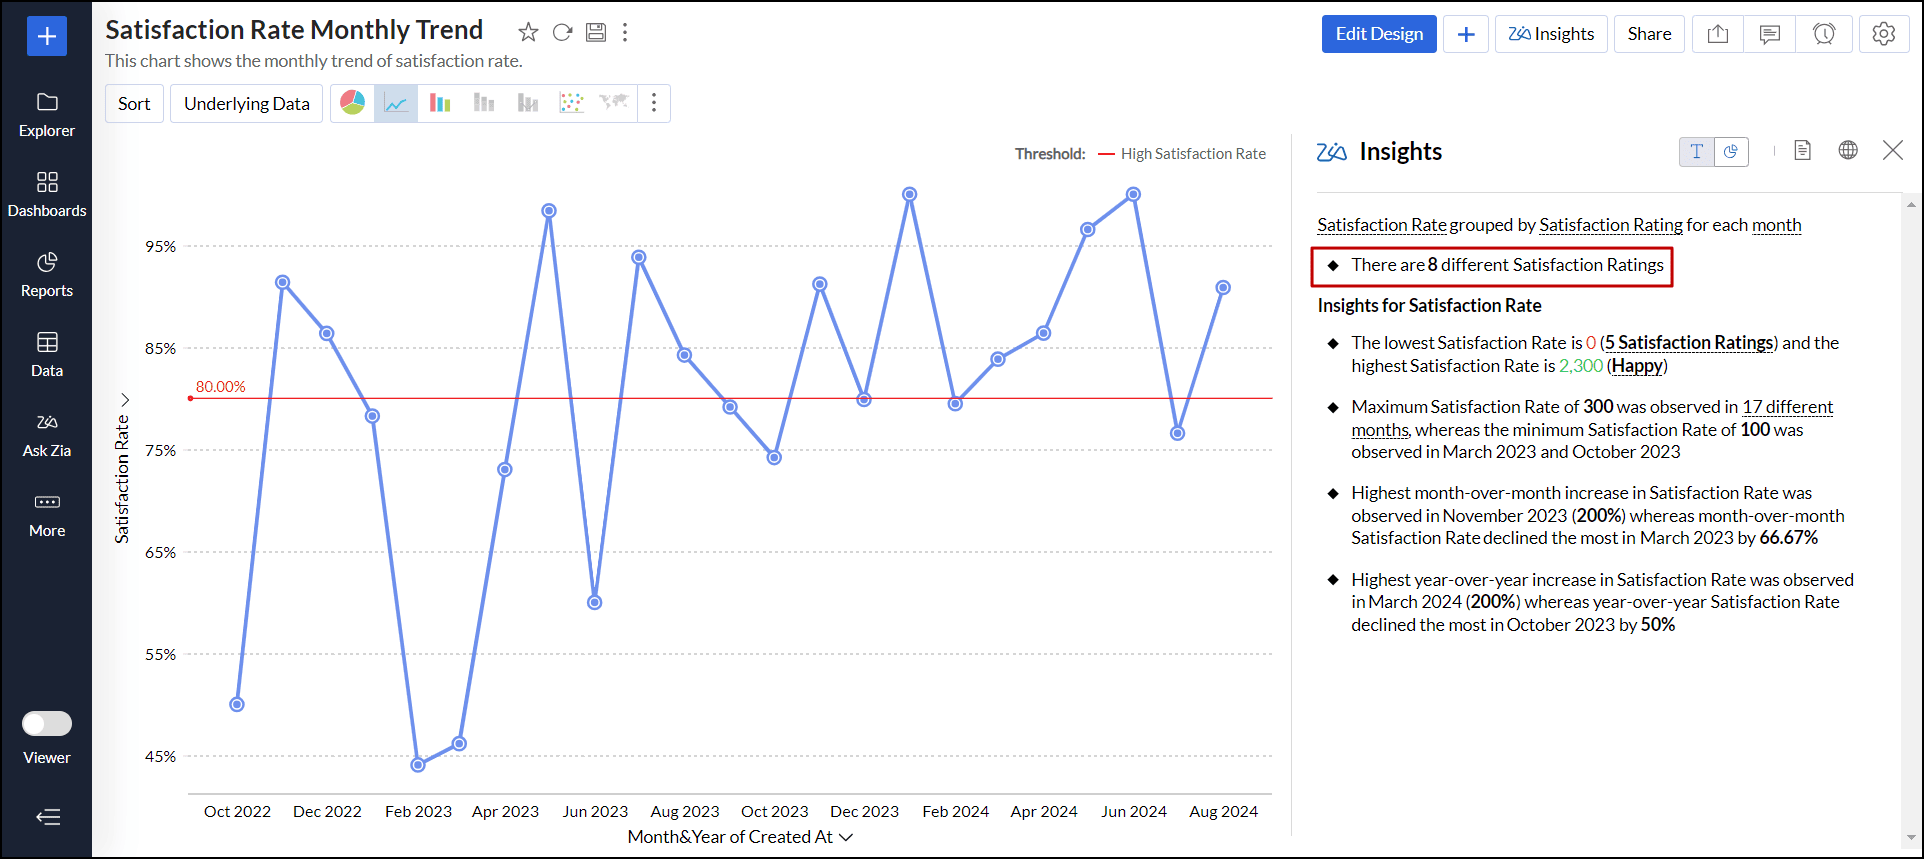
- Value in Categories/Dimensions: It refers to the number of different values or categories present in a dimension. For example, the chart has eight different satisfaction ratings.
- Variance of contribution within categorical values: It identifies the metric that deviates across all dimensions.
Time series insights
Time Series Insights focuses on identifying trends, patterns, and fluctuation in data collected at regular time intervals. It helps to uncover insights, such as identifying trends, detecting anomalies, and forecasting future outcomes based on historical patterns. To generate time series insights, at least one time series column, such as a date, is necessary.
The following are the different types of time series insights.
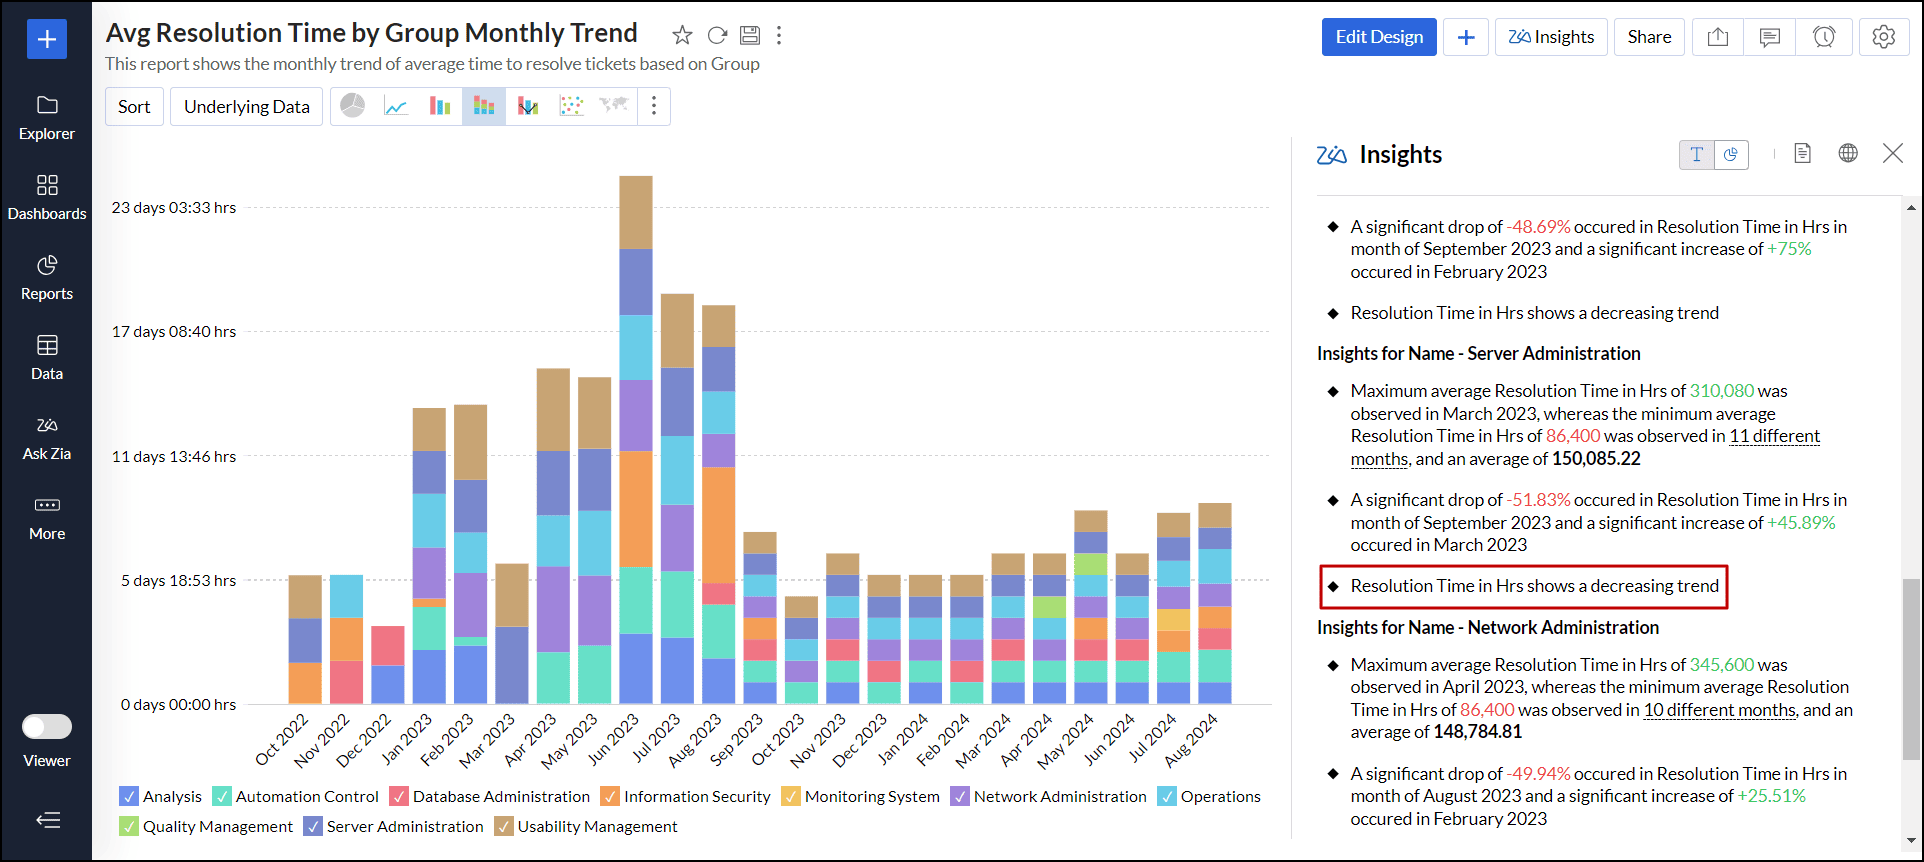
- Trend: It shows how a particular measure changes, whether it is increasing, decreasing, or remaining stationary over a period of time. Example: The average resolution time for the Server Administration group has decreased over time.
- Seasonality: It helps understand the recurring patterns or fluctuations in data that happen at regular intervals due to seasonal factors. Example: The ticket resolved monthly trend report shows seasonality every seven months, experiencing highs in month four and lows in month 6.
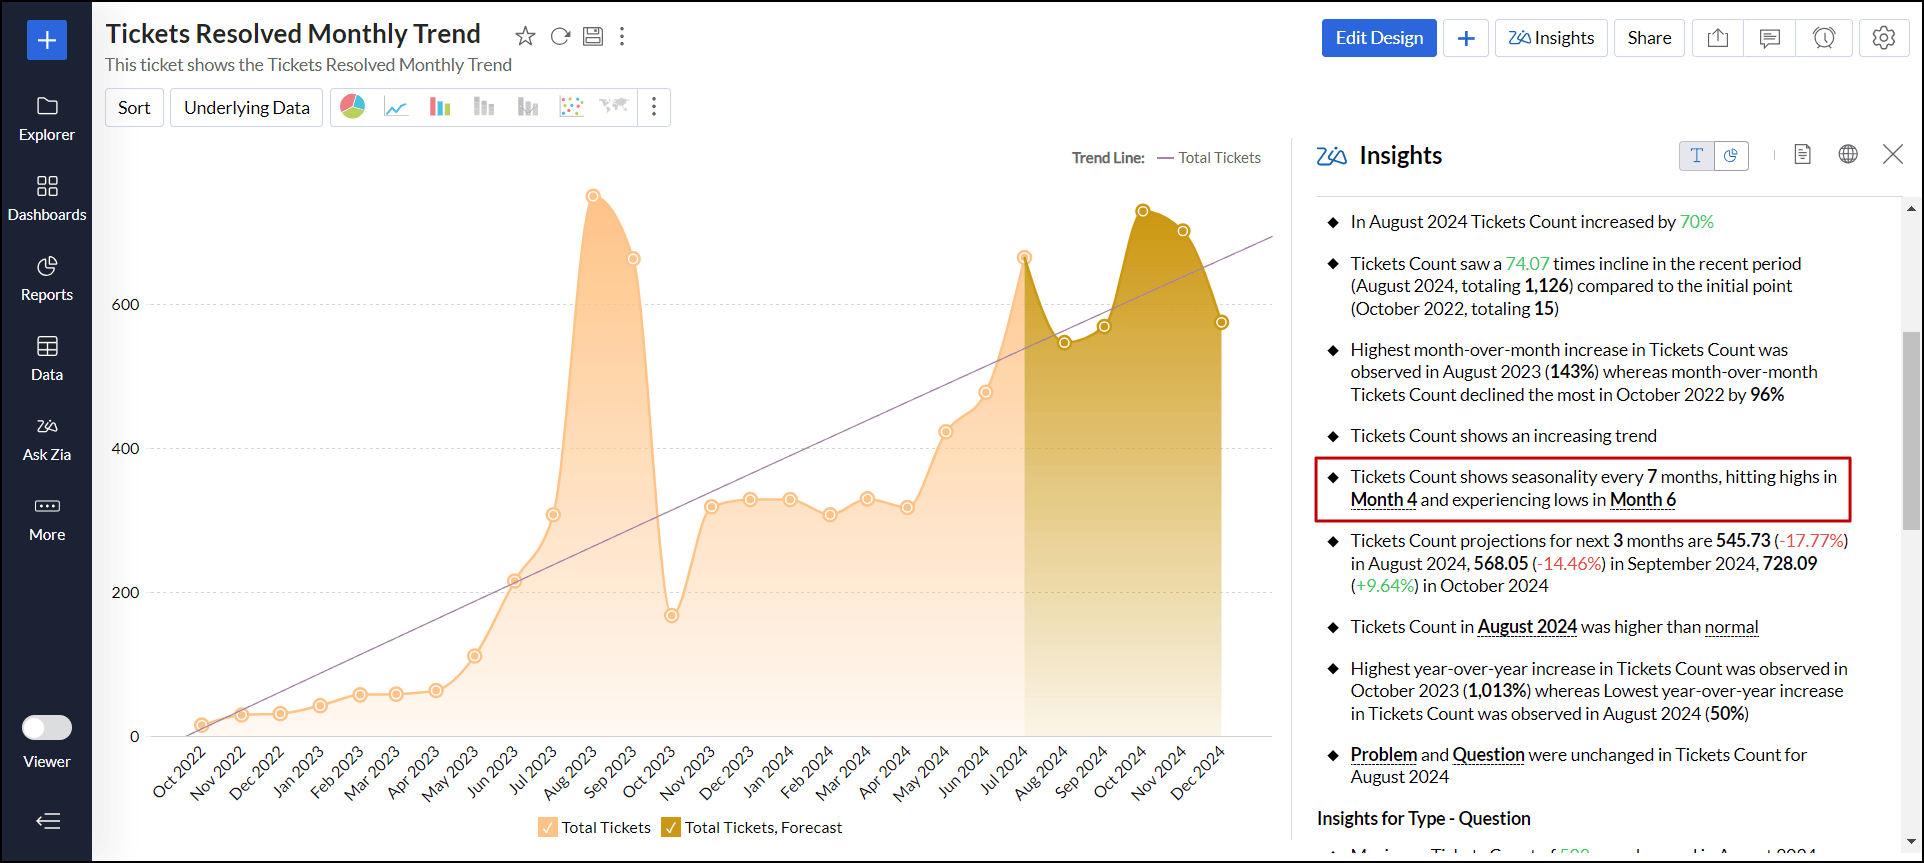
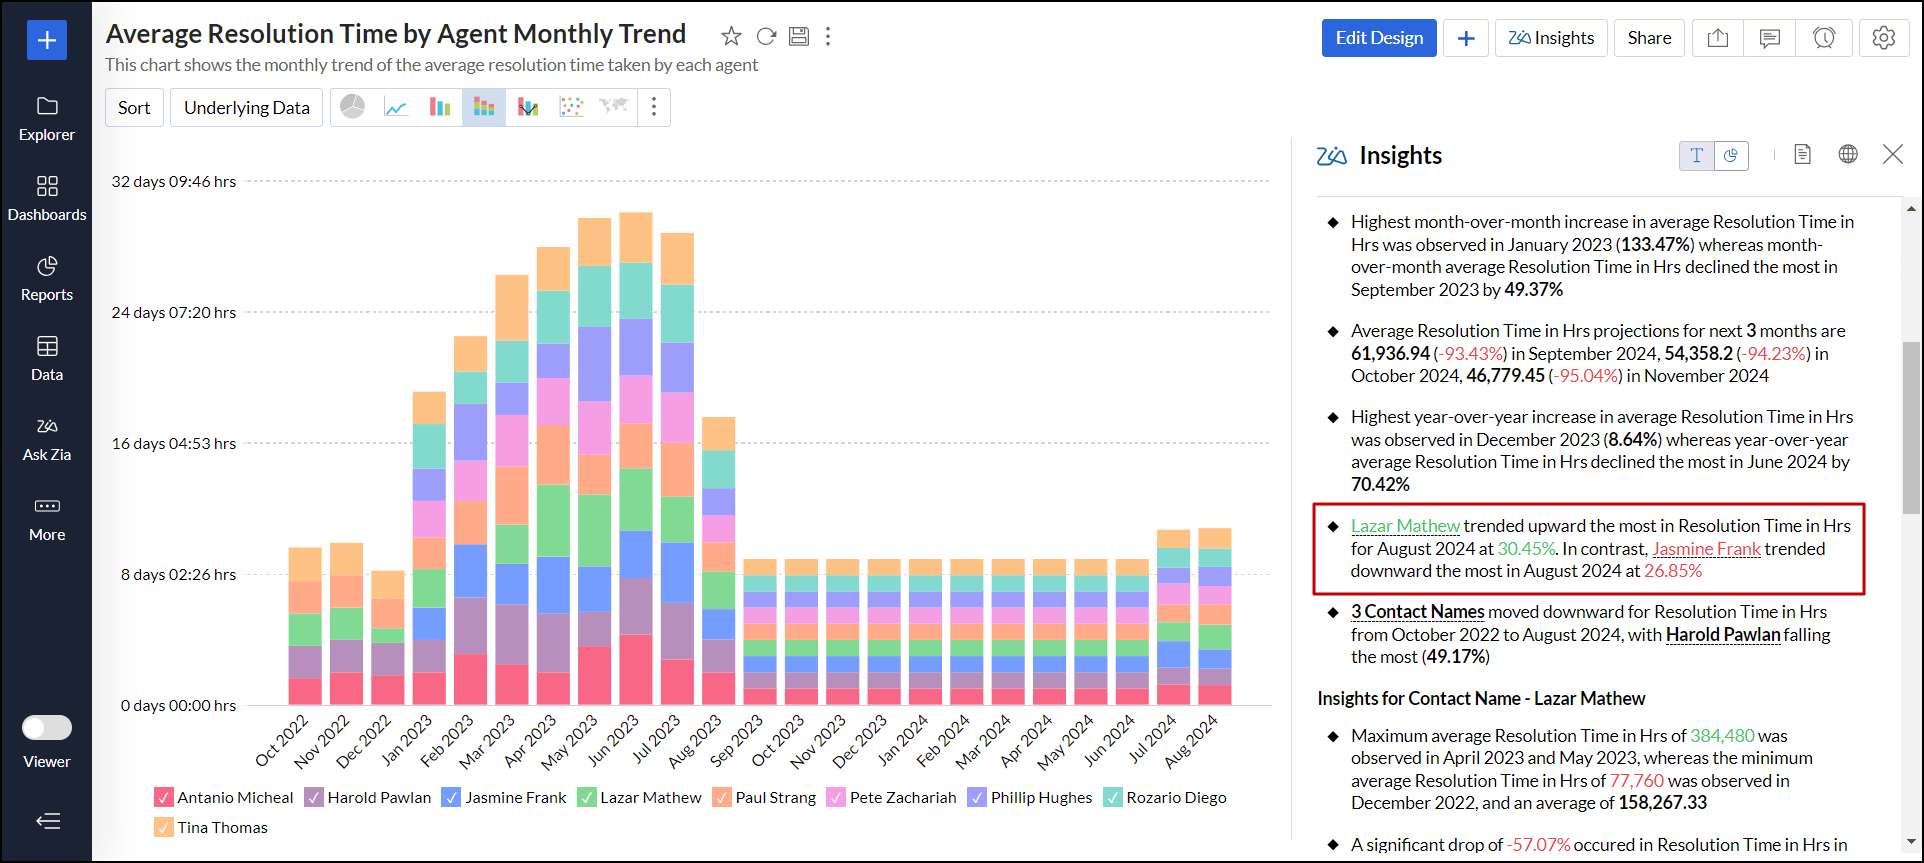
- Forecasting: This predicts the future values based on the historical data. Example: Forecasts the average resolution time for the next three months.
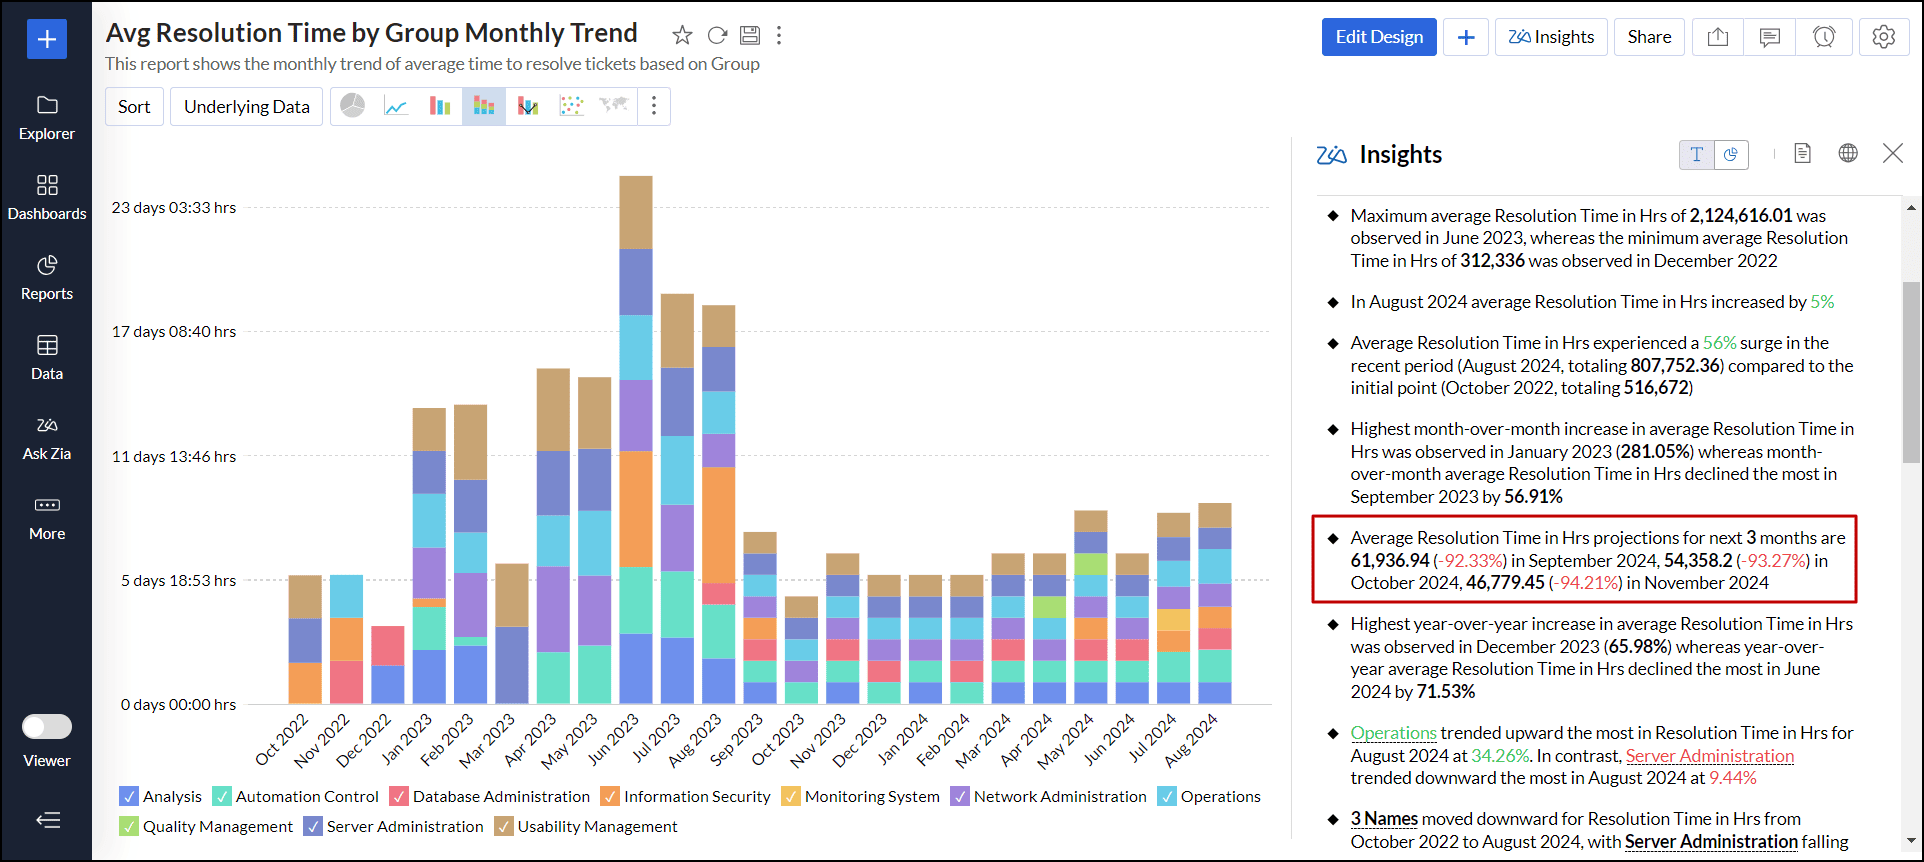
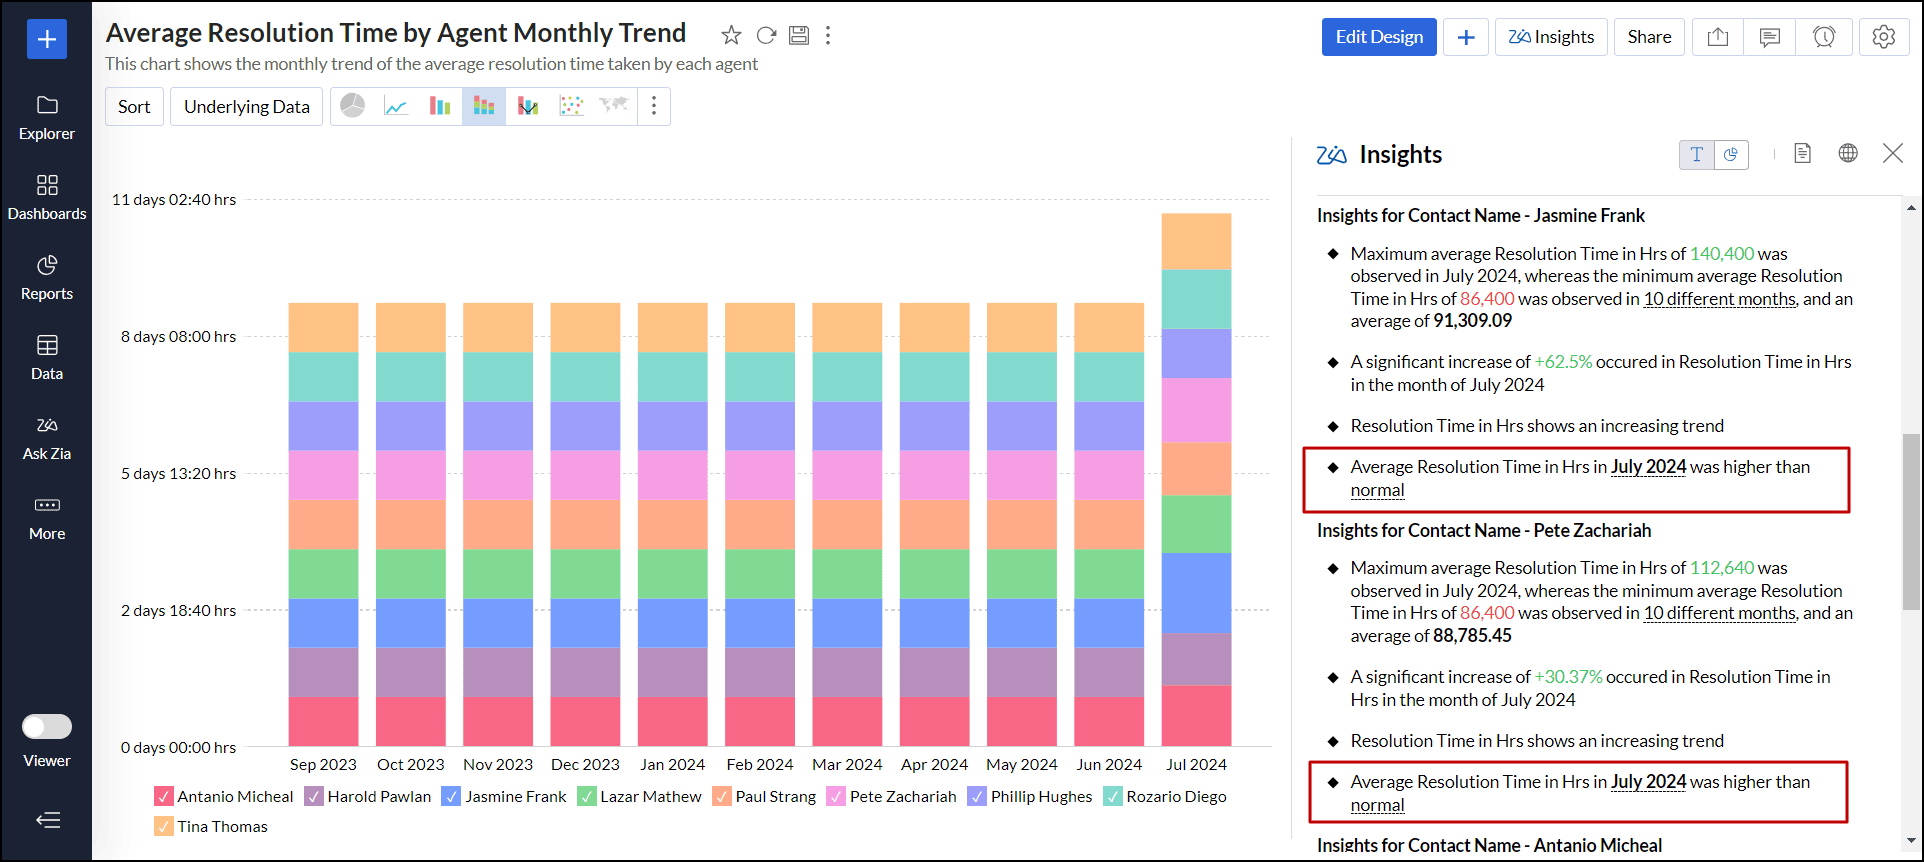
- Anomalies: It highlights the data points that significantly deviate from the observed trend. Example: Indicates the month at which the average resolution time is higher than normal.
Comparison between dimensions
This option compares different parts of a dataset to see how they relate and impact the overall results. To generate insights based on the comparison between dimensions, at least one measure column and two-dimensional columns are required.
- Trend across Series: It shows the performance trends of each value within a dimension over time. Example: It provides the most and least performed agent names based on the resolution time.
- Variance across Series: It shows the degree of variability of categorical values in a dimension over a period of time.
Analysis of Measures
The analysis of measures computes the relationships between different measures and their respective proportions. To generate insights based on the comparison between dimensions, at least one measure column and two-dimensional columns are required.
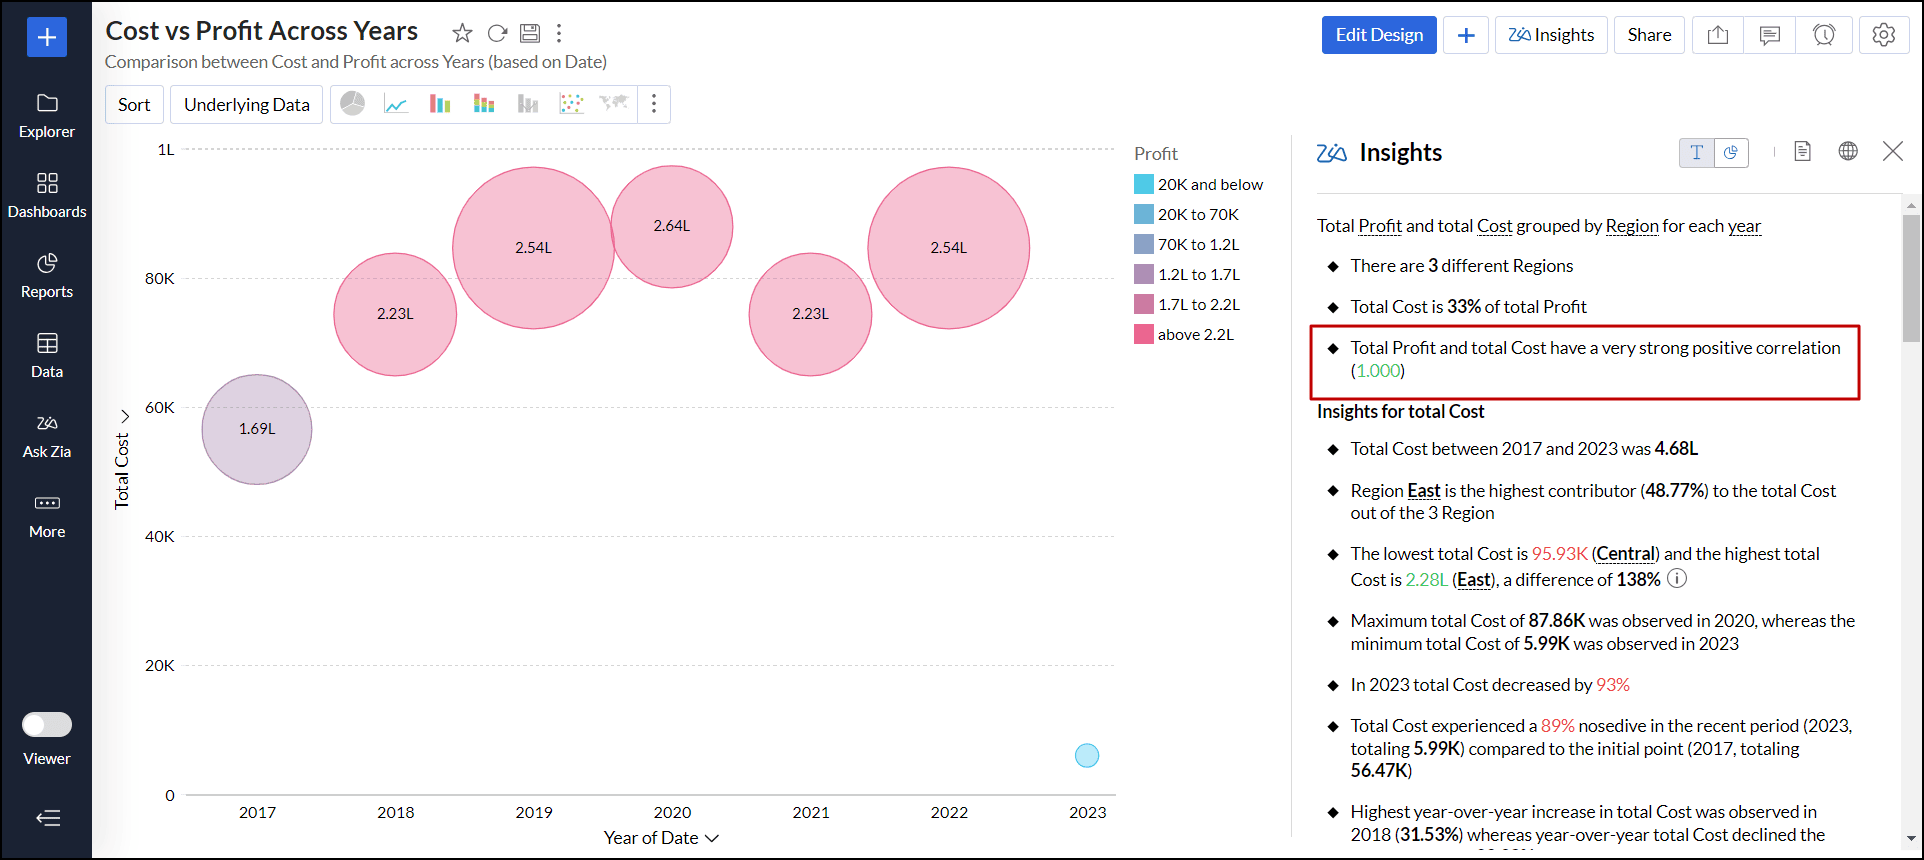
- Proportion of One Measure to Other: It describes the percentage of one measure with another. Example: Provides the percentage of total cost compared to profit.
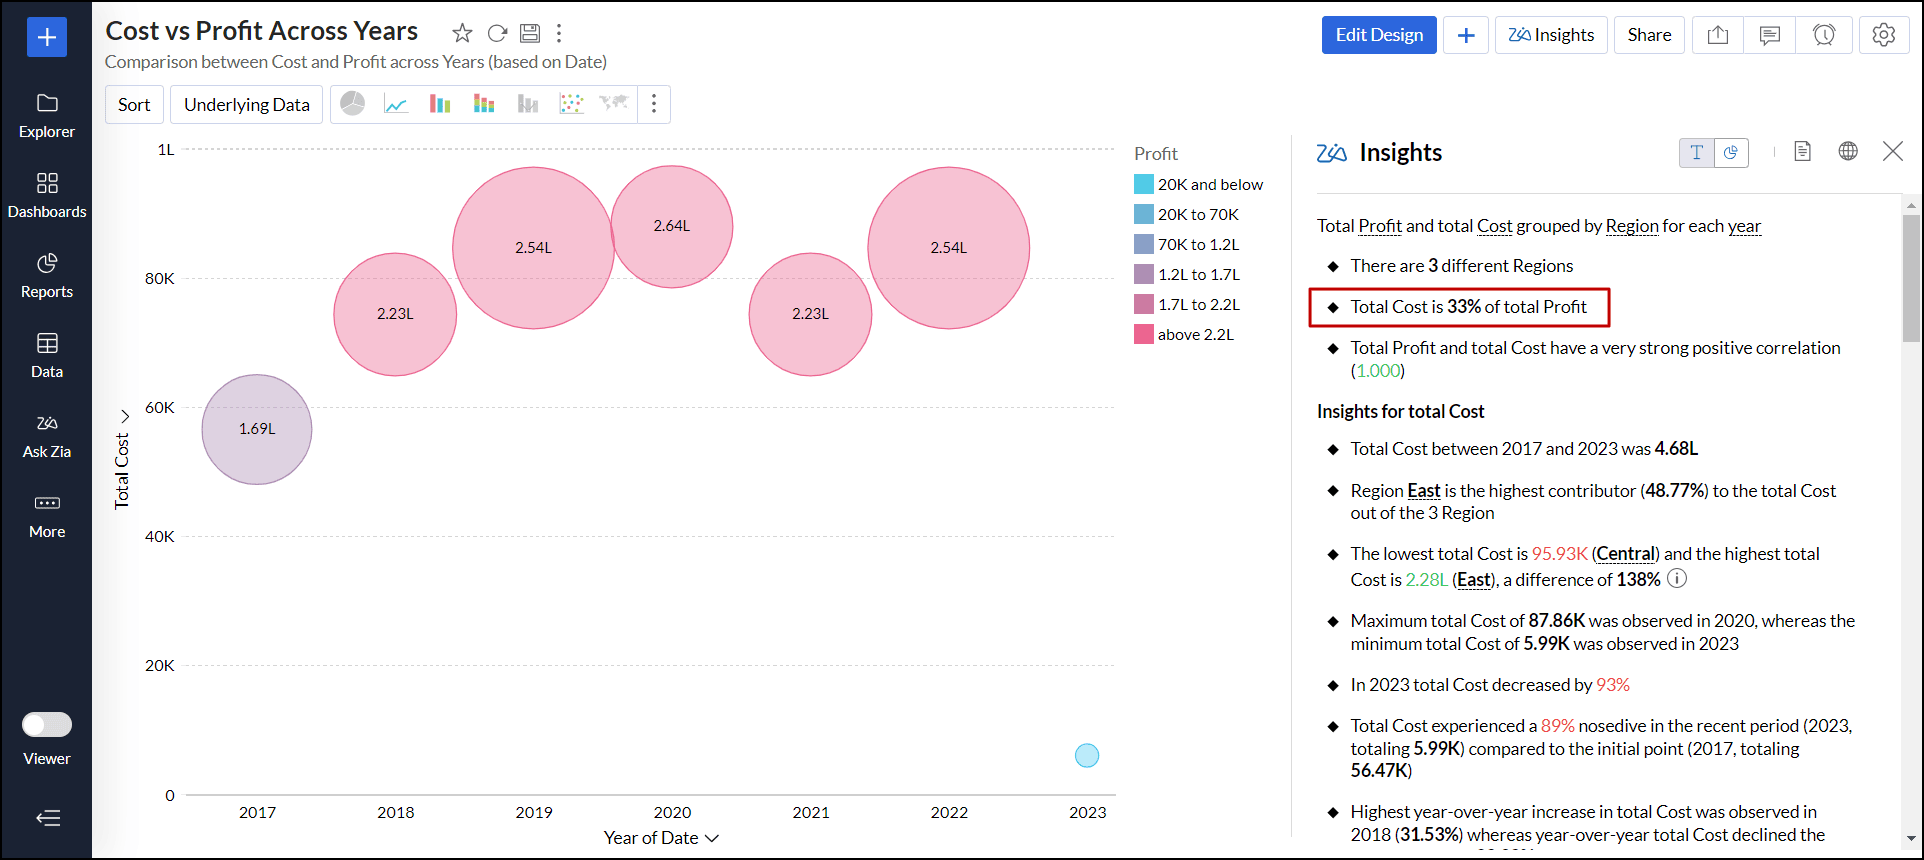
- Correlation Between Measures: It explains the degree of relationship between two measures. Example: Shows the degree of correlation between cost and profit.