Constructing Questions for Ask Zia
Ask Zia understands the underlying intention of your questions, and generates appropriate reports accordingly. However, similar to the communication gaps in human interactions, there may be some miscommunication while using Ask Zia.
This section details how you can best communicate with Ask Zia.
Constructing questions
Ask Zia provides the flexibility of putting forth questions in any format, regardless of the phrasing or the words used. Here are the different types of questions you can use with Ask Zia.
Structured questions
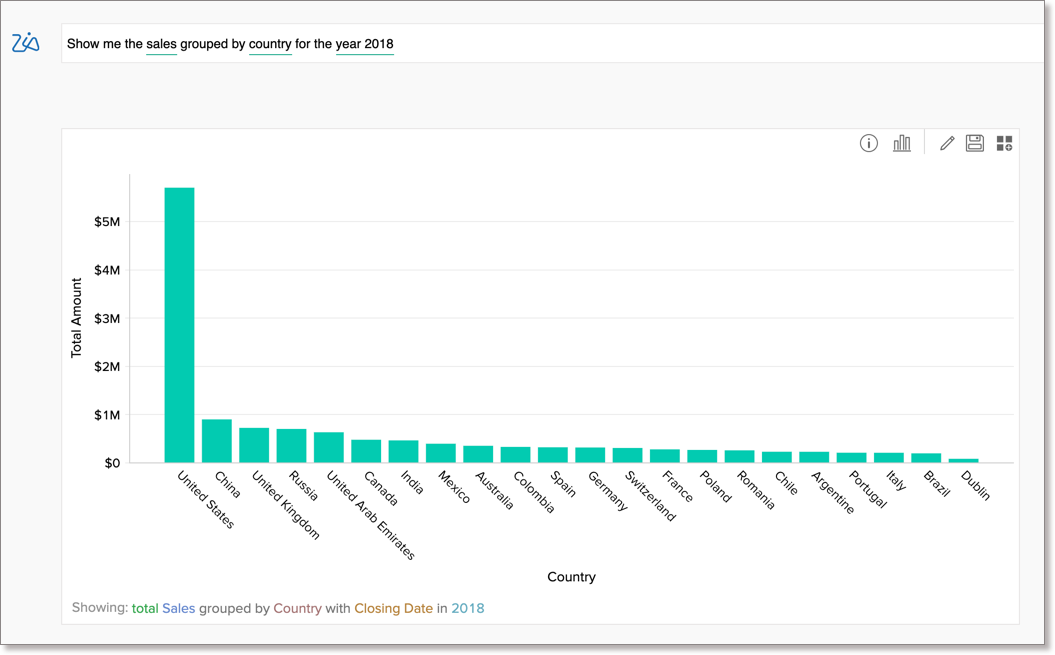
Questions that are fully formed structured sentences can be used with Ask Zia. For example,
Show me the sales grouped by country for the year 2018
Unstructured questions
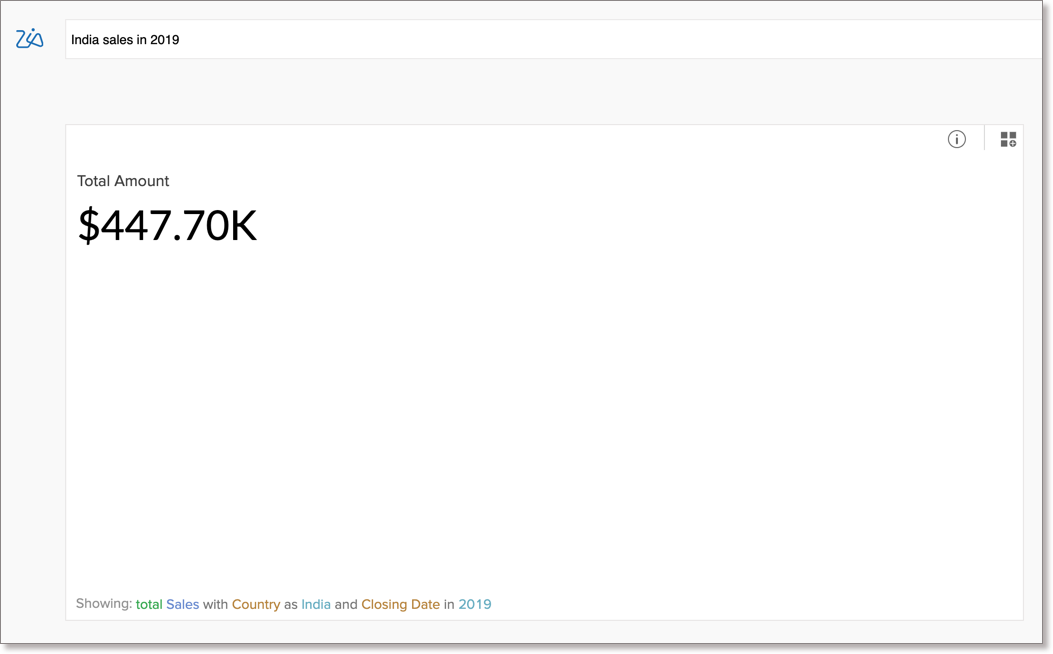
Fragmented and incomplete sentences can also be posted as questions to Ask Zia. For example,
India sales in 2019
WH questions
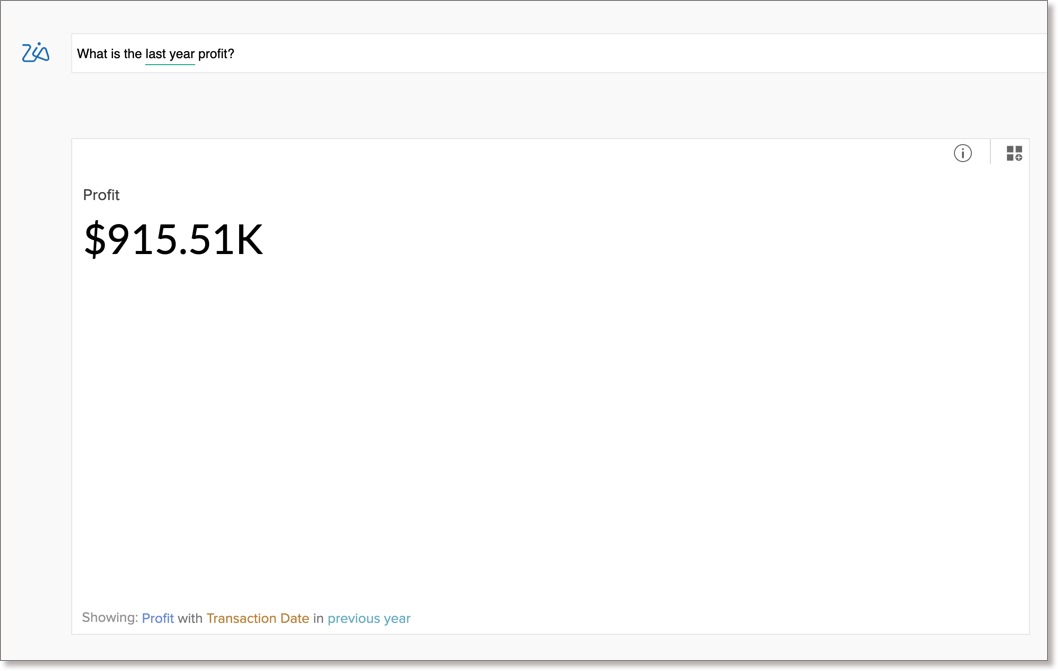
WH Questions (i.e. questions starting with 'When', 'Where', 'How', etc. ) are acceptable in Ask Zia. For example,
What is the last year profit?
Explicit information
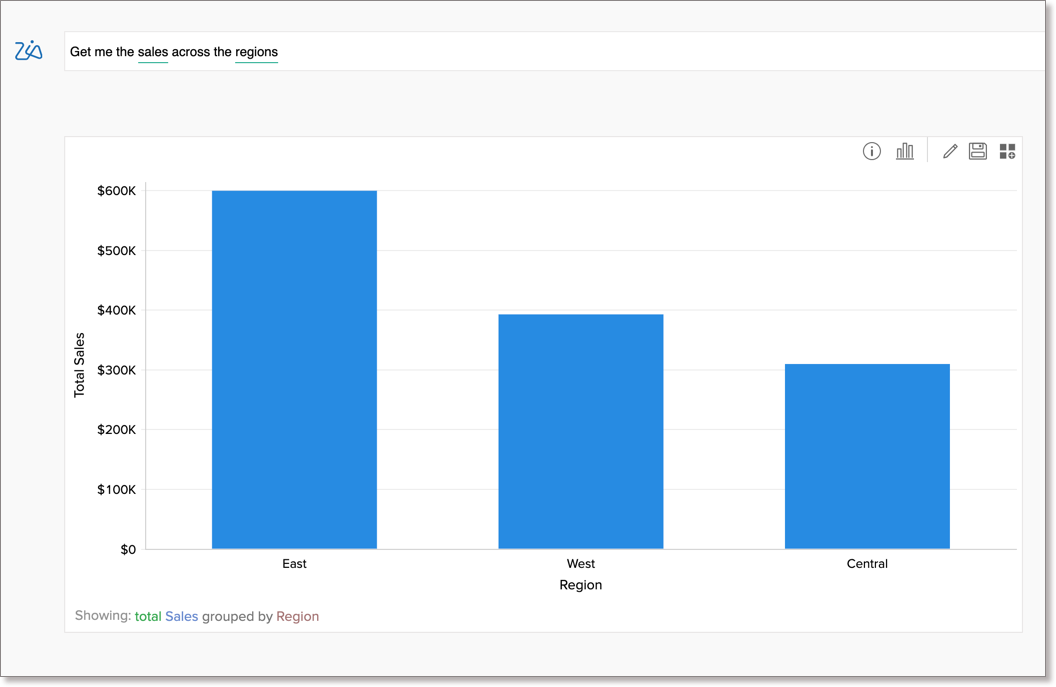
Questions that contain explicit information (i.e. names of columns present your tables) can be used in Ask Zia. For example,the below question will generate a chart of region wise sales, where Sales and Region are two columns from the Sales table.
Get me the sales across the regions
Implicit information
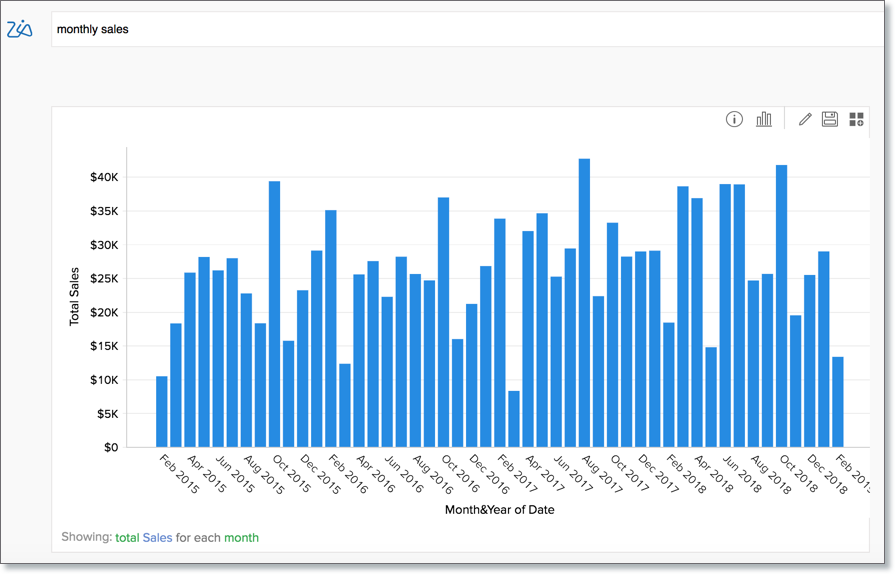
Phrasing questions that contain terms that refer to, or imply, some of the columns present in tables are acceptable in Ask Zia. For example, the below question displays your sales across each month. In this scenario, Ask Zia will identify the term 'Monthly', relate it to a date column and display the corresponding values.
Monthly Sales
Column Value
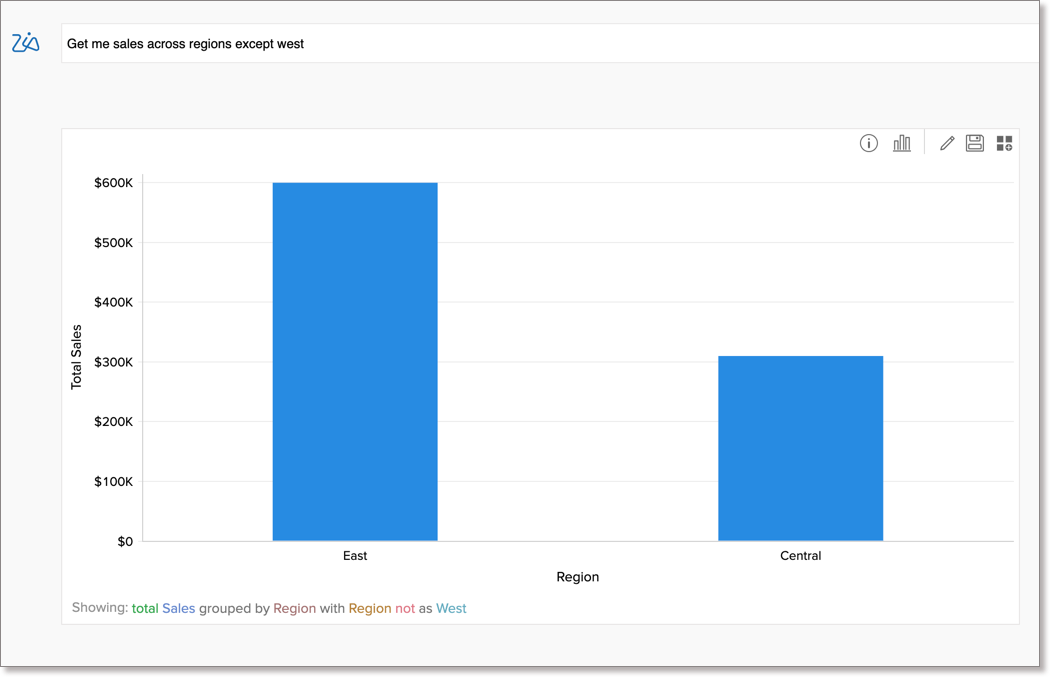
You can phrase questions about the data present in different columns in a table. In this case, Ask Zia identifies the word West as a value in the column Region, and displays a chart filtering out that value.
Get me sales across regions except west
Across tables
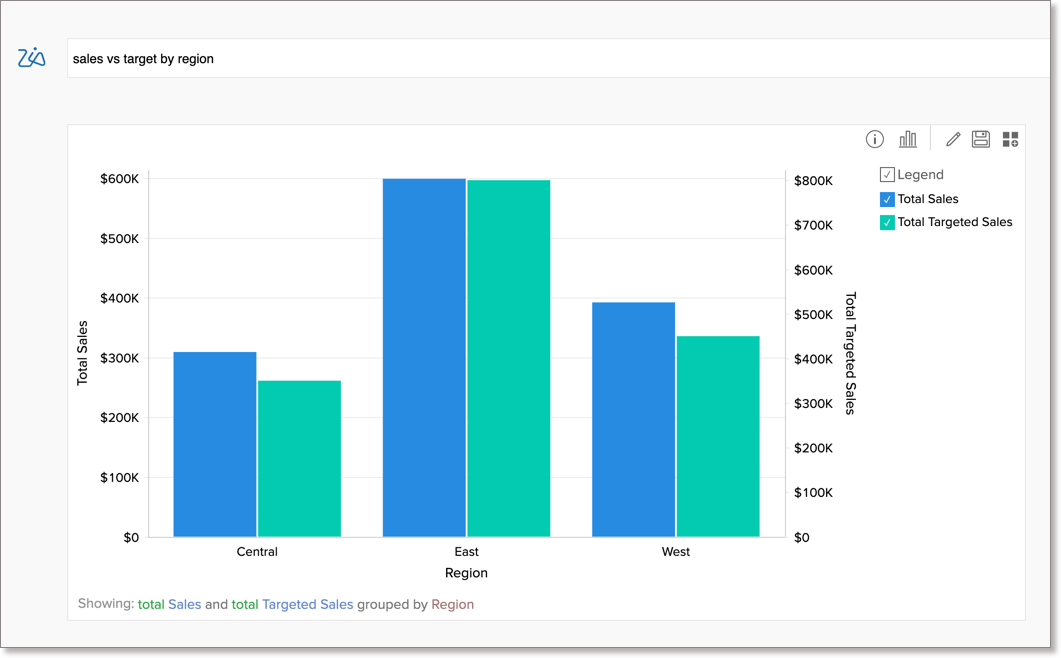
You can ask for metrics across tables in your dataset. Ask Zia will interpret it based on how you have joined the tables using Lookup column. In this example, the column Sales is from the Sales table and the column Targeted Sales is from Regional Target table.
sales vs target by region
Formula Columns
Questions can also be posted about formula metrics created over data tables. For example, 'Region wise profit for 2018', displays the profit distribution for the year 2018, where Profit is a formula column created over the Sales table. Click here to know more about formulas.
Typographical Error
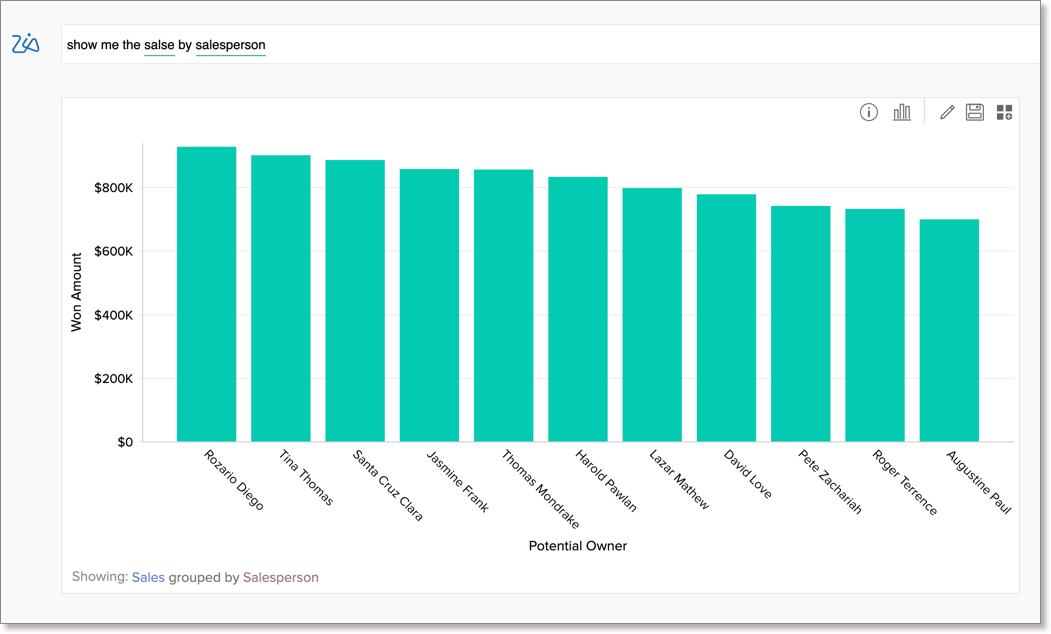
Your question can contain a typographical error. Ask Zia can interpret questions with incomplete, incorrect words. In this case, the term 'salse' will be matched with sales
Show me the salse by salesperson
Functionalities of Ask Zia
Ask Zia provides the following functionalities:
- Ask for metrics
- Apply summary functions
- Statistical Measures
- Group metric columns
- Apply filter criteria
- Sort Data
Ask for a Metric
You can ask for a single metric or multiple metrics in a question like sales, my top salesman, what is the most sold product, etc.,
Single Metric
You can ask for a single metric in your question. The following question will get the total profit for last year as a numeric KPI widget.
What is the last year profit?
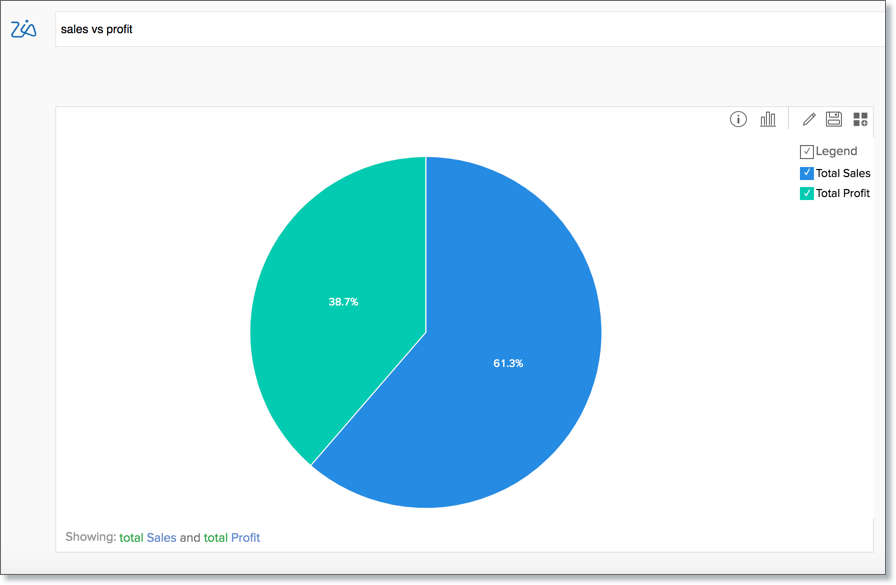
Multiple Metrics
You can ask for multiple metrics in a question. The below question gets Total Sales and Total Profit as a pie chart.
Sales vs profit
Apply Summary Functions
Zoho Analytics provides a wide range of summary functions like Sum, Count, Average, Running Total etc., Ask Zia will try to apply the best possible function over your column. You can choose to change them in your question.
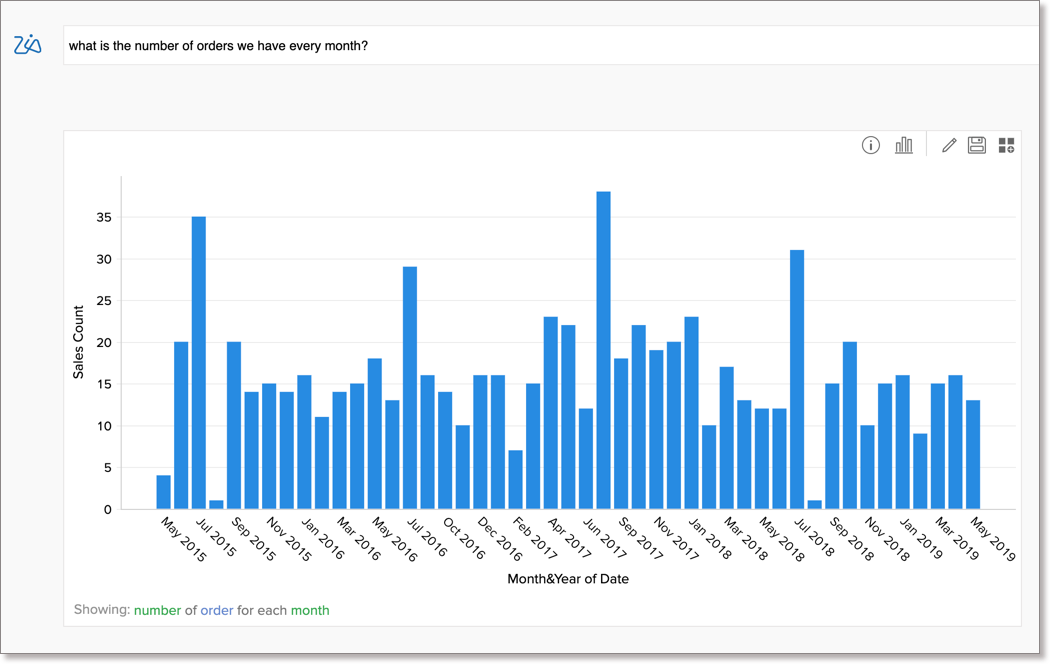
Summary Function
You can choose the apply the supported summary functions over a metric column by explicitly specifying them in your question. The below example applies count over the sales column and plots it across months.
what is the number of orders we have every month?
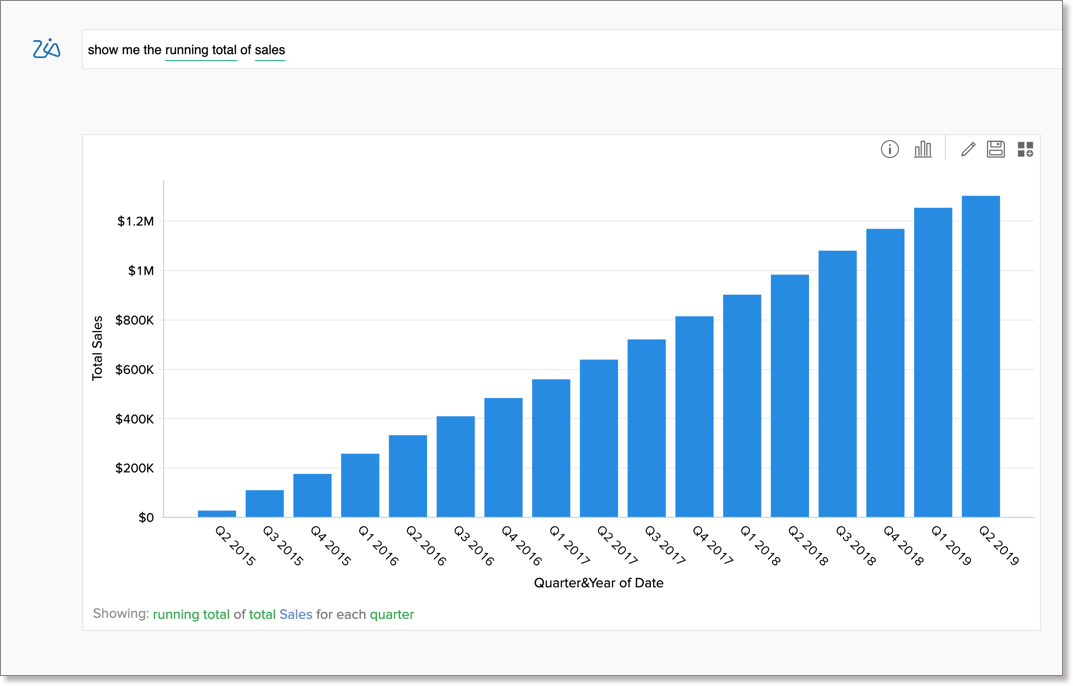
Advanced Summary Function
Ask Zia can also apply advanced summary functions. The below question applies the advanced summary function Running Total over the Sales column and calculates it across the quarters.
show me the running total of sales.
Statistical Measures
Find correlation between metrics
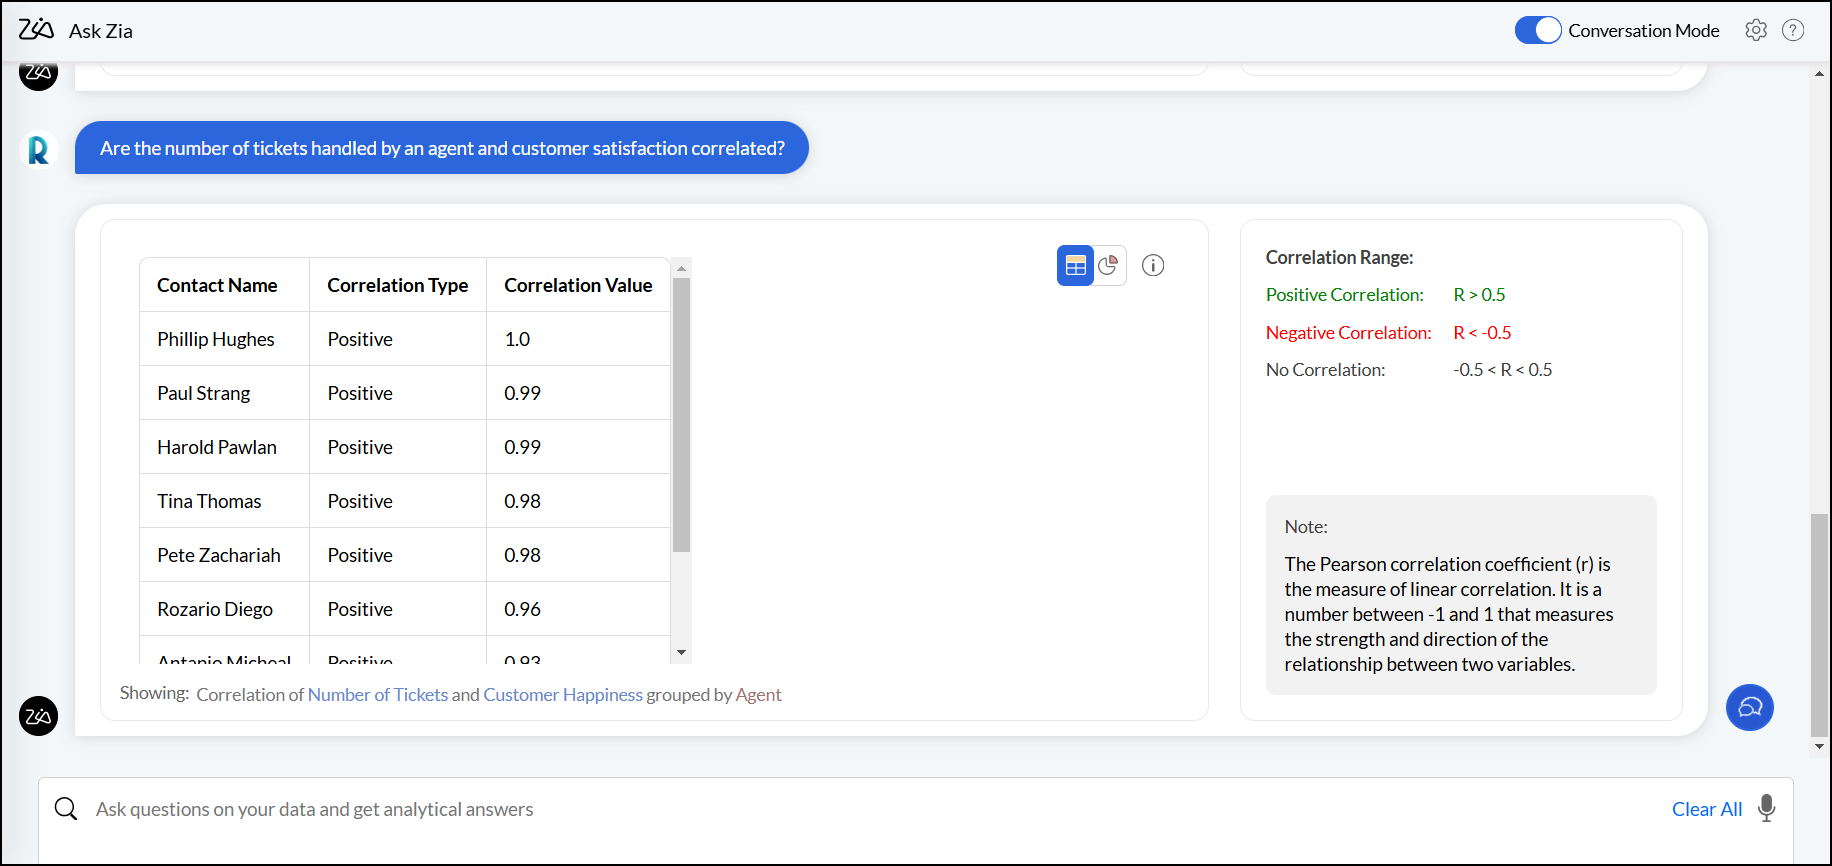
Ask Zia allows you to determine the correlation, a statistical measure that helps to identify how changes in one variable relate to changes in one or more variables. For example, in help desk metrics, how different factors like response time and resolution time affect customer satisfaction scores.
Zia calculates the correlation using Pearson's Correlation Coefficient, which is the ratio of the covariance between the two variables to the product of their standard deviations.

The value of the Pearson's Correlation Coefficient ranges from -1 to +1.
- R > 0.5 (Positive Correlation): When one variable increases, the other variable also increases.
Example: Are the number of tickets handled by an agent and customer satisfaction correlated?
Positive correlation suggests that agents who handle more tickets are also receiving higher customer satisfaction scores. This could indicate that high-performing agents are both fast and efficient in resolving customer issues.
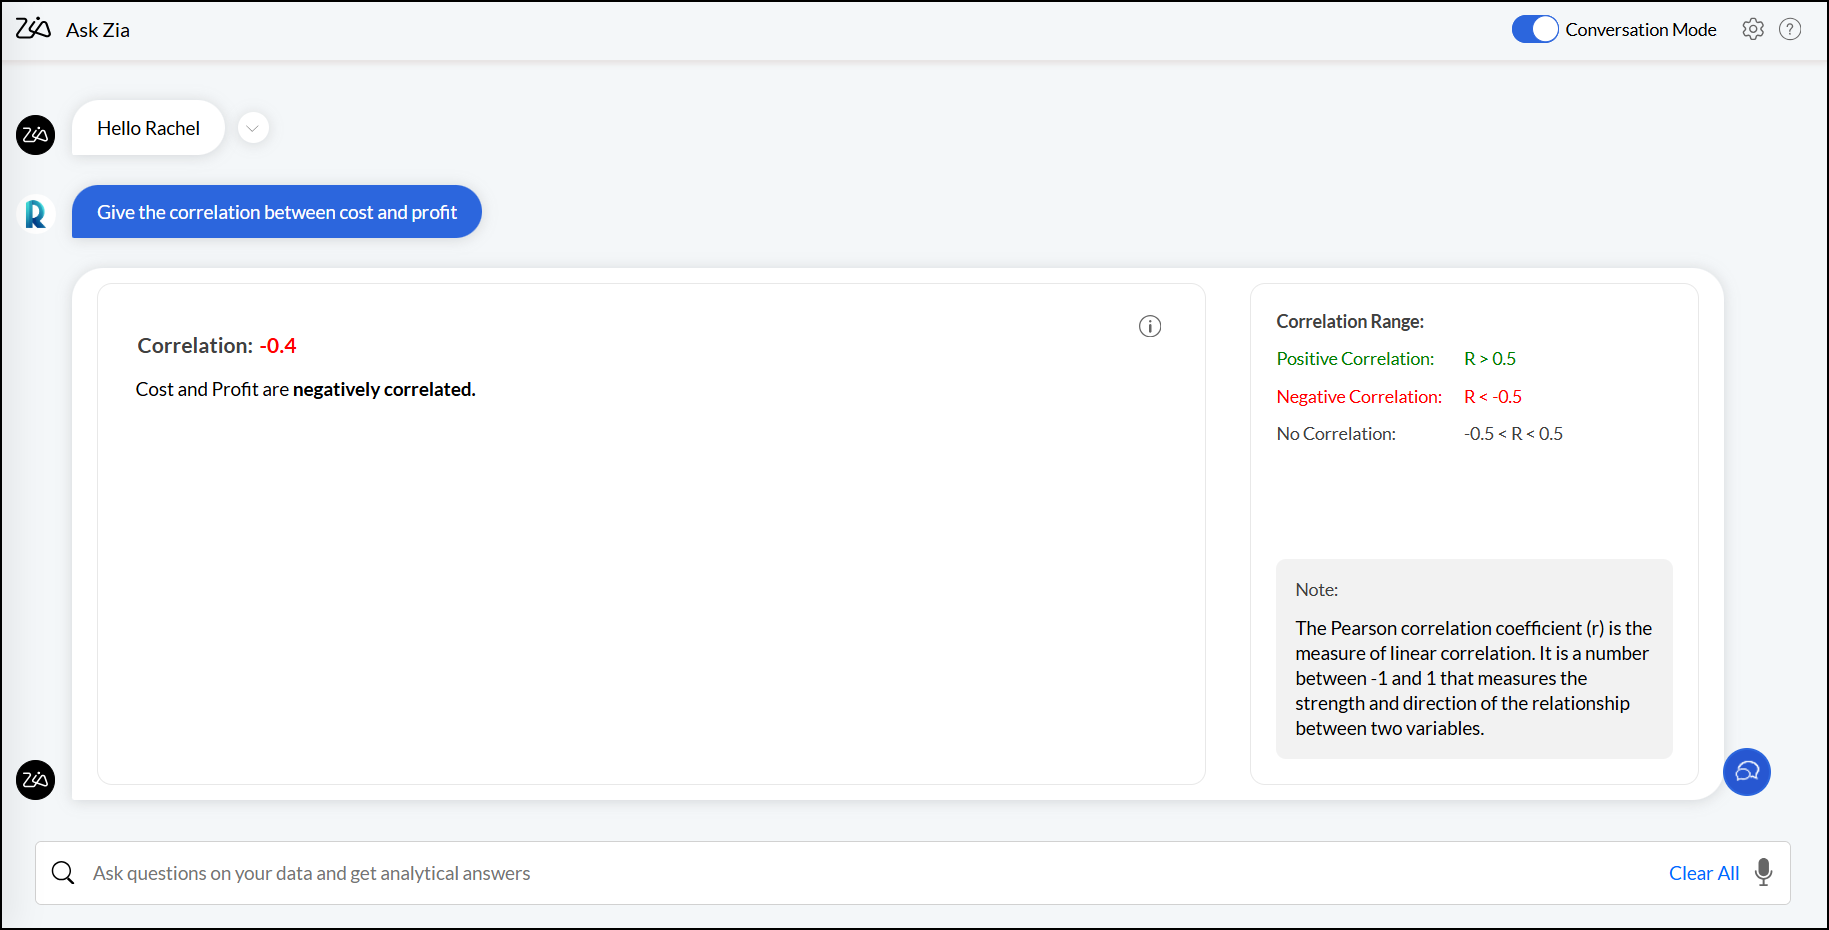
- R < - 0.5 (Negative Correlation): When one variable increases, the other decreases.
Example: Give the correlation between cost and profit.
Negative correlation suggests that as production costs increase, the profit decreases. This is typical in most businesses where increased costs (e.g., material, labor, overhead) erode the profitability of the product unless prices are adjusted accordingly.
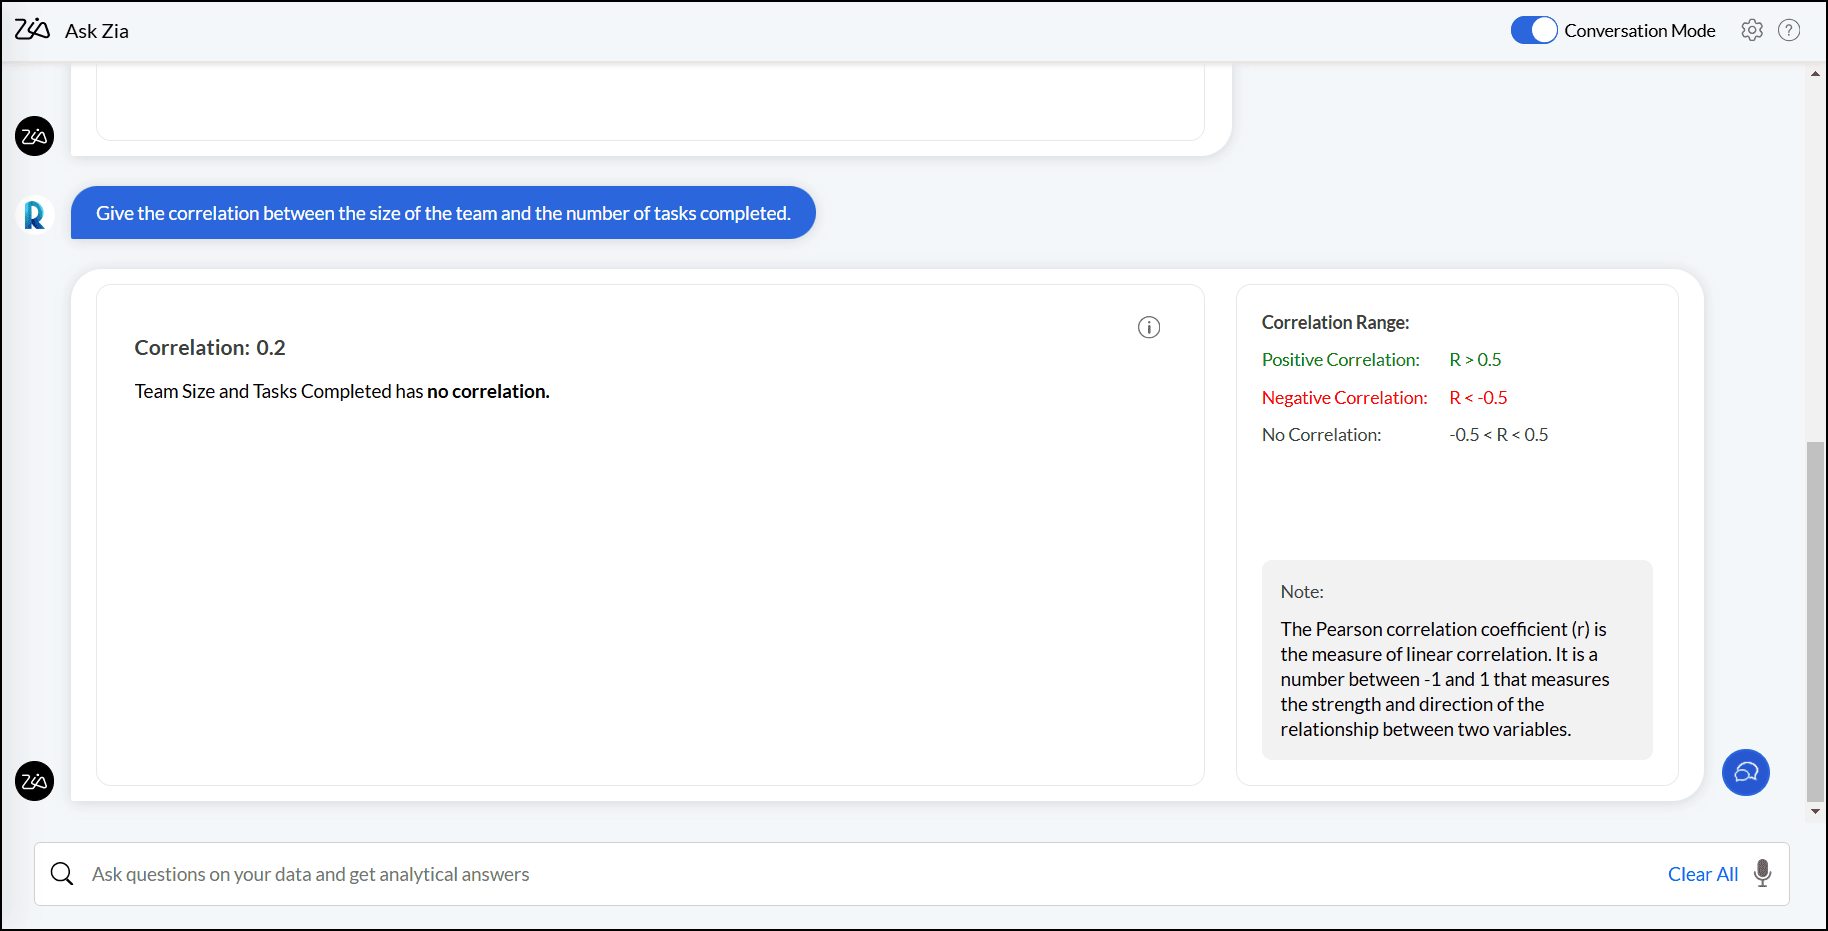
- R value between - 0.5 and 0.5 (- 0.5 < R < 0.5) (No Correlation): If there is no discernible pattern of change between two variables, they are said to have no correlation.
Example: Give the correlation between the size of the team and the number of tasks completed.
No correlation indicates no linear relationship between team size and the number of tasks completed. A smaller team might be able to work more efficiently and complete more tasks, while a larger team may take more time to coordinate, leading to fewer tasks being completed.


Possible questions:
- Are
and correlated? - Are
and positively correlated? - Are
and negatively correlated? - Are
and have a correlation? - Are
and have a positive correlation? - Are
and have a negative correlation? - Get the correlation between
and variable 2>. - Show me the
and their correlation by .
Find trends strength in the data
A trend is a consistent pattern or direction seen in data over time or in relation to an independent variable. It aids in recognizing patterns and forecasting future outcomes.
- Strong trend (Value ranges between 0.7 to 1.0): Indicates the data consistently moves in one direction (upward or downward).
- Moderate trend (value ranges between 0.3 to 0.7): Indicates the data shows a relatively consistent direction (upward or downward) but with occasional fluctuations or deviations.
- Weak trend (Value ranges between 0.0 to 0.3): Indicates the data does not follow a clear upward or downward path.
Example: The example below illustrates a strong uptrend in sales for the West region and a weak uptrend for the Central region.

Possible questions:
- Are
showing an increasing trend? - Is
showing a downtrend? - Which
has an upward trend? is showing a decreasing trend for the last four years?/li> - Which
is showing an uptrend in ? - How many
show an upward trend?
Group metric columns
You can group the metric column using phrases like 'by', 'group by', 'categorized by', 'across', 'wise', etc. The following types of groupings are supported.
Single Metric by a Single Dimension
In this example, the Sales column is grouped into months by the Date column.
monthly sales
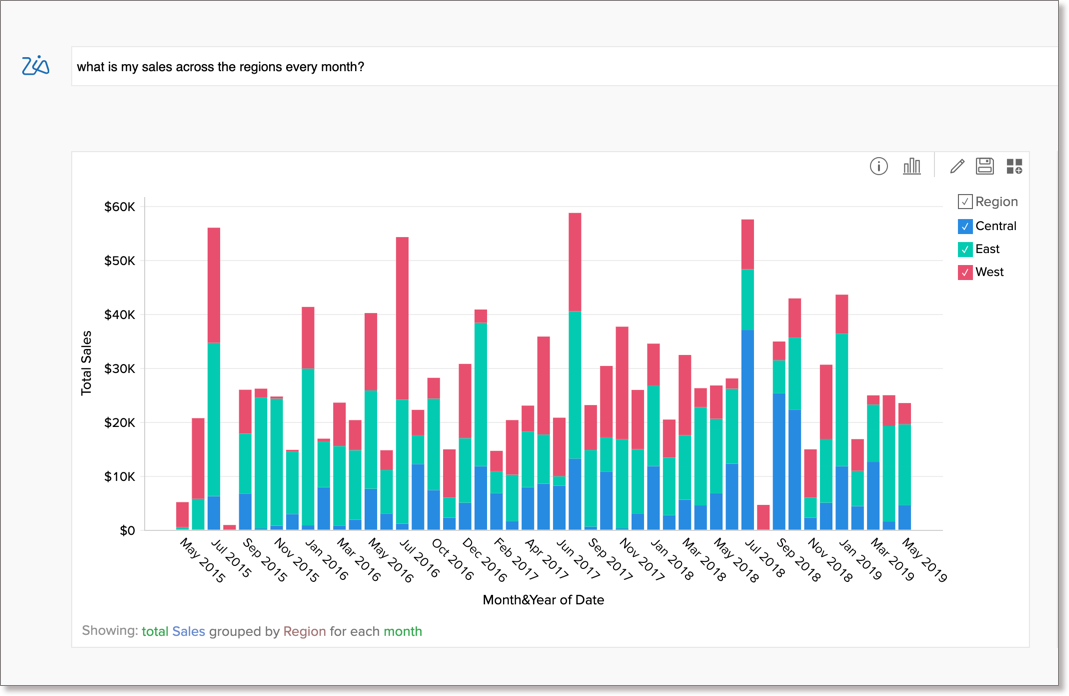
Single Metric by Multiple Dimensions
In this example, the Sales column is grouped by the Date and the Region columns.
what is my sales across the regions every month?
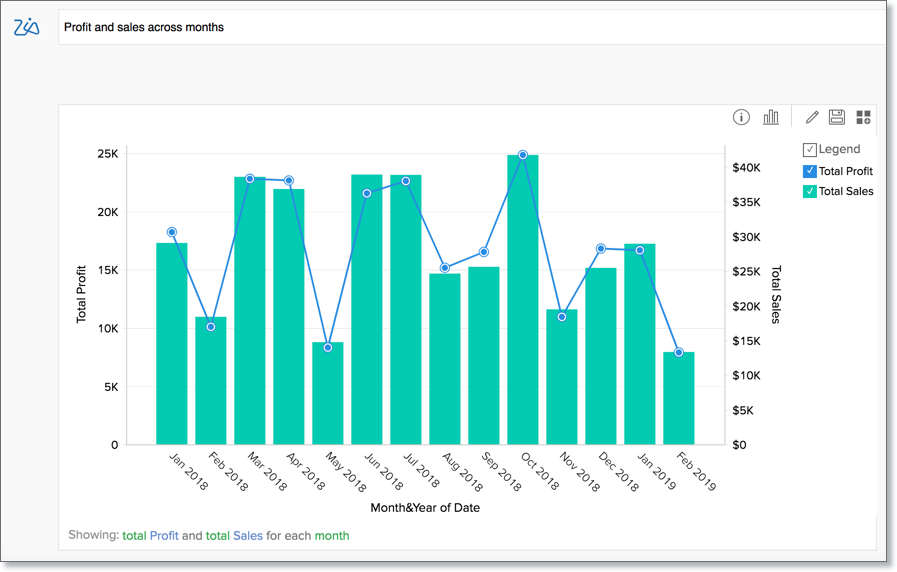
Multiple Metrics by a Single Dimension
In this example, the Sales and the Profit columns are grouped by the Date column.
Profit and sales across months
Multiple Metrics by Multiple Dimension
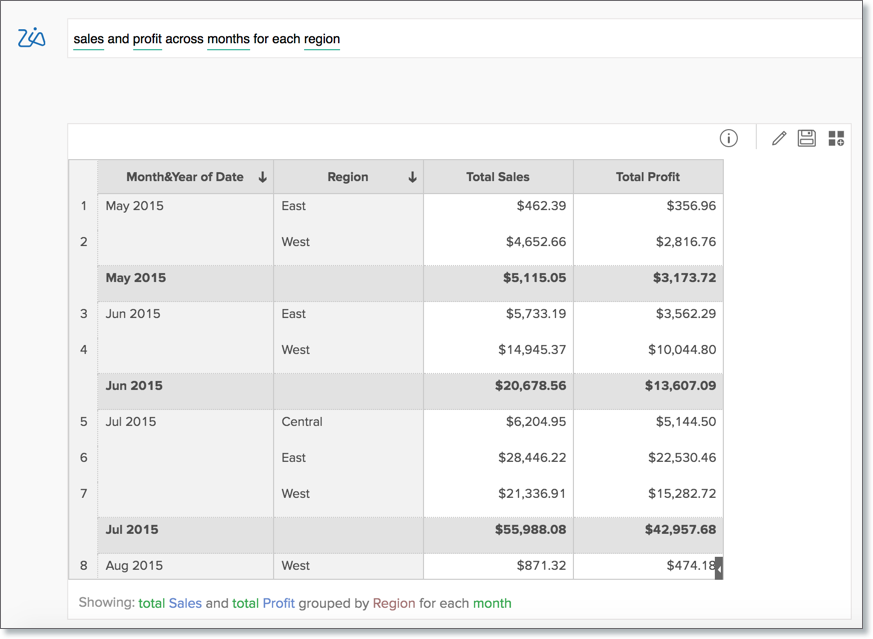
In this example, the Sales and the Profit columns are grouped by the Date and the Region columns.
Sales and profit across months for each region
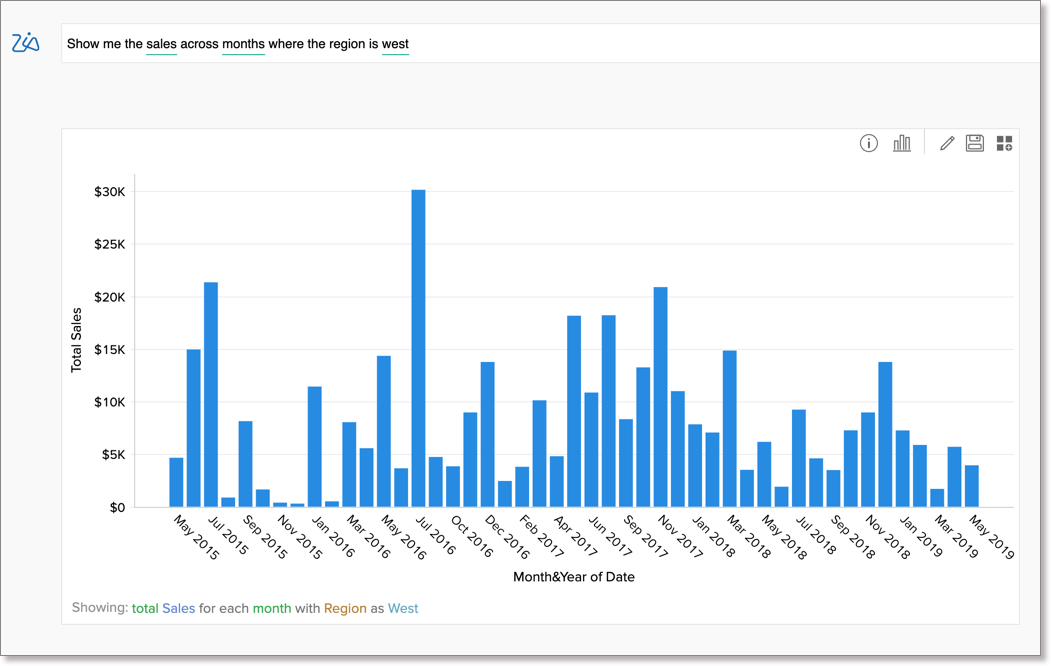
Apply filter criteria
You can apply single criteria or multiple criteria of filters in a question. The following are the supported filter criteria.
Show me the sales across months where the region is west
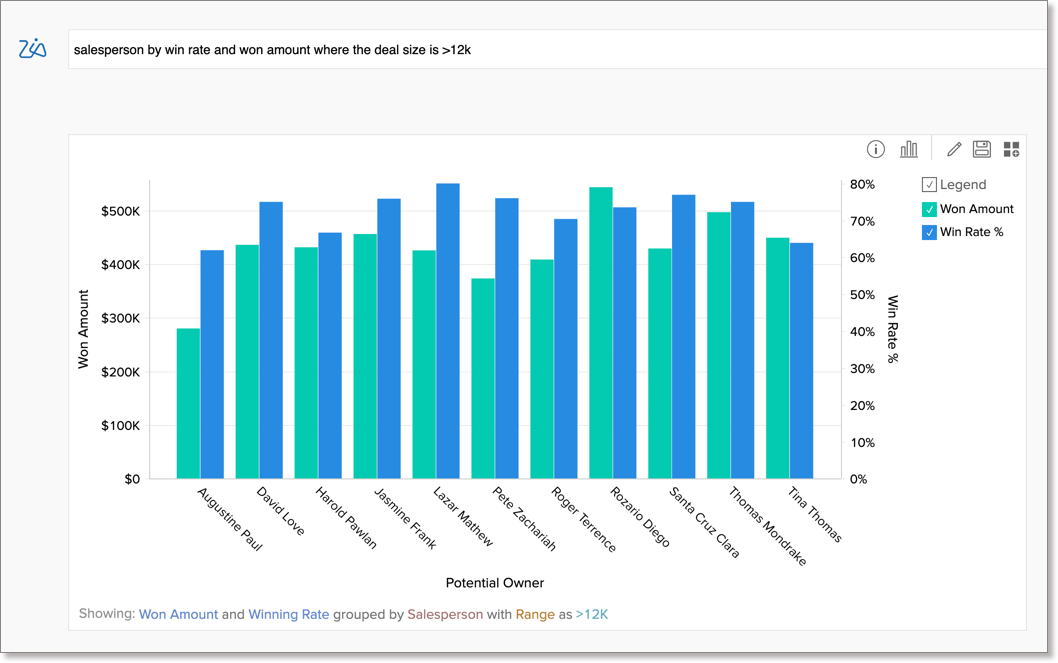
Salesperson by win rate and won amount where the deal size >12k
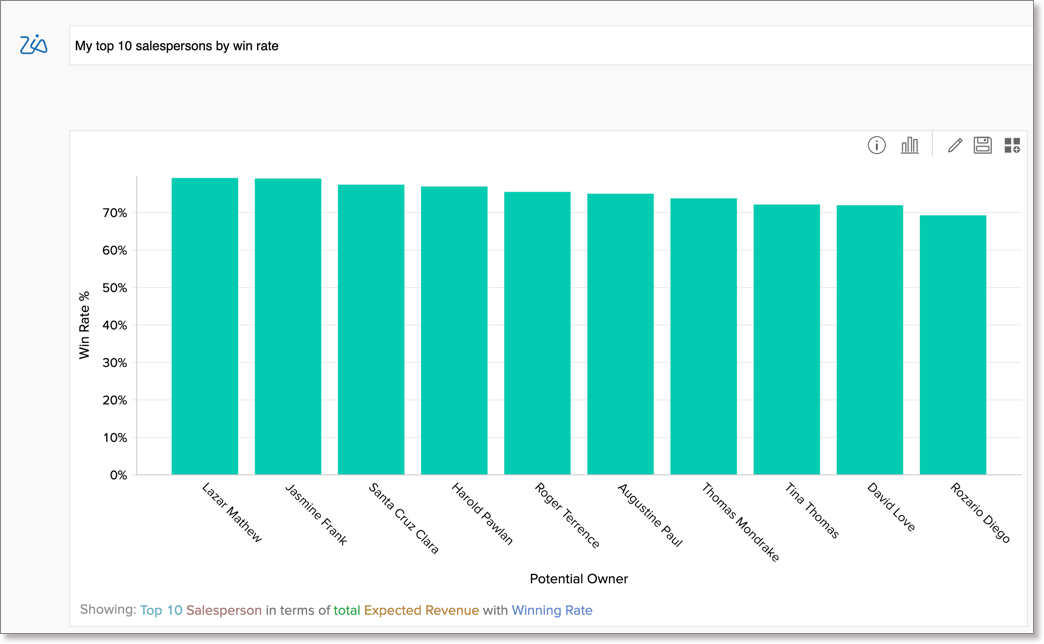
Slice by Range
You can slice data by range using special criteria like Top 10, Bottom 5, Highest, lowest, most, recent. In this example, we have filtered top 10 salespersons.
My top 10 salespersons by win rate
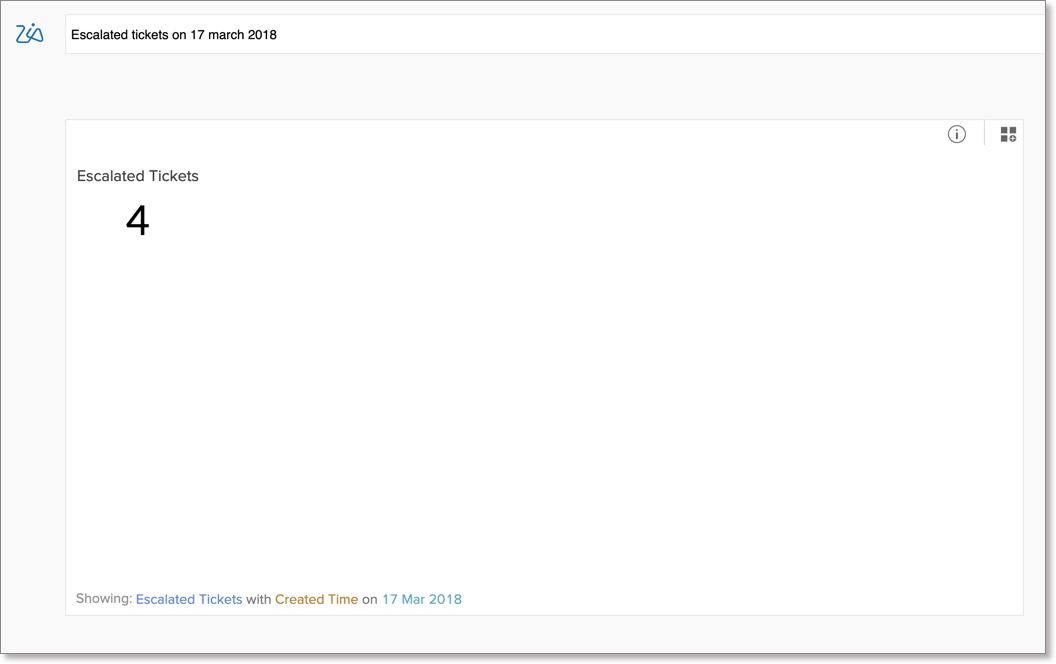
Exact Dates
You can filter data for a specific date such as 2019, March 2018, 12/3/2019. In this example, we've filtered the tickets escalated on 17th of March 2018.
Escalated tickets on 17 march 2018
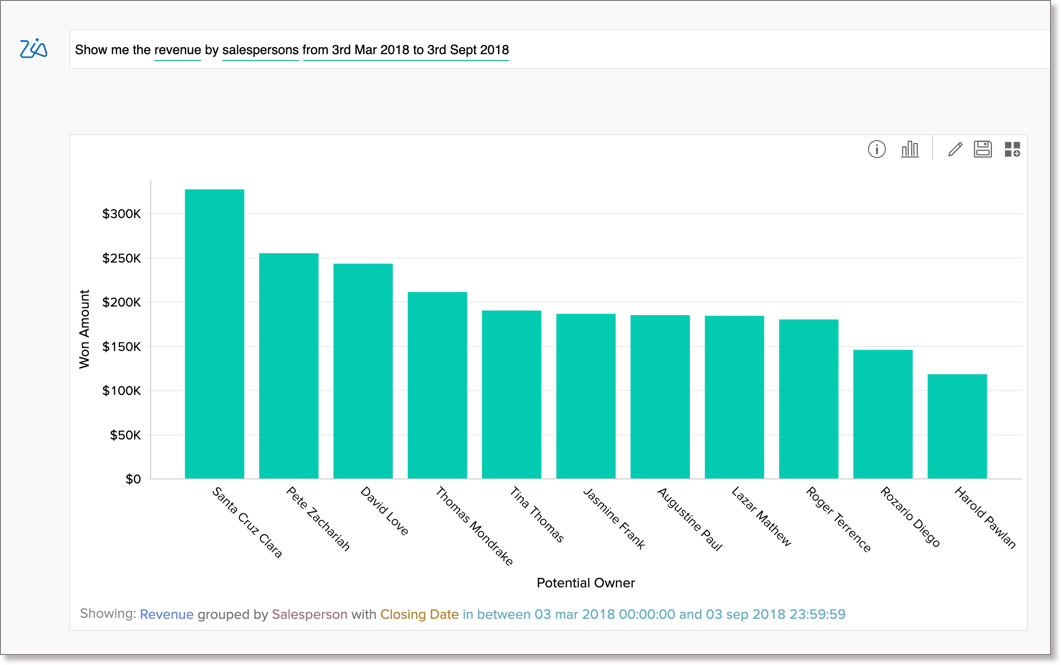
Date ranges
You can filter data for a specific date range. In this example, the Revenue for a specific period i.e., from 3rd March 2018 to 3rd September 2018 is filtered.
Show me the revenue by salespersons from 3rd Mar 2018 to 3rd Sept 2018
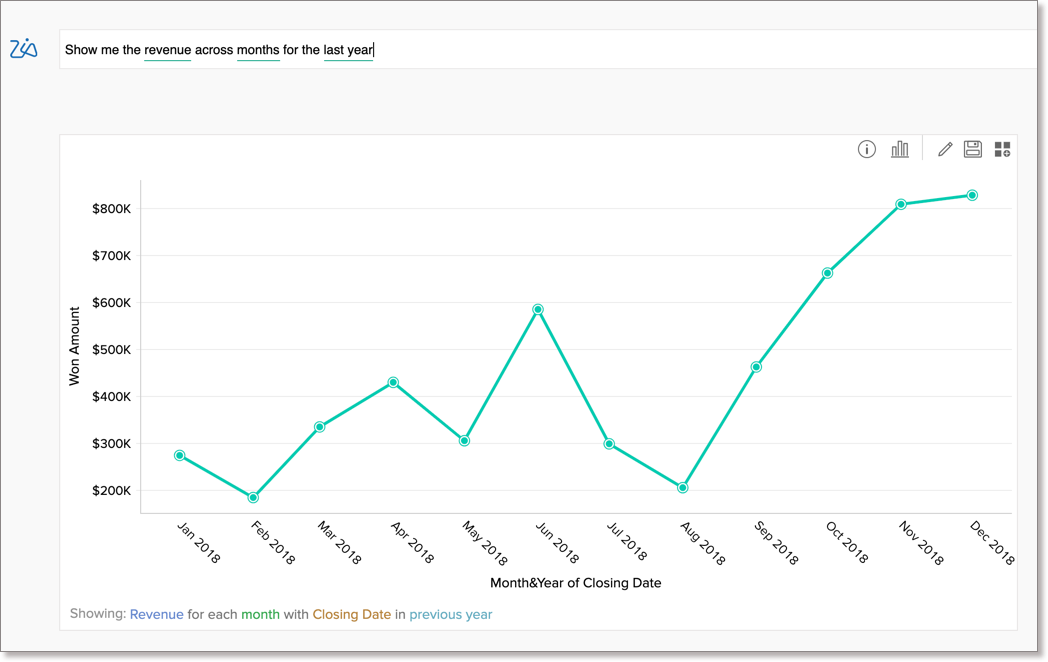
Relative Dates - You can filter data for a relative period such as This Month, Last Quarter, Today. In this example, the Revenue for the period of last 1 year is filtered.
Show me the revenue across months for the last year
Keywords for Ask Zia
The following is the list of keywords that Ask Zia can interpret and create appropriate insights.
Summary Options | |
| Functions | Keywords |
| Summary | sum, total, tot |
| Minimum | minimum, min |
| Maximum | maximum, max, highest, high |
| Count | count, number, no, total number, distinct count, unique, unique count |
| Others | standard deviation, std dev, variance |
Advanced Summary Options | |
| Functions | Keywords |
| Running Total | running total, running tot., running sum |
| Percentage of | percentage, total percentage, %, percent, percentage of total, total %, % of total, pct of total, % of sum, sum percentage, sum pct, contribution, contribution of total |
| Difference From | difference, difference from, diff, growth |
| % of Difference From | % of difference, pct of difference, difference %, % diff, difference percentage, difference in percentage, |
| % of Previous Value | percentage of previous, % of previous, pct of previous, prev %, previous value % |
Group by Options | |
| Functions | Keywords |
| Numeric | actual, range, as range, dimension, as dimension |
| Date-Actual | year, yearly, year over year, yoy, absyear quarter, quarterly, quarter over quarter, qoq, absquarter month, monthly, month over month, mom, month and year, absmonth week, weekly, week over week, wow, week and year, absweek day, daily, day over day, absday date, hour, hourly, minute, second |
| Date-Seasonal | seasonal day, seasonal month, seasonal year, seasonal week, seasonal quarter |
Filtering Options | |
| Functions | Keywords |
| Numeric | >, >=, greater than, above, over, beyond, higher than, more than, exceeds <, <=, lesser than, lower, lower than, less than, below, under equal to, equals to, equals, =, between |
| Units and Currency | thousands, k, millions, m, mn, billions, b, bn, Lakhs, L, Crores, C, Rupees, RS, ₹, Dollars, $ |
| By Range | top 10, top few, top, top most, highest, best bottom 10, bottom few, bottom, lowest, worst |
| Text | starts with, starts with, ends with, contains, is |
| Date-Actual | 2018, 2019, Q1 2019, Q4 of 2018, quarter 1 of 2019 January 2019, Jan 2019, 1/2019 15th october , 30 july, nineth july 2017, third may 2016, 2 feb 2001, 2019 mar 4, 17/feb, twenty six october |
| Date-Seasonal | June, may, jul, oct, Sunday, saturday, thurs, tue 1st quarter, 2nd quarter, second quarter, third quarter, fourth quarter, first quarter, quarter 4, quarter1 |
| Date-Relative | this year, previous year, last year, past year, recent year, previous 3 years, next 3 years, last 3 year, recent 3 years, last nine years, previous few years, recent few years, past few years, recent few decades, previous few decades, past few decades, next few decades, last few years, last decade, recent decade this quarter, previous quarter, last quarter, this quarter, recent quarter, previous 9 quarters, last 9 quarters, next 9 quarters, recent 5 quarters, previous five quarters, last three quarters, recent few quarters, next few quarters, previous few quarters, past few quarters, last few quarters this month, previous months, last months, past month, recent months, previous 6 months, next 6 months, last 6 months, recent 6 months, previous thirteen months, recent seventeen months, previous few months, recent few months, previous month, current may, previous november, this apr, past mar this week, last week, past week, recent week, last few weeks todat, yesterday, tomorrow, recent 3 days, past 21 days, recent few days, next few days, next day, recent day recent 22 hours, recent 13 hours, next hour, past hour |