Color Palettes in Zoho Analytics
Color Palettes are a collection of colors that allow you to customize and beautify your charts. Zoho Analytics offers a variety of color palettes to choose from. By default, when you create a chart, the colors assigned to your chart are those that are set for the corresponding workspace. You can also add your own color palettes to suit your reporting requirements.
- What are color palettes?
- What are the color palette types supported in Zoho Analytics?
- How do I access the color palettes?
- How can I add a new color palette?
- Can I preview the new color palette?
- How do I set a default color palette for my Workspace?
- How can I change the chart colors for all the charts in my Workspace?
- Can I apply different colors for a chart?
- How do I edit a palette?
- Can I copy a palette?
- Can I copy my custom palette to other workspaces?
- Can I delete a palette?
1. What are color palettes?
Color Palettes are a collection of colors that allows you to customize and beautify your charts. Zoho Analytics offers you a wide variety of predefined color palettes to choose from. You can also create your own palette where you can define a set of colors to be applied to your charts, instead of manually assigning chart colors every time.
2. What are the color palette types supported in Zoho Analytics?
Zoho Analytics offers three types of color palettes. They are:
The Solid Color palette is a collection of plain solid colors, with a maximum of 32 colors in a palette. The Zoho Analytics Default palette will be selected as the default set.

A report with a solid color palette applied.

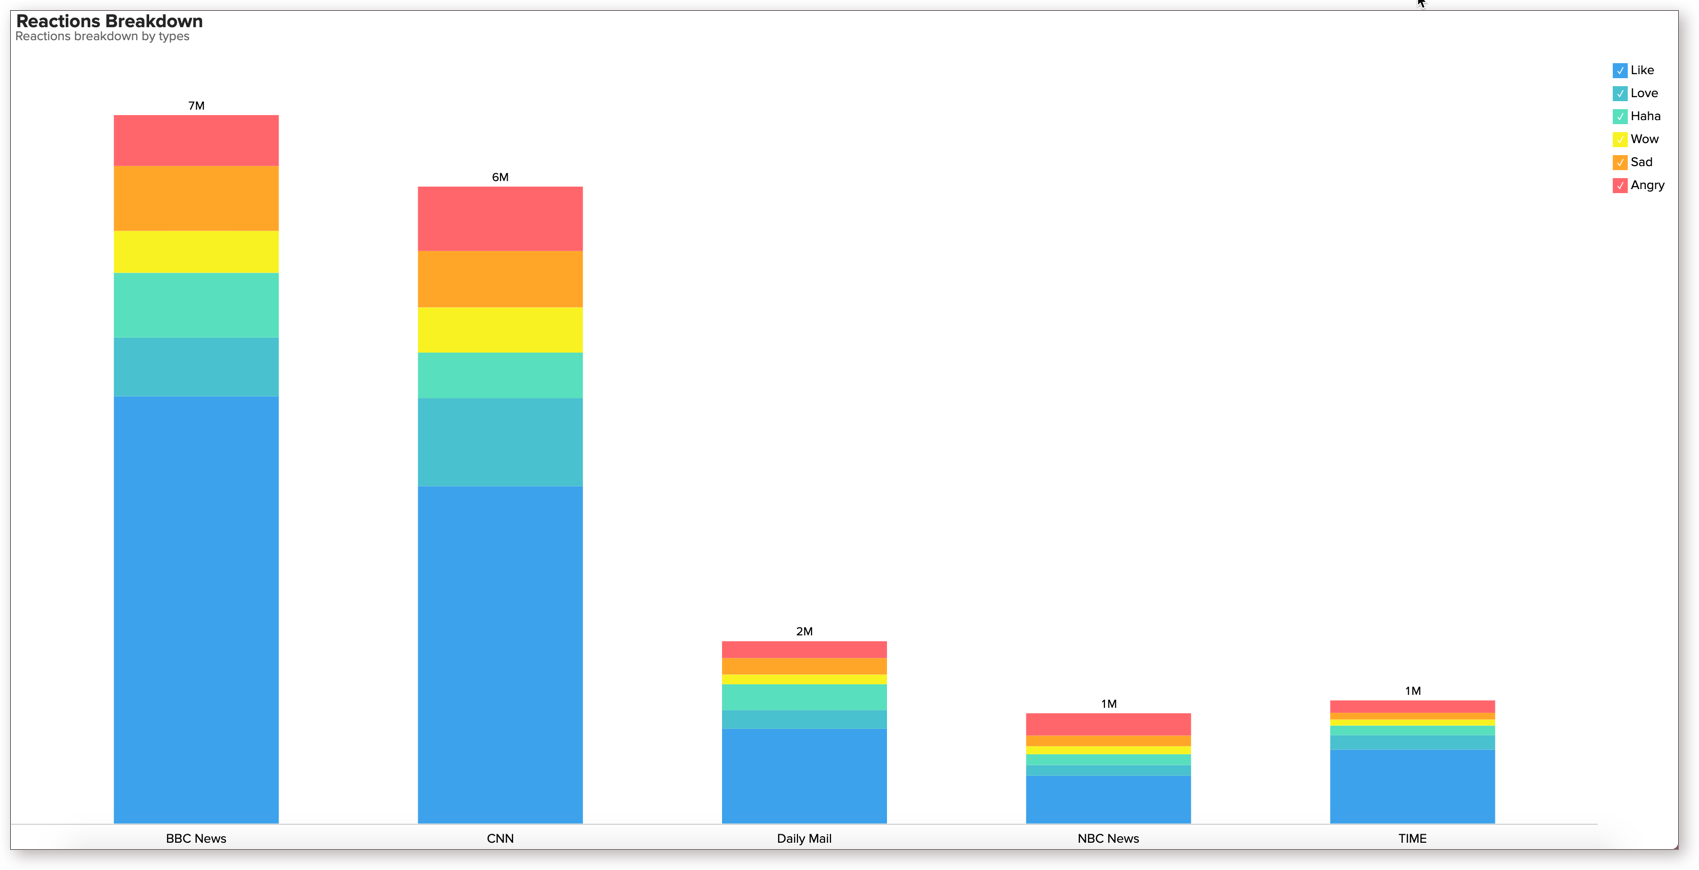
The monochrome palette is differentiated by tones and tints of the same color applied for different legend items in a chart.
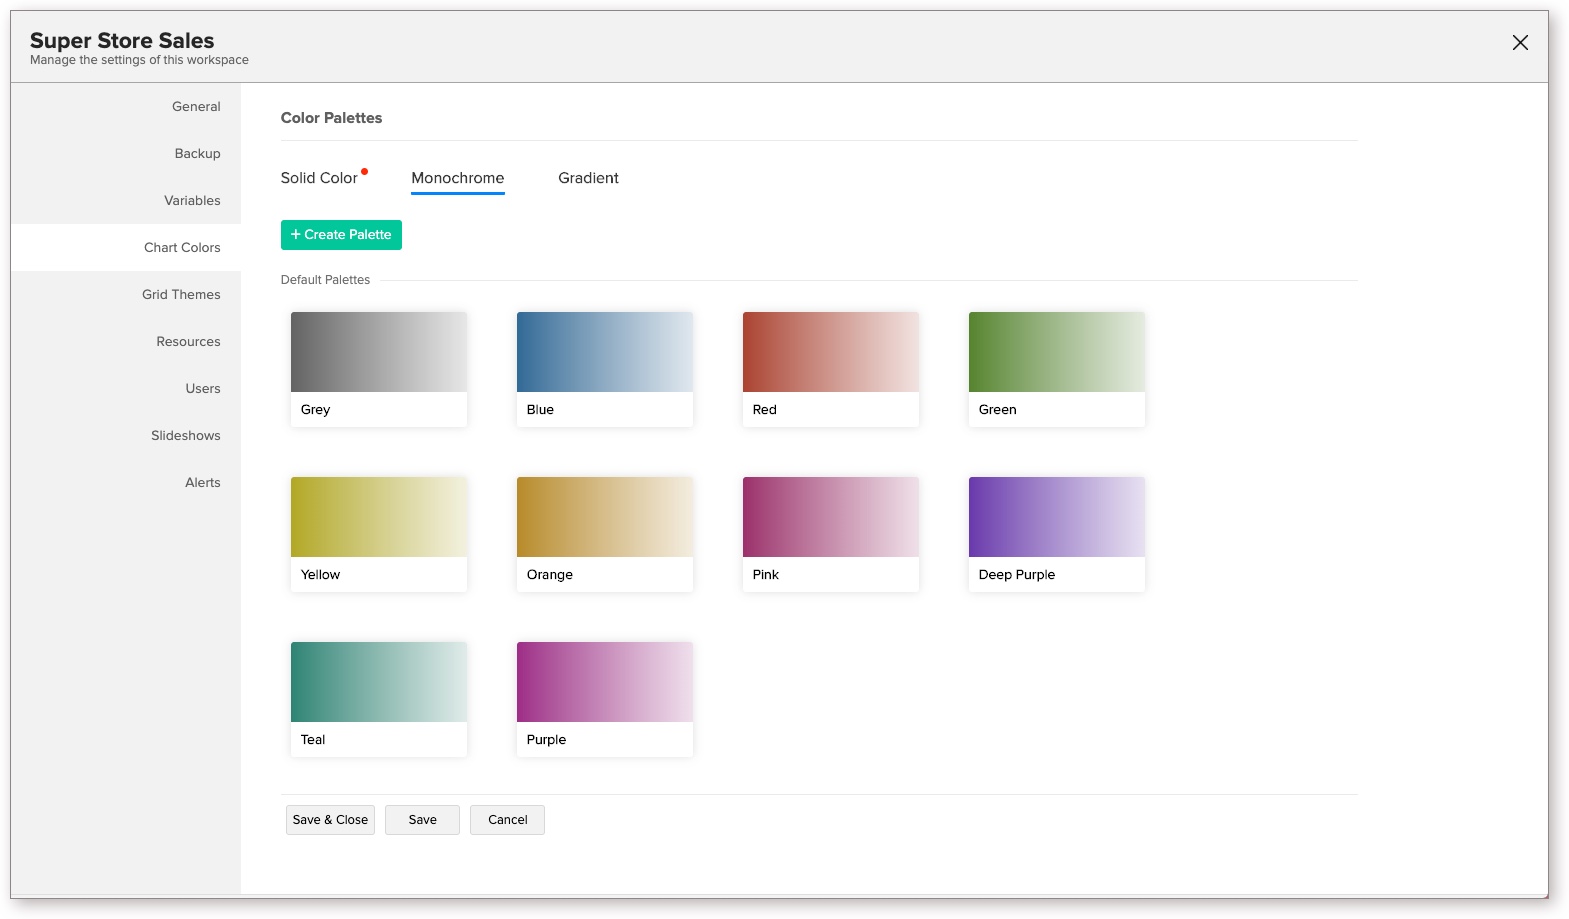
A report with Monochrome color palette applied.

The Gradient palette represents a list of colors that represent a gradual shift from one color to another.
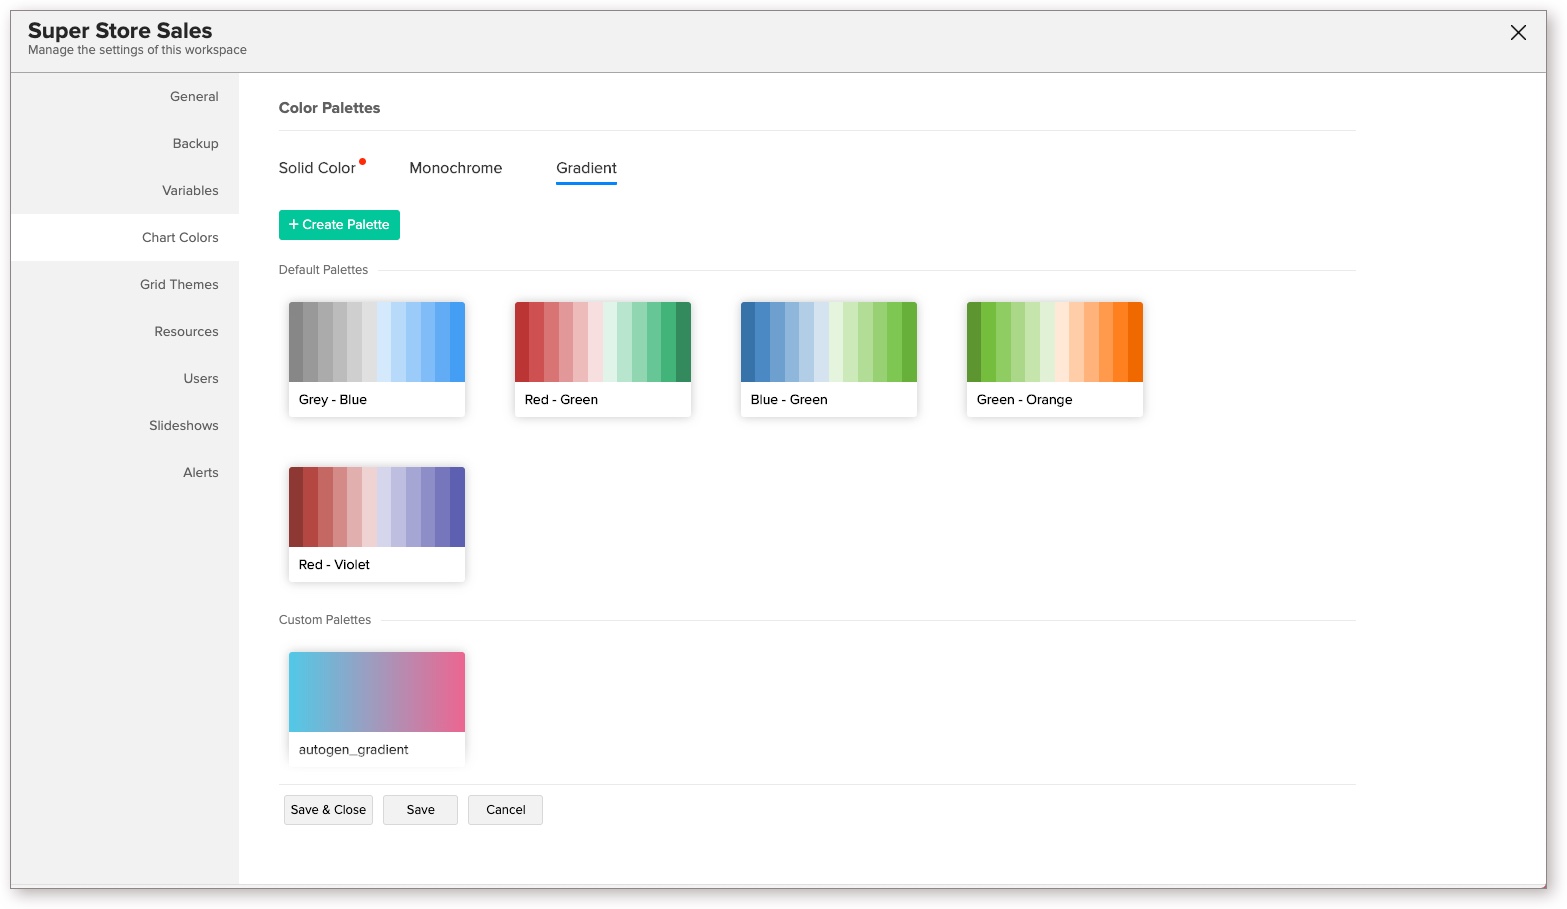
A report with Gradient color palette applied.
Pattern
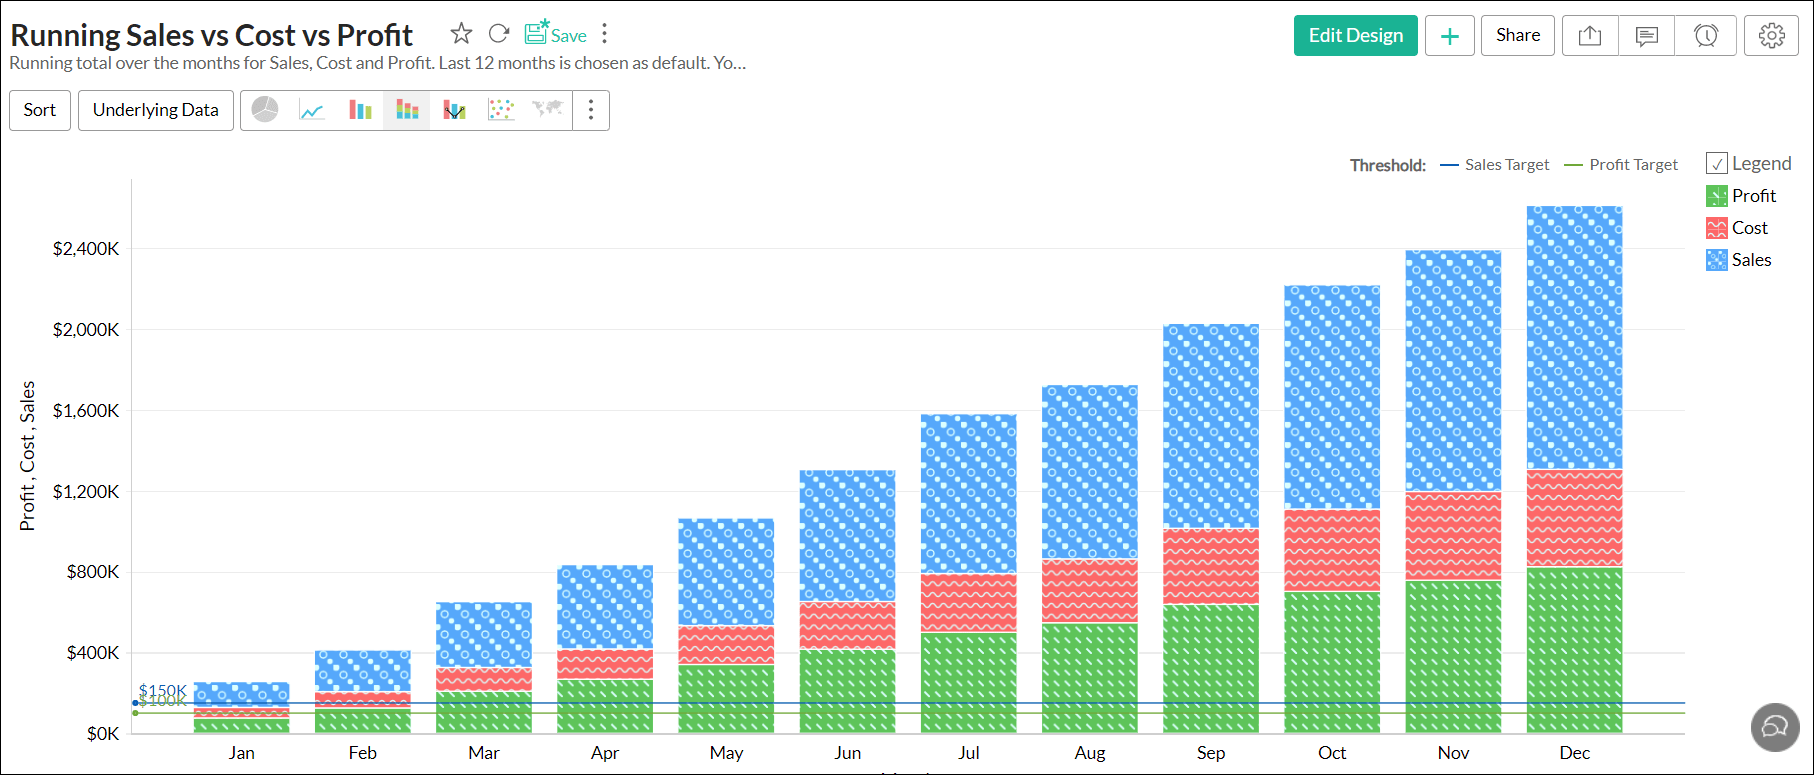
The Pattern palette allows you to fill your charts with specific patterns.

The following is a chart with the Pattern palette applied.
3. How do I access the color palettes?
To access the color palettes,
- Open your Workspace
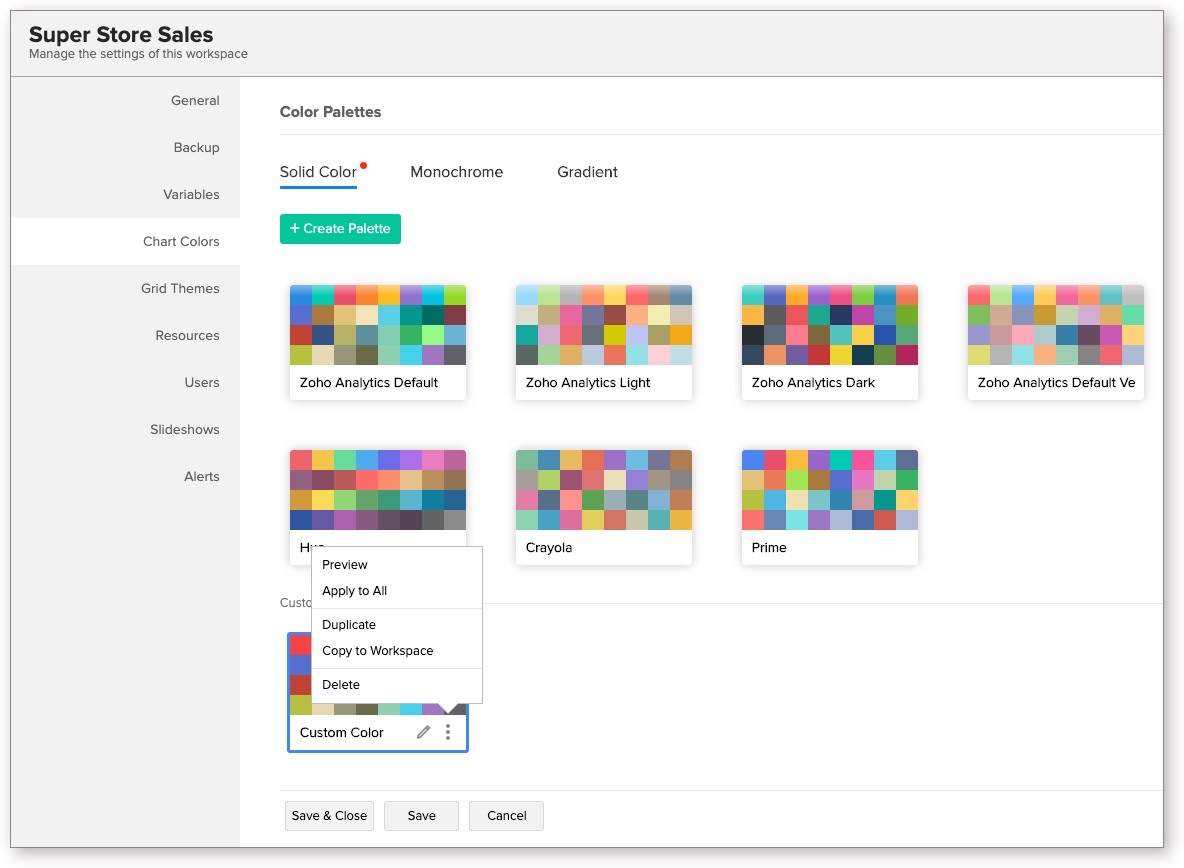
- Click the Settings button in the top right corner and select Chart Colors. The Chart Colors tab opens as shown below.

You can customize the color palette or create your own palette from this page. When you create a chart, the set colors will be assigned to your chart.
4. How can I add a new color palette?
You can add your own color palettes from the Chart Colors tab of the Workspace Settings.
Follow the below steps to create your color palette,
Open the Workspace Settings.
Click Chart Colors.
Select the Palette type. In this example, we will be creating a solid color palette.
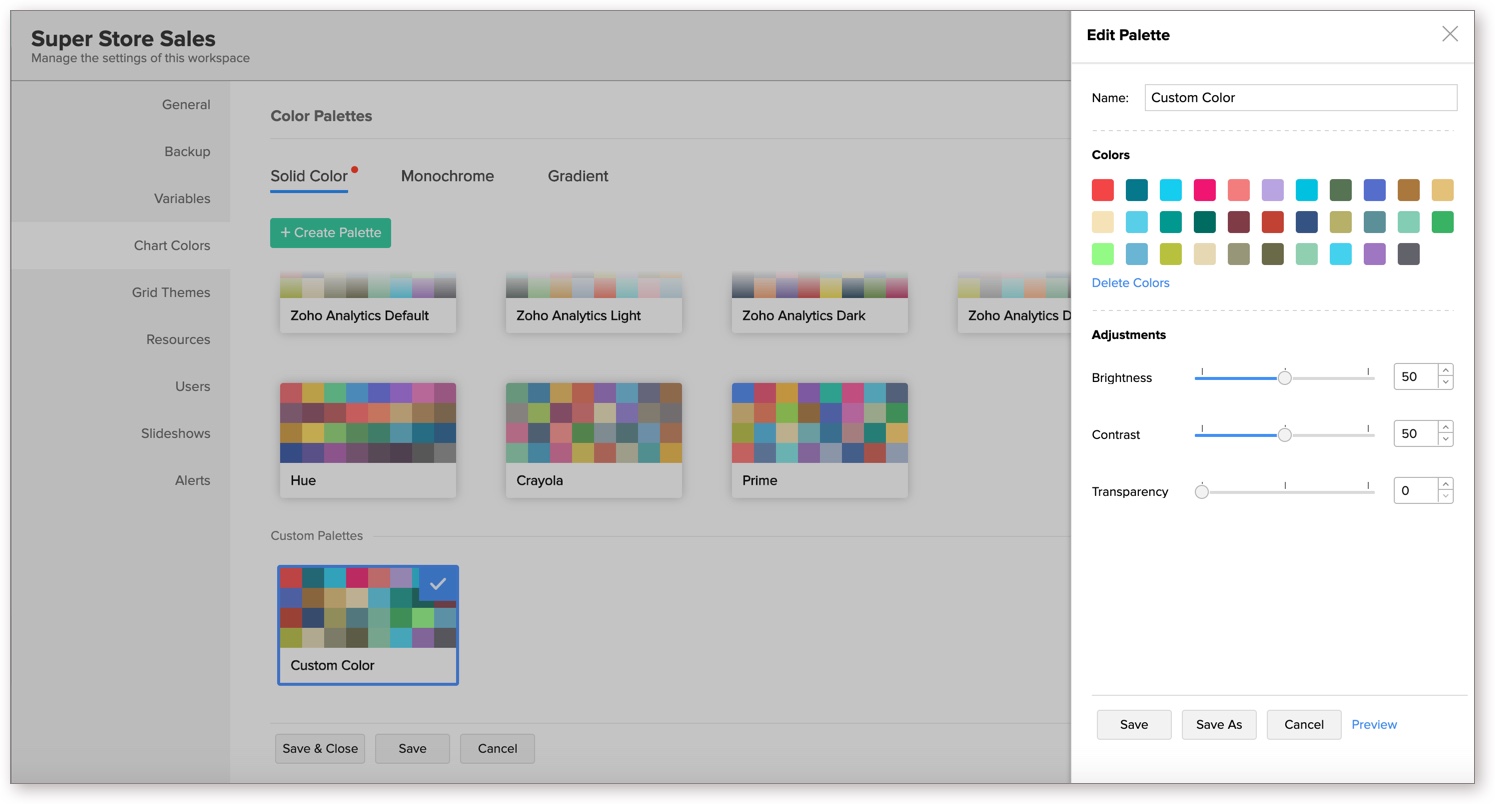
Click Create Palette. The Edit Palette dialog will open.

- Provide a Name for the palette.
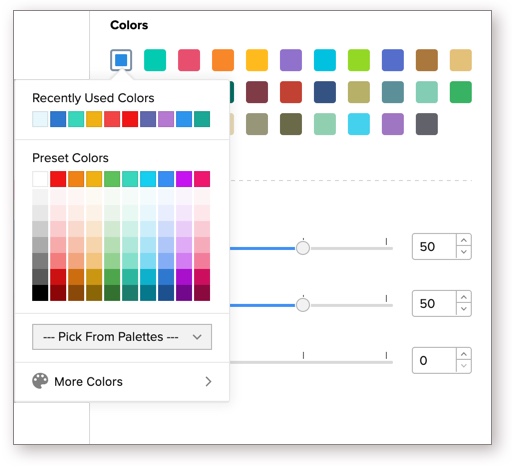
- The Colors section will list the color as in Zoho Analytics Default palette. Click on each color to replace them with the required custom color.
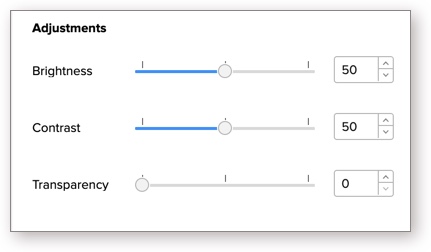
In the Adjustment section, specify the Brightness, Contrast, and Transparency of the colors using the slider as shown in the below image.
Once you have provided all necessary settings, click the Save.

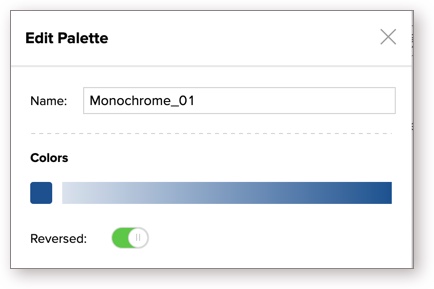
Monochrome
In case of Monochrome palette, you can choose to set darker to lighter shade or lighter to darker shade using the Reverse toggle button.
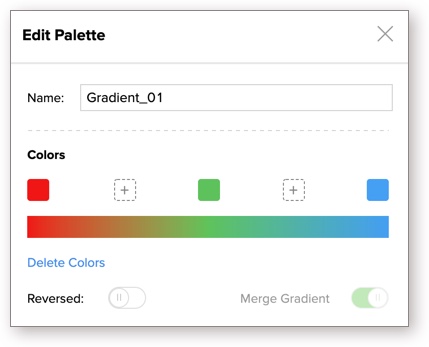
Gradient
You can make the following modifications to a gradient color palette in Zoho Analytics:
Modify the existing colors from the Colors section of the Edit Palette screen, and include additional colors by clicking the + button.
Use the Reversed toggle button to swap the order of the colors, and the Merge Gradient button to merge the gradient between colors to achieve a smooth fusion of color.
Modify the brightness, contrast and transparency from the Adjustments section. Preview the changes made using the Preview button, and click Save.
5. Can I preview the new color palette?
Yes, you can preview the color palette. Follow the below steps to preview the selected color palette over different chart types.
- Open the Chart Colors tab in workspace settings.
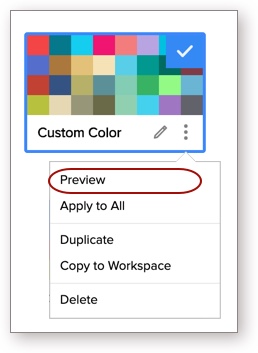
- Select the palette you want to
- Click the Action icon that appears on mouse-over and select Preview.
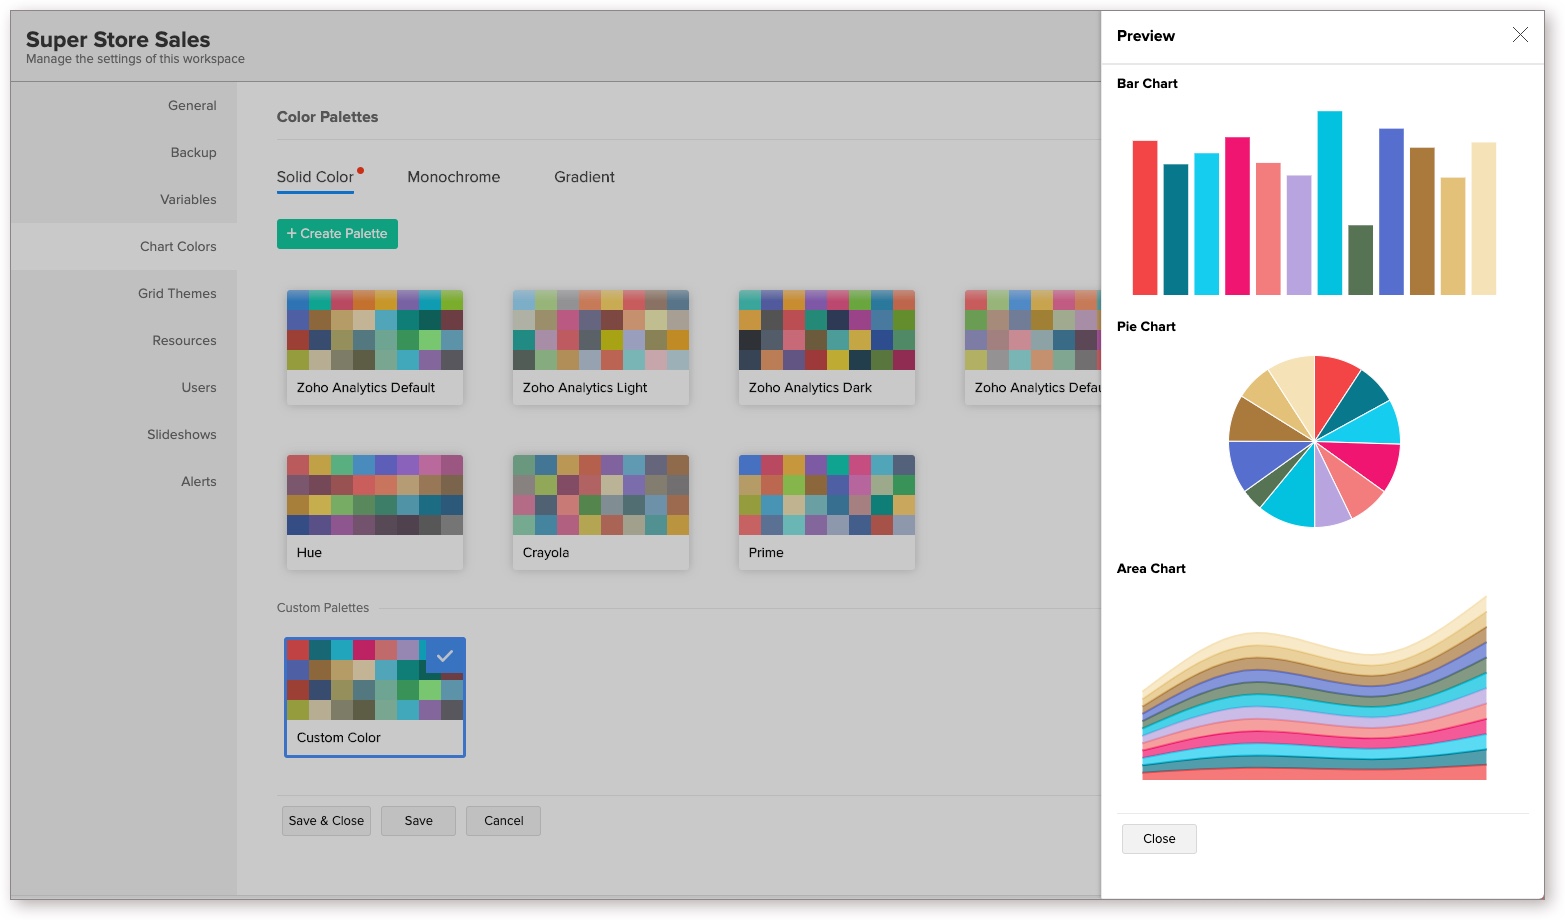
- The preview of the selected color palette on various chart types will be displayed.


6. How do I set a default color palette for my Workspace?
The Zoho Analytics Default palette will be selected and applied by default. You can change the default palette for a Workspace by following the below steps:
- Open the Workspace Settings.
- Click Chart Colors, and select the required palette.
- Click Save & Close. The selected palette will be set as the default palette. When you create a chart, colors from this palette will be applied to the chart series.
7. How can I change the chart colors for all the existing charts in my Workspace?
By default, when you customize the chart color palette of a Workspace, it will be applied to the new charts created after customizing the palette. To apply the palette to all the existing charts in the Workspace, follow the steps below:
- Open the Chart Colors tab in workspace settings.
- Select the palette you want to apply to your existing chart. Click here to learn about adding your own color palette.
- Click the Action icon that appears on mouse-over and select Apply to All. Colors from this palette will be applied over the existing colors.

Note: This action is irreversible.
8. Can I apply different colors for a chart?
By default, when you create a chart, the set palette colors will be assigned to your chart. However, you can choose to change this in a chart using the Legend tab of Chart Settings.
Follow the steps below to do this:
- Open the chart for which you want to apply different colors.
- Click the Settings icon, navigate to the Legend tab, and choose the required color palette.
- You can also override the colors of the individual series of the chart using the Colors field.
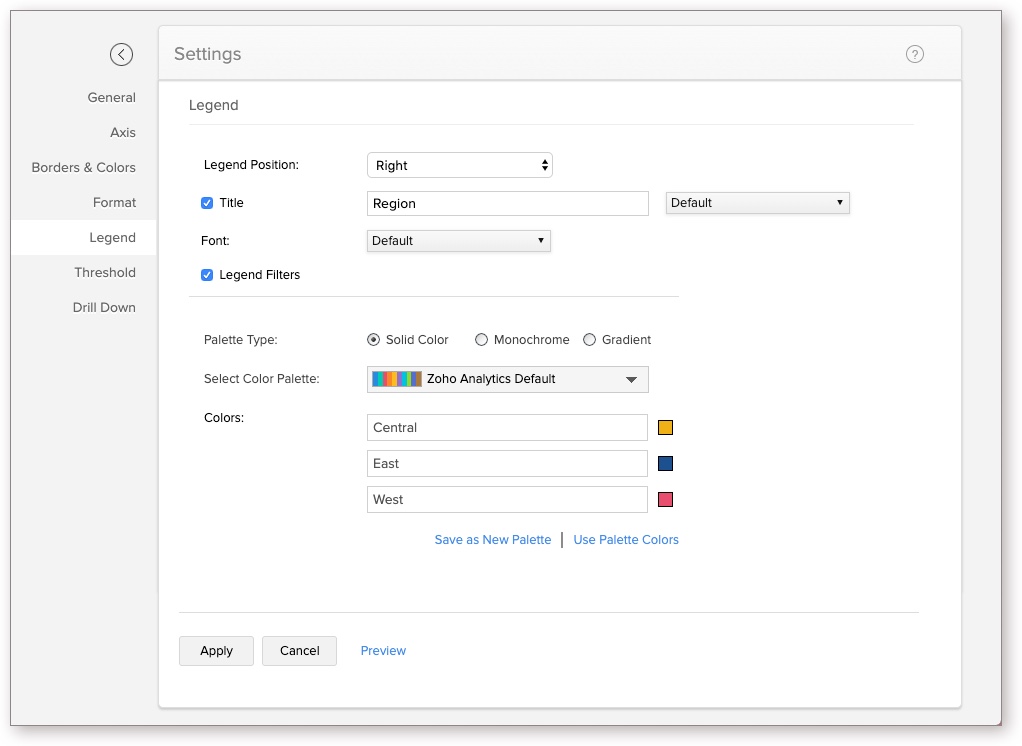
- You can choose to save the customized color as a palette using the Save as New Palette link.
- Click Apply. The color will be applied to the chart.

9. How do I edit a palette?
You can edit the palette by following the steps below.
- Open the Chart Colors tab in Workspace Settings.
- Select the palette you want to edit.
- Click the Edit icon that appears on mouse-over.
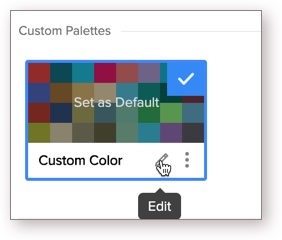
- The Edit Palette dialog will open. Modify the settings as needed and click Save.
- You can also save the modified palette as a new palette using the Save As option.


10. Can I copy a palette?
Yes, you can copy an existing palette. Follow the below steps to do so:
- Open the Chart Colors tab in workspace settings.
- Select the palette you want to copy.
- Click the Action icon that appears on mouse-over and select Duplicate.

- A new palette with the same colors and settings will be created. You can further edit this palette as needed.

11. Can I copy my custom palette to other Workspaces?
Zoho Analytics allows you to copy the custom palette from one workspace to another. Follow the below steps to do so:
- Open the Chart Colors tab in Workspace settings.
- Select the palette you want to
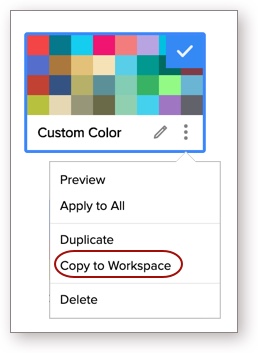
- Click the Action icon that appears on mouse-over and select Copy to Workspace.
- The Copy to Workspace dialog will open. Specify a Palette Name.
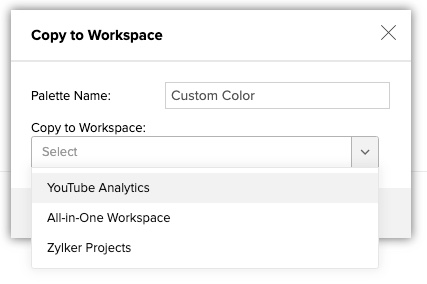
- In the Copy to Workspace drop-down, select the Workspace into which you want to copy the color palette.
- Click Ok. The palette will be copied to the selected workspace.


12. Can I delete a palette?
Yes, you can delete custom palettes from your workspace. Follow the below steps to do so:
- Open the Chart Colors tab in workspace settings.
- Select the palette you want to delete.
- Click the Action icon that appears on mouse-over and select Delete. The palette will be deleted.

