Custom Visualizations
Zoho Analytics includes a set of default chart types for most reporting needs. When your reporting requirements go beyond these defaults, you can use Custom Visualizations to build and integrate your own chart types using third-party JavaScript libraries or custom scripts.
What You Need
To create a custom visualization, you must configure two files:
- ZAViz_Manifest.json — Defines the structure, data fields, dependencies, and user-configurable settings for the visualization.
- main.js — Contains the rendering logic that generates the visual output.
Both files must be packaged together in a ZIP file and uploaded to Zoho Analytics as a plugin by users with Admin privileges.
- Configuring a Custom Visualization
- Utility APIs (ZAViz_Utils)
- Adding the Plugin
- Using External Libraries
- Supported Formatting Options
Configuring a Custom Visualization
Configuring ZAViz_Manifest.json
The ZAViz_Manifest.json file defines the structure and behavior of your custom visualization. It controls how the visualization appears in the Zoho Analytics UI, what type of data fields users can map to it, what external libraries it depends on, and what options appear in the Settings panel.
A typical ZAViz_Manifest.json file contains the following top-level properties:
| Property | Description |
| name | The display name of the visualization as it appears in the UI. |
| icon | The URL or local file path to the visualization's icon. |
| dependencies | A list of external library URLs or local file references required by the visualization. |
| structure | Defines the drop areas where users map data fields. |
| settings | Defines the user-configurable options that appear in the Settings panel. |
A minimal ZAViz_Manifest.json looks like this:
{
  "name": "Sales Dashboard",
  "icon": "icons/sales-chart.png",
  "dependencies": [],
  "structure": ["Drop Area","multi","DIMENSIONAL",""],
  "settings": {}
}Defining Drop Areas (structure)
The structure property defines the drop areas that appear in the chart builder. Each drop area is configured as an array with four parameters, in the following order:
| Parameter | Description |
| Name | The label displayed for the drop area in the UI. |
| Cardinality | Specifies whether the drop area accepts a single column ("single") or multiple columns ("multi"). |
| Data Type | The type of data accepted. Use "MEASURE" for numeric values or "DIMENSIONAL" for categorical values. |
| Supported Operations | The aggregation operations allowed. Pass an empty string ("") to support all operations. |
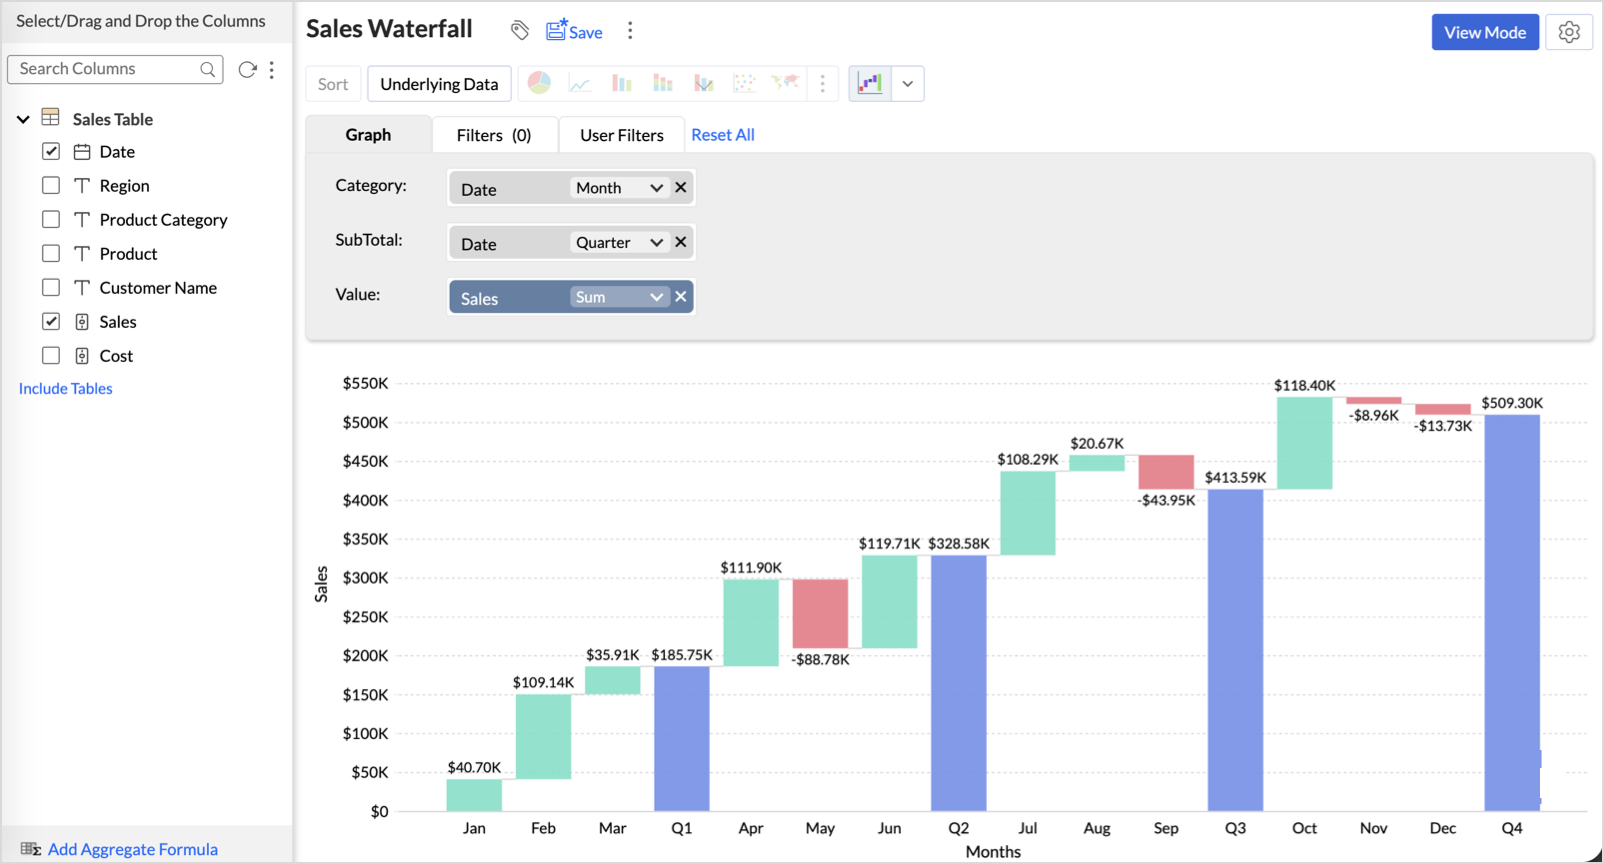
Example for a Waterfall Chart:
{
  "name": "WaterFall",
  "icon": "localFile ",
  "dependencies": ["https://cdn.plot.ly/plotly-3.0.0.min.js"],
  "structure": [
    ["Category", "single", "DIMENSIONAL", ""],
    ["Value", "single", "MEASURE", ""]
  ]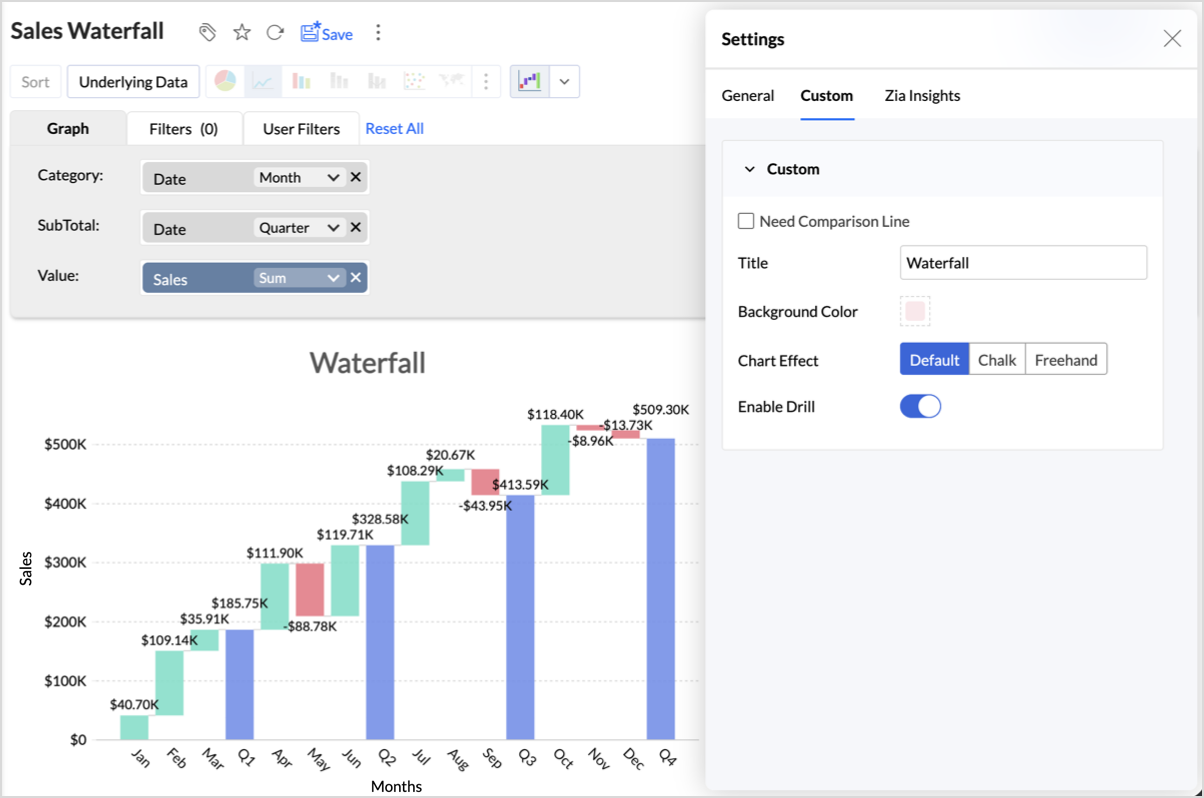
} Defining User Settings (Settings)
The settings property defines the options that users can configure from the Settings panel. Settings are grouped into named tabs, and each tab contains one or more setting items.
Each setting item requires the following fields:
| Field | Description |
| uniqueName | A unique identifier used to access the setting's value in your code. |
| type | The UI component type to display. See supported types below. |
| label | The label displayed to the user in the Settings panel. |
| defaultValue | The value applied when the user has not made a selection. |
| options | A list of selectable values. Required for multipleToggle and dropdown types. |
Supported Setting Types:
| Type | Use For |
| checkBox | Boolean on/off options |
| toggle | Boolean on/off options (switch style) |
| inputText | Free-form text input |
| colorComponent | Color picker for color values |
| multipleToggle | Selection from a fixed set of string options |
| dropdown | Selection from a fixed set of string options |
Example:
 "settings": {
  "Title": [
    {
      "uniqueName": "needComparison",
      "type": "checkBox",
      "label": "Need Comparison Line",
      "defaultValue": false
    },
    {
      "uniqueName": "title",
      "type": "inputText",
      "label": "Title",
      "defaultValue": ""
    },
    {
      "uniqueName": "bgColor",
      "type": "colorComponent",
      "label": "Background Color",
      "defaultValue": "#F3F3F3"
    }
  ],
  "Additional": [
    {
      "uniqueName": "chartEffect",
      "type": "multipleToggle",
      "label": "Chart Effect",
      "defaultValue": "Default",
      "options": ["Default", "Chalk", "Freehand"]
    },
    {
      "uniqueName": "Drill",
      "type": "toggle",
      "label": "Enable Drill",
      "defaultValue": true
    },
    {
      "uniqueName": "dropdown",
      "type": "dropdown",
      "label": "Show DropDown",
      "options": ["One", "Two", "Three"],
      "defaultValue": "Two"
    }
  ]
}
Note: The user-selected values from the Settings panel are passed to your visualization code through the metadata.customSettings object. Each value is accessible using the uniqueName defined here.
Refer the Configuring main.js section for more details.
Configuring main.js
The main.js file contains the rendering logic for your custom visualization.
You must implement the generateCustomVisual function in this file. Zoho Analytics calls this function automatically whenever the visualization needs to be rendered or refreshed.
function generateCustomVisual(container, data, metaData) {
  // Your rendering logic here
}
This function receives three parameters: container, data, and metaData.
Each one is described in detail below.
container
The container parameter is the HTML element provided by Zoho Analytics as the drawing area for your visualization. All chart elements must be created and appended within this container.
function generateCustomVisual(container, data, metaData) {
container.innerHTML = "<p>Hello from my custom visual!</p>";
}
data
The data parameter contains the processed values of the columns that the user has dropped into the chart builder. The data is returned as a row-based array, where each row represents a single record.
- Each row contains values in the same order as the columns were dropped.
- Only the selected columns and their applied aggregations are included.
- Any change in column selection or aggregation is immediately reflected in the data structure.
Example - Columns dropped in the order: Region, Product Category, Sales
[
  ["Central", "Furniture", 17443.52],
  ["Central", "Grocery", 232572.5],
  ["Central", "Stationery", 58962.02],
  ["East", "Furniture", 68200.55],
  ["East", "Grocery", 414193.83],
  ["East", "Stationery", 116498.94],
  ["West", "Furniture", 45654.75],
  ["West", "Grocery", 266214.82],
  ["West", "Stationery", 80206.13]
]
metaData
The metaData parameter provides descriptive and structural information about the data and user configurations.
It contains two sections: columns and customSettings.
columns
The columns array describes each column dropped into the visualization, in the same order as the values in each data row.
Each column object contains the following fields:
| Field | Description |
| operation | The aggregation applied to the column (for example, GROUPBY, SUM). |
| datatype | The data type of the column (ordinal for categorical, numeric for numeric values). |
| columnname | The display name of the column. |
| dataindex | The position of the column's value in each data row. Starts from 0. |
| dropBoxName | The name of the drop area this column was placed in. Use this to identify columns in your code. |
customSettings
The customSettings object contains the current values of all user-configured settings from the Settings panel.
Each value is accessible using the uniqueName defined in ZAViz_Manifest.json.
Example - Accessing customSettings values:
function generateCustomVisual(container, data, metaData) {
  const showLegend = metaData.customSettings.showLegend;
  const bgColor = metaData.customSettings.bgColor;
  const chartEffect = metaData.customSettings.chartEffect;
  // Use these values to customize your rendering logic
}
Utility APIs (ZAViz_Utils)
Zoho Analytics provides a set of built-in utility functions through the ZAViz_Utils object. Use these functions in your main.js code to format data values and retrieve theme-appropriate styles for your visualization.
Column Index
Before using the utility functions, it is important to understand how the column index works. The column index represents the order in which columns are dropped into the chart builder, starting from 1. Columns are counted from top to bottom and left to right across all drop areas.
Example:
| Column Index | Drop Area | Column |
| 1 | Samples | Region |
| 2 | Values | Sales |

getFormattedValue
Returns the formatted value of a data point based on the formatting details configured for the corresponding column.
Syntax:
ZAViz_Utils.getFormattedValue(columnIndex, data);
Parameters
| Parameter | Description |
| columnIndex | The index of the column whose formatting should be applied. Starts from 1. |
| data | The raw data value to format. |
Example:
const formattedSales = ZAViz_Utils.getFormattedValue(2, 17443.52);
getSuitableStyle
Returns a theme-appropriate color value in hex format based on the current dashboard theme or workspace color palette settings. Use this function to ensure your visualization adapts correctly when the user switches themes.
Syntax:
ZAViz_Utils.getSuitableStyle(styleType);
Parameters:
| styleType Value | Description |
| 'fontColor' | Returns the suitable font color based on the current theme applied in the dashboard or common appearance. |
| 'backgroundColor' | Returns the suitable background color based on the current theme applied in the dashboard or common appearance. |
| 'legendColor' | Returns the suitable legend color based on the workspace-level color palette settings. |
Note: All color values are returned in hex format.
Example:
 const fontColor = ZAViz_Utils.getSuitableStyle('fontColor');
 const bgColor = ZAViz_Utils.getSuitableStyle('backgroundColor');
 const legendColor = ZAViz_Utils.getSuitableStyle('legendColor');
Interaction API (ZAViz_ActionsAPI)
Zoho Analytics provides the ZAViz_ActionsAPI object to enable user interactions within your custom visualization. Use this API to display the standard Zoho Analytics interaction menu when a user clicks on a data point in your chart.
showInteractionMenu
Displays the Zoho Analytics interaction menu at the position of the clicked data point.
Syntax:
ZAViz_ActionsAPI.showInteractionMenu(dataPoints, coordinates);
Parameters:
| Parameter | Description |
| dataPoints | A JSON object where each key is a column index and each value is the corresponding clicked data point value. |
| coordinates | A JSON object specifying the x and y position of the clicked element for menu positioning. If not provided, the menu appears at the center of the chart area. |
Example:
const dataPoints = { 1: "West", 2: "110.06" };
 const coordinates = { x: 250, y: 100 };
 ZAViz_ActionsAPI.showInteractionMenu(dataPoints, coordinates);
Implementation Examples
The following examples show how to integrate showInteractionMenu with commonly used third-party libraries.
Plotly
Plotly.newPlot(container, boxplotData, layout);
container.on('plotly_click', function(data) {
  const point = data.points[0];
  const dataPoints = {
    1: point.x,
    2: point.y
  };
  const coordinates = {
    x: data.event.x,
    y: data.event.y
  };
  ZAViz_ActionsAPI.showInteractionMenu(dataPoints, coordinates);
});
Highcharts
point: {
  events: {
    click: function(event) {
      const dataPoints = {
        1: event.point.from,
        2: event.point.to,
        3: event.point.weight
      };
      const coordinates = {
        x: event.chartX,
        y: event.chartY
      };
      ZAViz_ActionsAPI.showInteractionMenu(dataPoints, coordinates);
    }
  }
}
Adding the Plugin
Custom visualizations are added to Zoho Analytics as plugins. Only an Account or Organization Admin can add a plugin.
Before You Begin
Ensure that you have the following ready before uploading the plugin:
- A completed ZAViz_Manifest.json file
- A completed main.js file
- Both files packaged together in a single ZIP file
Steps to Add a Custom Visualization Plugin
- Open the chart builder in Zoho Analytics and click the Plugin icon next to the Chart Type selector.
- Click Add Custom Visuals.
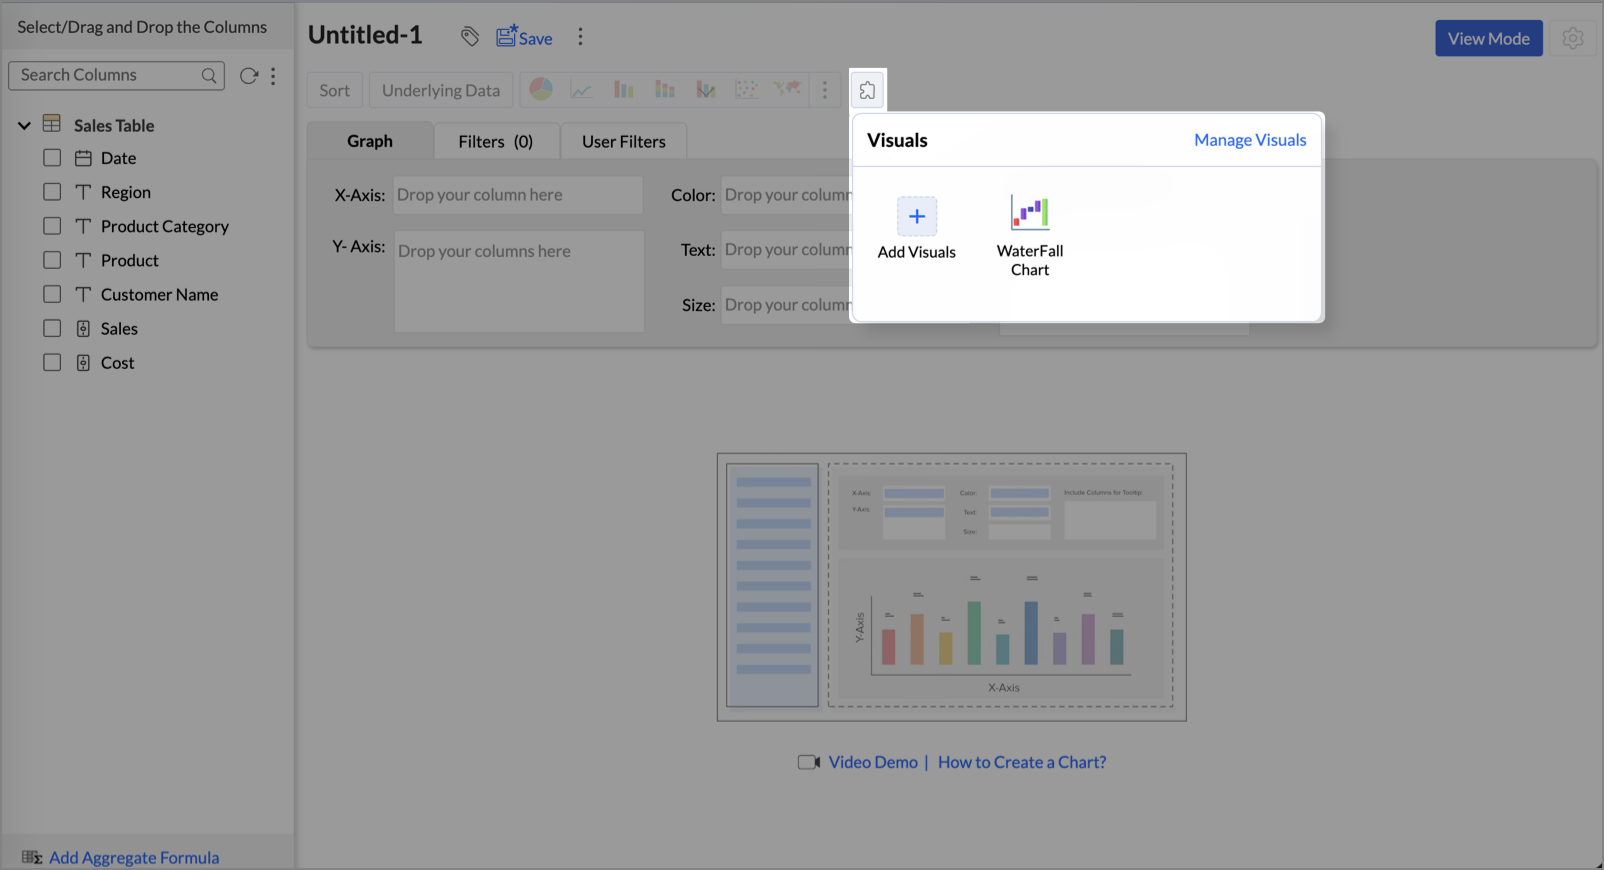
- In the File Explorer, select and upload the ZIP file containing your custom visualization files.
- Once uploaded, the custom visualization appears under the Plugin icon.
- Select the newly added plugin. The drop areas update according to the structure defined in your ZAViz_Manifest.json.
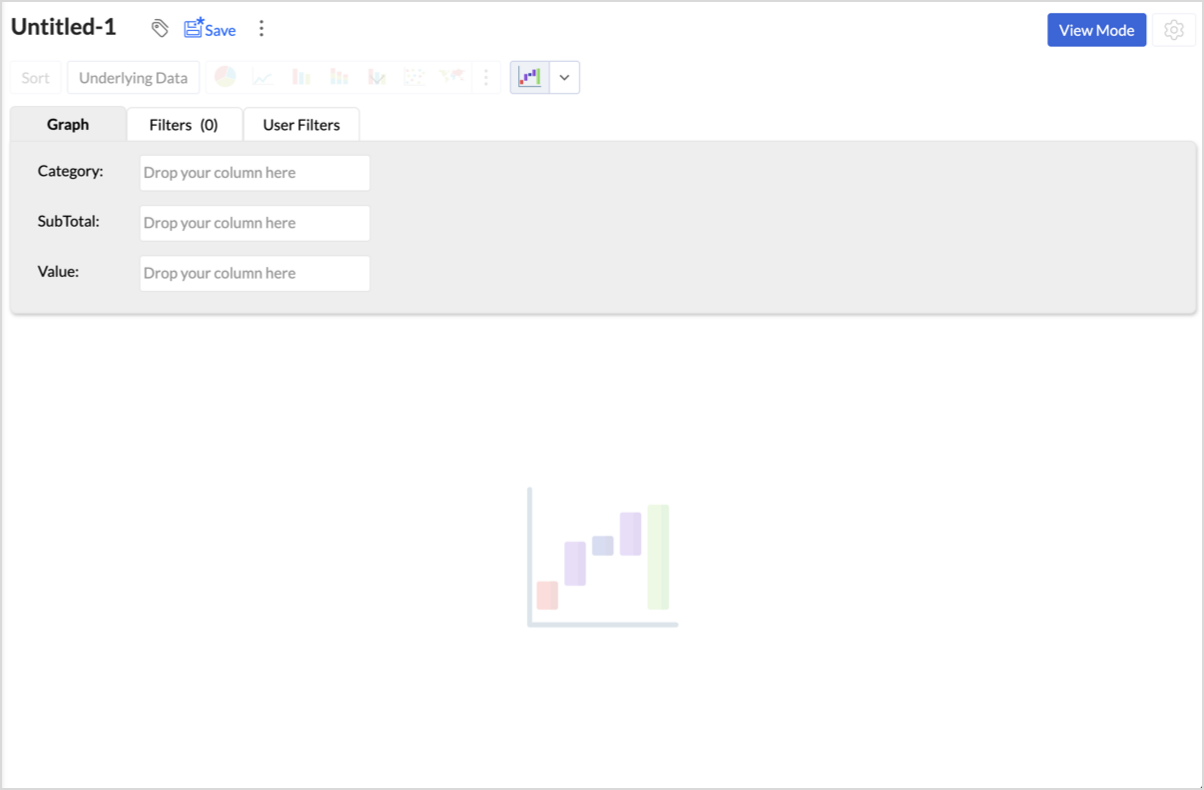
- Drag and drop the required columns into the appropriate drop areas.
- Click Generate Graph to render the custom visualization.


Configuring Settings
After adding a custom visualization, click the Settings icon at the top-right to open the Settings panel.
The panel contains the following tabs:
| Tab | Description |
| General | Contains standard Zoho Analytics formatting options such as Basic, Format, Drill, and Drill Actions. |
| Custom | Contains the user-configurable options defined in the settings property of your ZAViz_Manifest.json. |
| Zia Insights | Contains AI-powered insights options for the visualization. |
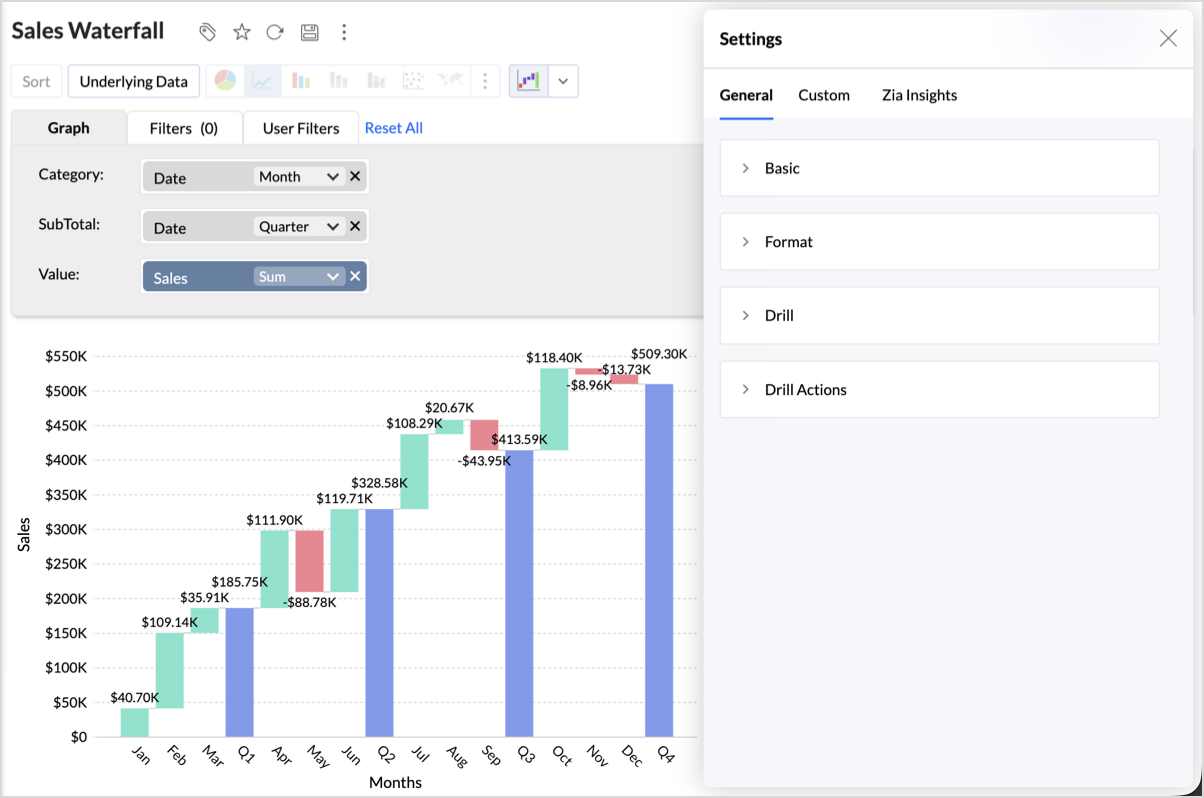
To configure your custom visualization's settings, click the Custom tab. The options defined in your ZAViz_Manifest.json appear here.
Any changes you make are applied to the visualization immediately and passed to your main.js code through the metadata.customSettings object.
Note: The Custom tab appears only if the settings property is defined in your ZAViz_Manifest.json file.
Managing Custom Visualizations
You can manage your uploaded custom visualizations from two entry points:
- From the chart builder - Click the plugin dropdown, then click Manage Visuals in the top-right corner of the Visuals panel.
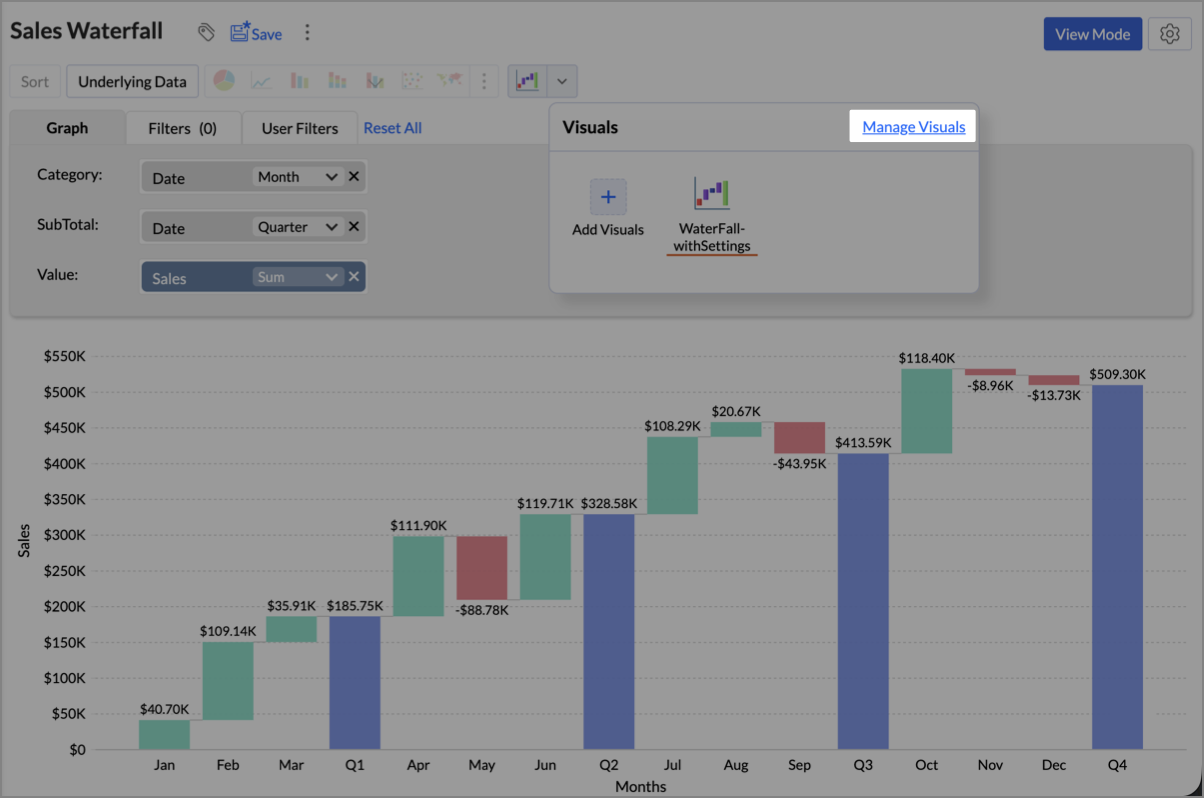
- From Organization Settings - Navigate to Organization Settings > Custom Extensions > Visuals.
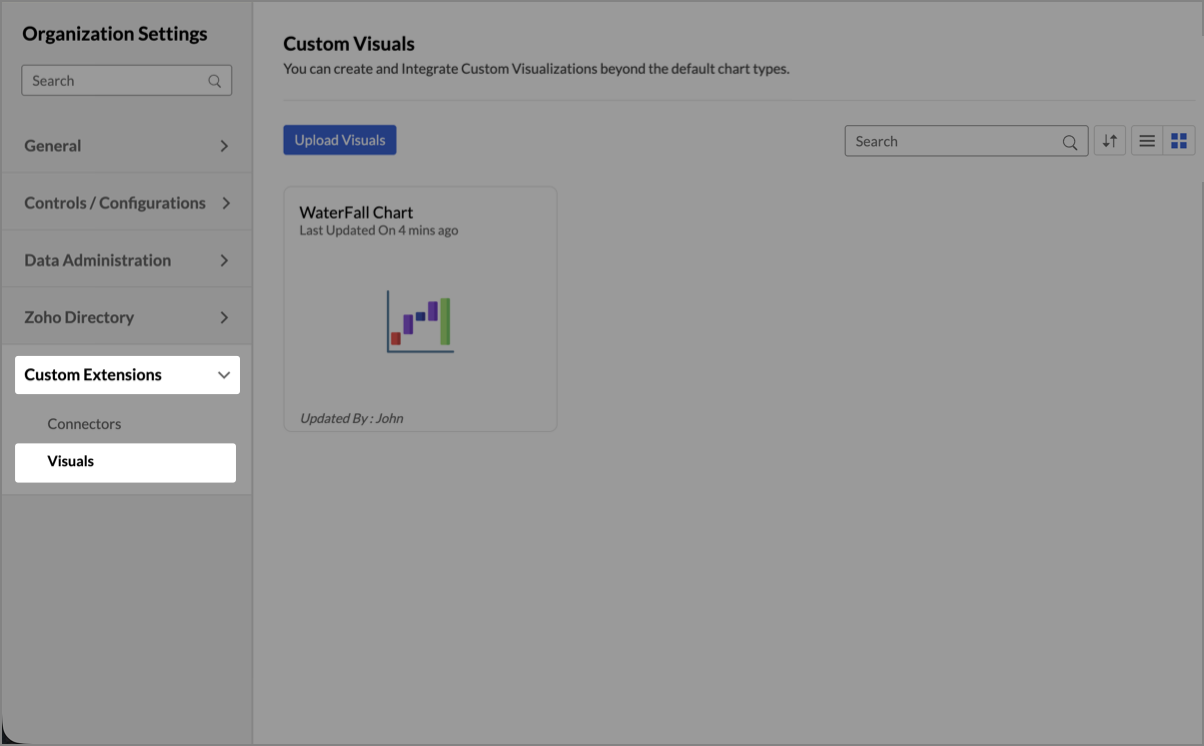


Both entry points open the Custom Visuals management page, where all uploaded visualizations are listed.
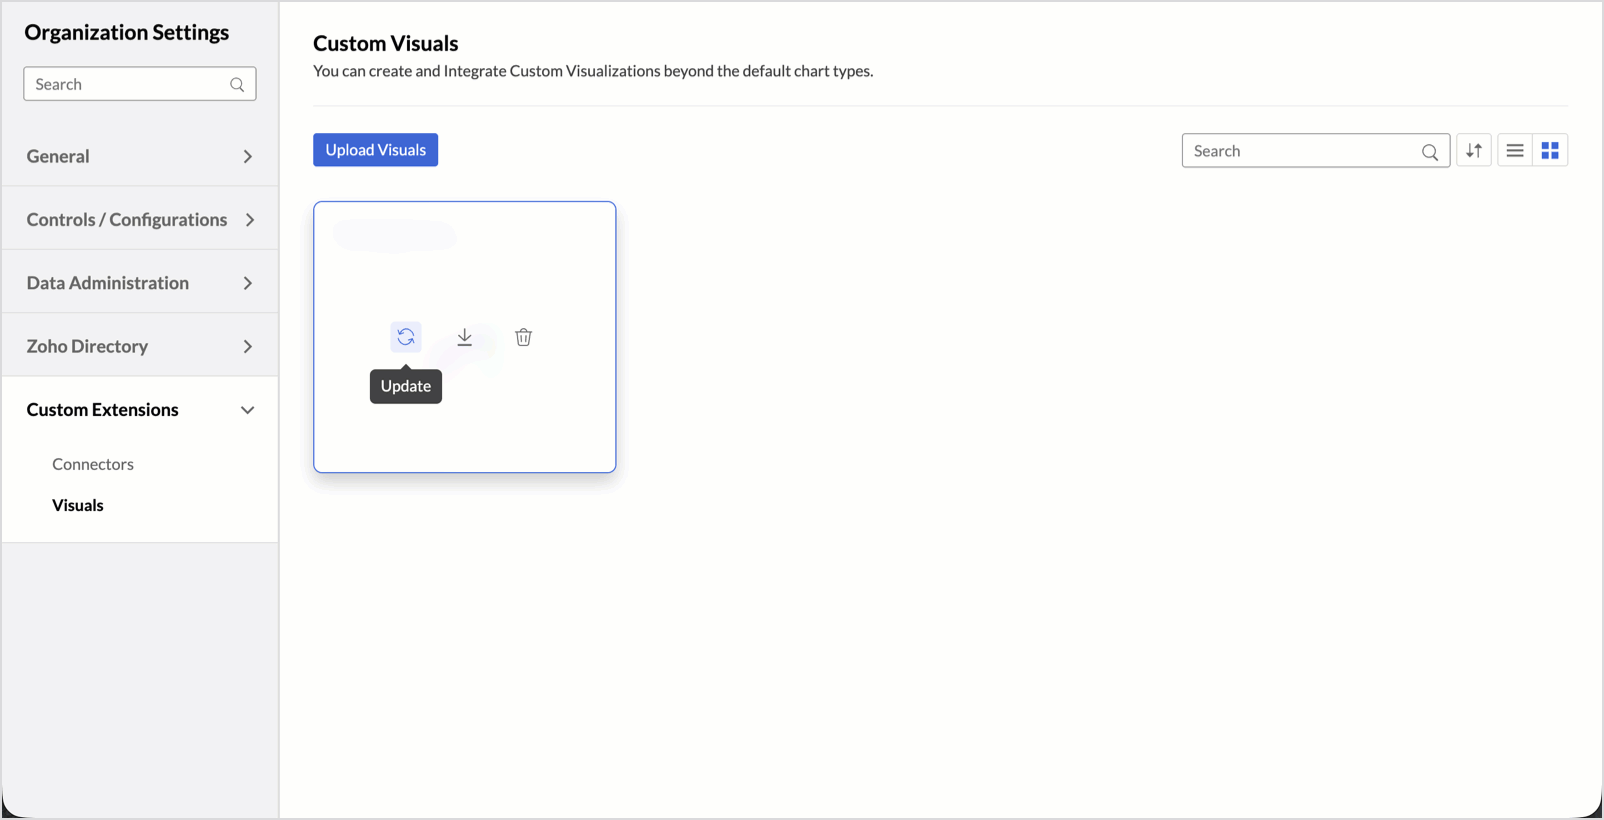
Available Actions
Hover over any custom visualization card to access the following options:
| Action | Description |
| Update | Replace the existing visualization with a new version by uploading an updated ZIP file. |
| Download | Download the ZIP file of the uploaded visualization. |
| Delete | Permanently remove the custom visualization from the workspace. |
Note: You cannot delete a custom visualization that is currently used in a report. To delete it, first remove it from all associated reports. If a report has been deleted, ensure that it is also removed from the Trash before attempting to delete the custom visualization.
Using External Libraries
You can use any third-party JavaScript visualization library in your custom visualization. The following are some of the commonly used libraries:
- D3.js
- Highcharts
- Plotly
- Any other JavaScript visualization library
To use an external library, reference its URL or local file path in the dependencies array of your ZAViz_Manifest.json file.
{
  "dependencies": ["https://cdn.plot.ly/plotly-3.0.0.min.js"]
}
Licensing
When using third-party libraries, ensure that you comply with the library's licensing terms.
Depending on the license:
- Some libraries allow direct downloads and local bundling.
- Others require referencing a hosted URL.
- If the license requires attribution, include it as specified in the library's license documentation.
Note: Zoho Analytics does not validate or enforce third-party library licenses. It is your responsibility to ensure compliance with the applicable licensing terms before using any external library.
Supported Formatting Options
Custom visualizations currently support basic formatting options. To apply advanced formatting, use the JavaScript APIs provided by Zoho Analytics to match your visualization's appearance with Zoho Analytics' data formats and themes.
The following formatting parameters are available:
| Parameter | Description |
| Colors | Control the color scheme of your visualization. Use ZAViz_Utils.getSuitableStyle() to retrieve theme-appropriate colors. |
| Fonts | Configure the font styles used within your visualization. |
| Legends | Customize the appearance and placement of legends. |
| Formatting Parameters | Apply number and date formatting to data values using ZAViz_Utils.getFormattedValue() to ensure consistency with column-level formatting settings. |