Funnel Chart
The Funnel chart is typically used to represent a progressive flow of a business metric, across phases. For example, a sales pipeline progressing from Evaluation - Initial Offering - Quote/Negotiation - Closed Lost - Closed Won. Or a marketing funnel progressing from Visitors - Signups - Abandoned Cart - Purchases.
Creating a Funnel Chart
Zoho Analytics supports the following types of Funnel Chart.
Single Series Chart
You can create a Funnel Chart for a single metric in the Y-axis, grouped by a single dimension in the X-axis. Follow the below steps to create a single series funnel chart.
- Open the chart editor. Drop the columns as given below.
- X-Axis shelf - Drop the dimension column (usually a text column)
- Y-Axis shelf - Drop the metric or aggregate column (usually a numeric or currency column)
- Click the Click here to Generate Graph button. A single series bar will be created.
- Change the chart type to Funnel.
The following animation illustrates how to create a funnel chart, showing the Sales Pipeline.
Multi-Series Chart
You can create a funnel chart comparing multiple metrics (Multi Y-axes). Each slice (component) of the funnel represents one Y-axis metric. Follow the below steps to create a multi-series funnel chart.
- Open the chart editor.
- Drop multiple metric (aggregate) columns in the Y-axis shelf
- Click the Click here to Generate Graph button. A pie chart will be created.
- Change the chart type to Funnel.
The following animation illustrates how to create a funnel chart, showing Leads - Converted and Won.
Customizing Funnel Chart
Zoho Analytics provides a wide range of customization options for Charts. This section explains customization options for the funnel chart. Refer here for more on chart customization options in general.
Follow the below steps to customize a Funnel Chart.
- Open the funnel chart.
- Click the Settings icon. The Settings page will open. Available customizing options are:
Show Data Label
Show Data Label section allows you to add a chart label. You can add the following as the data label.
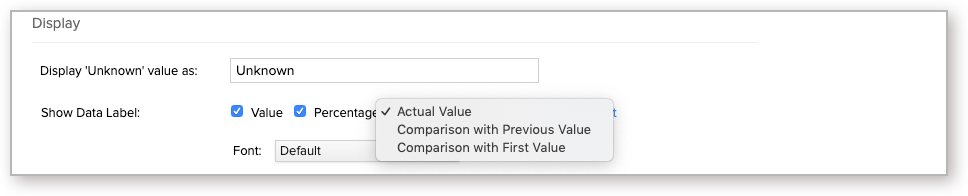
- Value - Select this checkbox to add Y-Axes values as the label.
- Percentage - Select this checkbox to add Y-Axes percentages as the label
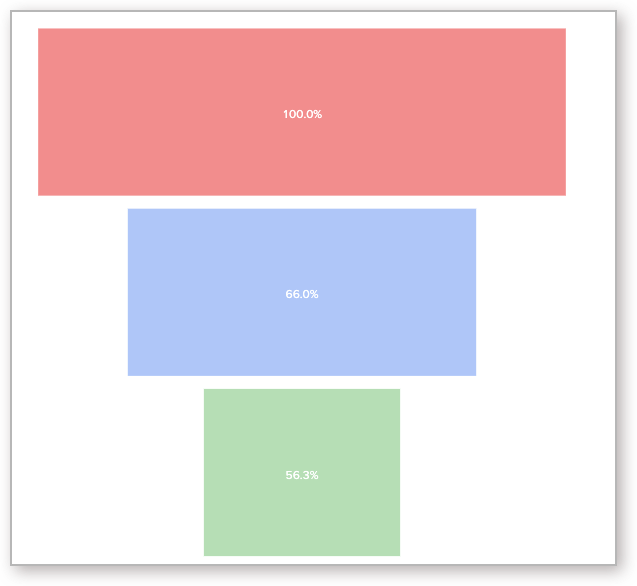
- Actual Value - Choose this to add the percentage of each slice as the label.
- Comparison with Previous Value - Choose this to add the percentage in comparison with the previous slice value as the label.
- Comparison with first Value - Choose this to add the percentage in comparison with the first slice value as the label.
You could choose to add both Value and Percentage in the chart. You can also remove the chart label by unselecting these checkboxes.
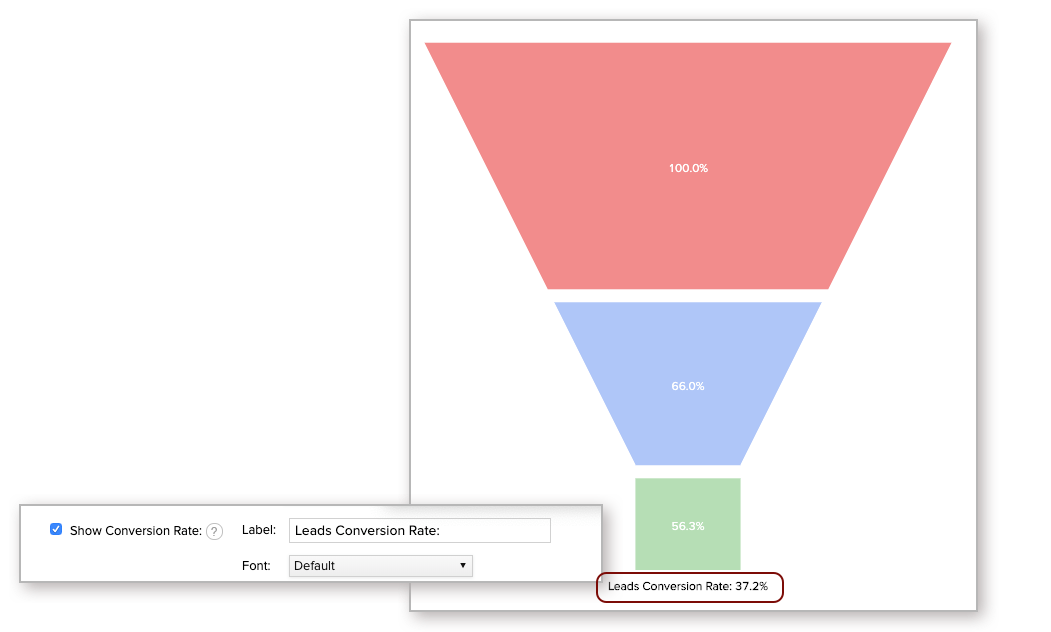
Show Conversion Rate
Select this to display the conversion rate of the funnel in percentage, by comparing the value of the last slice with the first slice in the funnel.
Funnel Design
Zoho Analytics supports the following funnel design.
- Weighted Height - The height of each slice will be proportional to the data value.
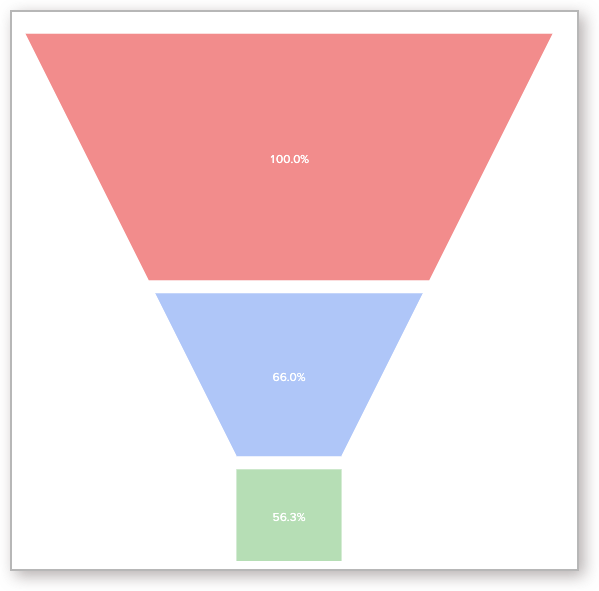
- Uniform Height - Each slice will be in uniform height.
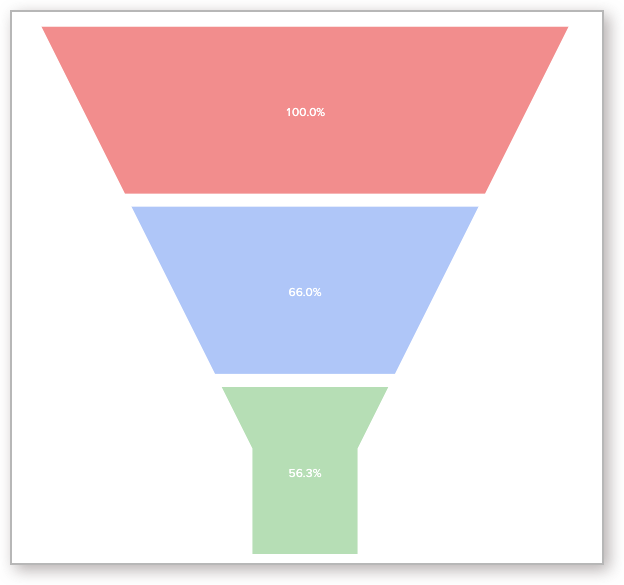
- Weighted Width - The width of each slice will be proportional to the data value.


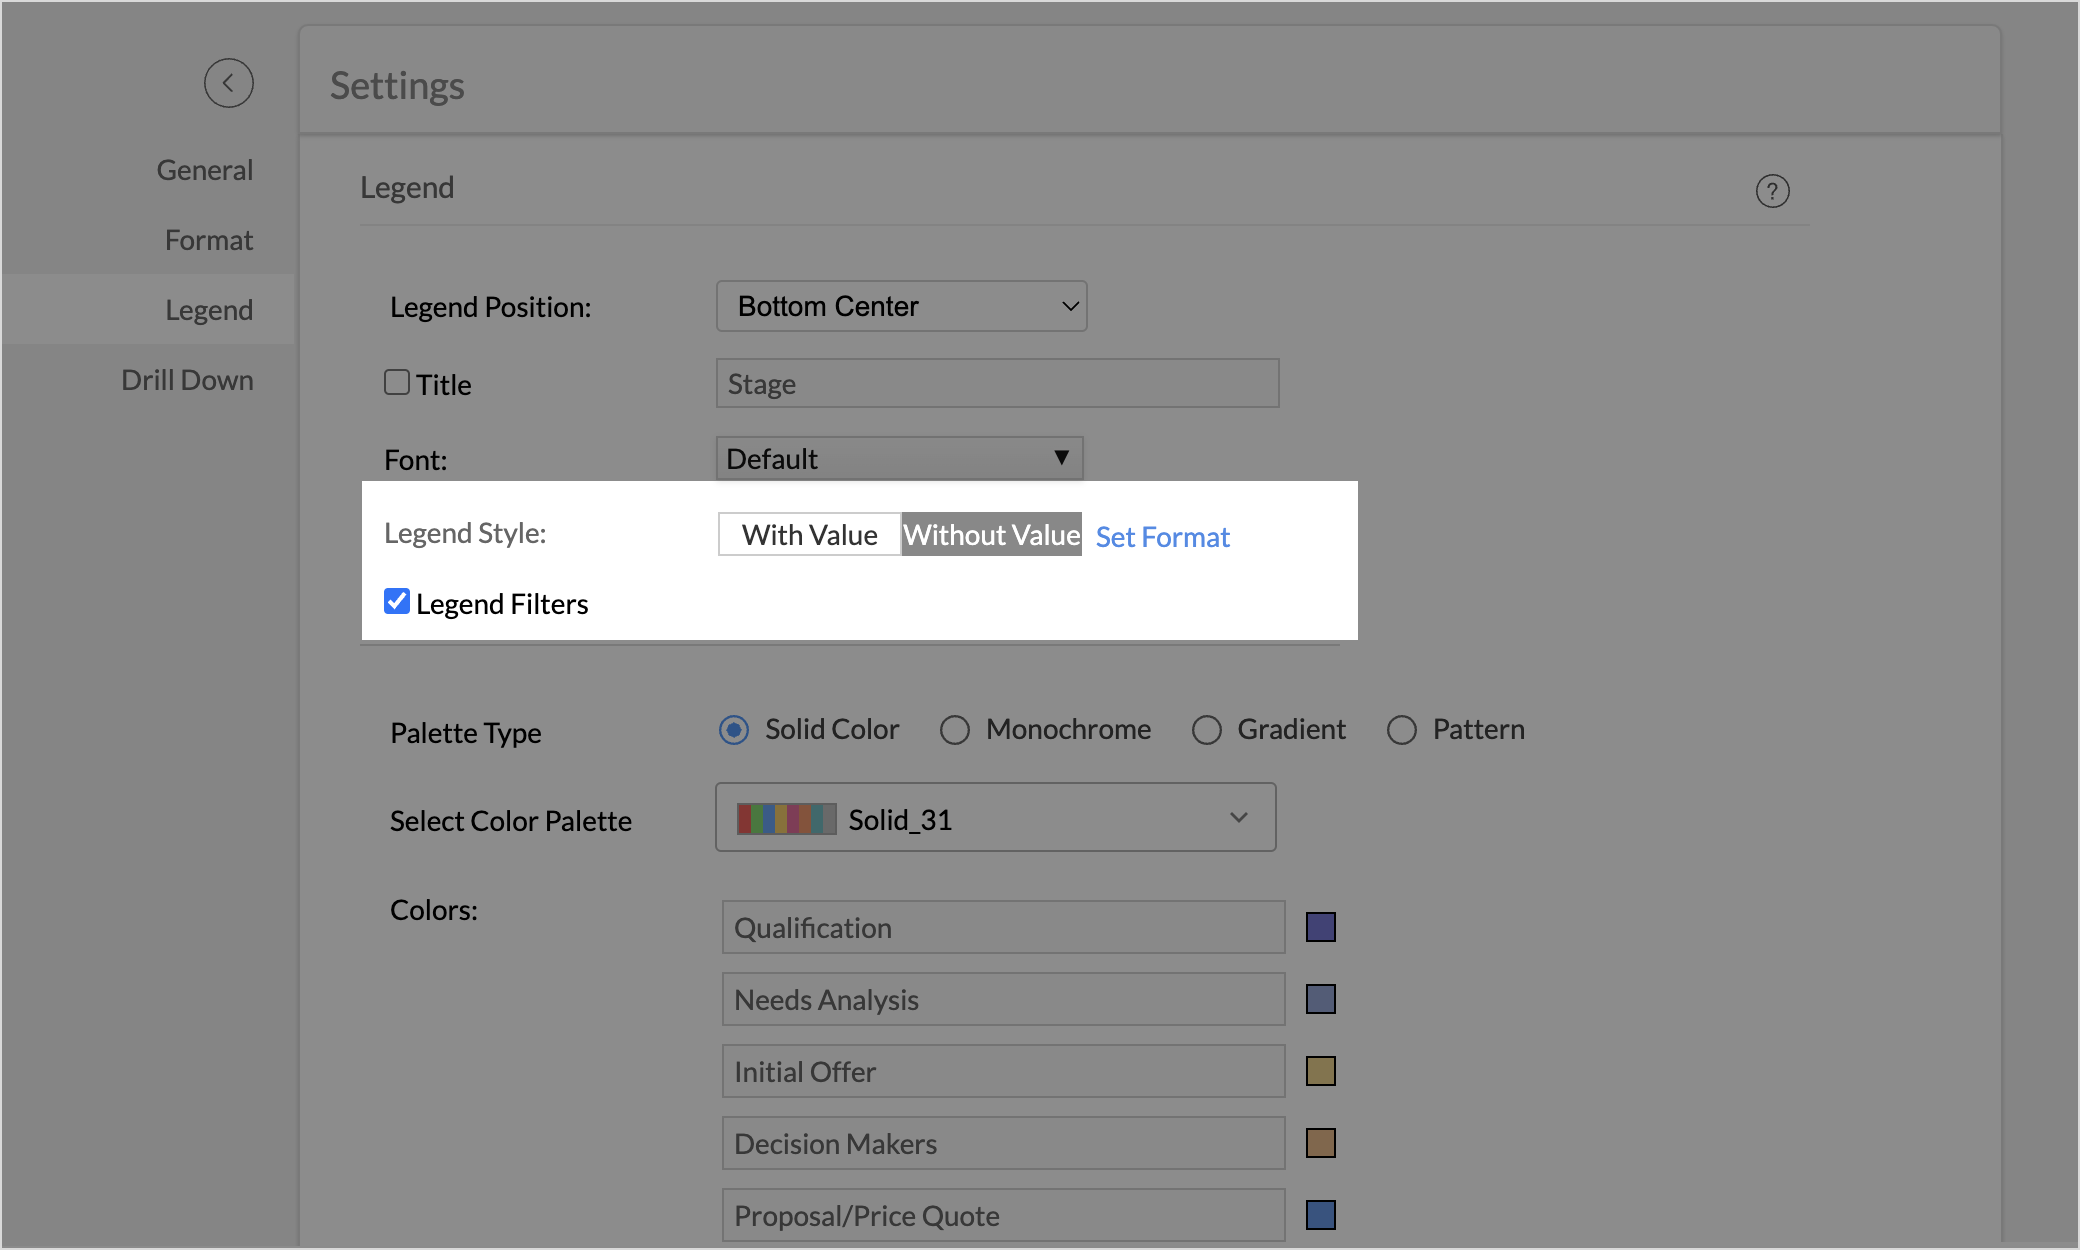
Legend Value
You can choose to display the legend items with or without the corresponding values. You can also customize the format to display data using the Format link.
Possible combinations for creating Funnel Charts
The following combinations of column types are possible when creating Funnel charts.
| X-axis | Y-axis | Color | Text | Tooltip | |
| Case 1 | Dimension | Aggregate | -- | Aggregate/ Measure/ Optional | Aggregate/ Measure/ Optional |
| Case 2 | Optional | Multiple Aggregate | -- | Aggregate/ Measure/ Optional | Aggregate/ Measure/ Optional |
- Dimension: Usually, it is a column with Text values. If it is a numeric column, Actual Value function is applied over it. The Actual Value will further be divided into Actual Measure, Actual Dimension, and Actual Range, from which you can choose the appropriate function.
- Aggregate: A numeric or currency column with an aggregate function (sum, average, count, etc) applied over it. This also includes the aggregate formula columns.