Trend Line
Trend Lines are used to identify the trend present in your data. Zoho Analytics can plot the past & future trends in your time series or number series data. Zoho Analytics provides five such models to derive the Trend Line.
- What are Trend Lines?
- How are Trend Lines derived?
- What are the models supported in Zoho Analytics for predicting the Trend line?
- What are the chart types that support Trend Line?
- Who can add a Trend Line for the chart?
- What is the prerequisite to add a Trend Line in a chart?
- How to add a Trend Line for my chart?
- Can I view how my Trend Line model is applied?
- Can I set up a Trend Line for forecasted data?
- What is Confidence Line and how do I add this for my Trend Line?
- Can I set up a Trend Line over multiple Y-Axes?
- Can I set up a Trend Line over a chart with legend?
- Trend Line option is not available in my chart, why?
- Can my Shared Users view the Trend Line?
- Can I Export Trend Line data?
1. What are Trend Lines?
Trend Line are used to identify the trends present in your data. Zoho Analytics predicts the Trend line for data in time or number series.
2. How are Trend Lines derived?
Trend Lines can be derived based on various mathematical models. Zoho Analytics provides five models to derive the Trend line. They are Linear, Logarithmic, Exponential, Power, and Polynomial.
- Based on the model selected, along with the data from the chart, possible trend values will be predicted.
- Error square will be identified by calculating the square of the difference between the actual Y and predicted trend Y value.
- The above process will be repeated by changing the parameters and checking whether the error square is reduced.
- The Trend Line will be plotted with the value where the error square is the least.
3. What are the models supported in Zoho Analytics for predicting the Trend line?
Zoho Analytics supports the following models to predict the Trend Line.
- Linear - Choose to apply a Linear model to derive the Trend Line.
- Logarithmic - Choose this to apply a Logarithmic model to derive the Trend Line. Not best suited if data points have negative values.
- Exponential - Chose this to apply an Exponential model to derive the Trend Line.
- Power - Chose this to apply a Power factor model to derive the Trend Line. This is another form of Exponential model where the natural log is applied on factors before applying exponential.
- Polynomial - Chose to apply a Polynomial model to derive the Trend Line. The degree value provided is used to derive a polynomial series for the specified degree.
- Auto - Choose this to allow Zoho Analytics to select the best Trend Line model based on the given data points.
4. What are the chart types that support the Trend Line?
The following chart types support Trend Line.
- Line Chart
- Bar Chart
- Stacked Bar Chart
- Scatter Chart
- Area Chart
- Stacked Area Chart
- Bubble Chart (not Bubble Pie and Packed Bubble)
- Combo Charts
5. Who can add a Trend Line for the chart?
Trend Line is available in all plans of Zoho Analytics including the free plan.
Users who can create the chart can add a Trend line for the chart.
6. What is the Prerequisite to add a Trend Line in the chart?
The following are the prerequisites to add a Trend Line in the chart.
- The X-Axis should have a Time, Date, or Number series.
- The Y-Axis should have one or more aggregate columns or a single measure column.
7. How to add a Trend Line for my chart?
8. Can I view how my Trend Line model is applied?
Yes, you can view how the Trend Line model is applied over your chart. To view the information, click the info icon in the Trend Line legend.
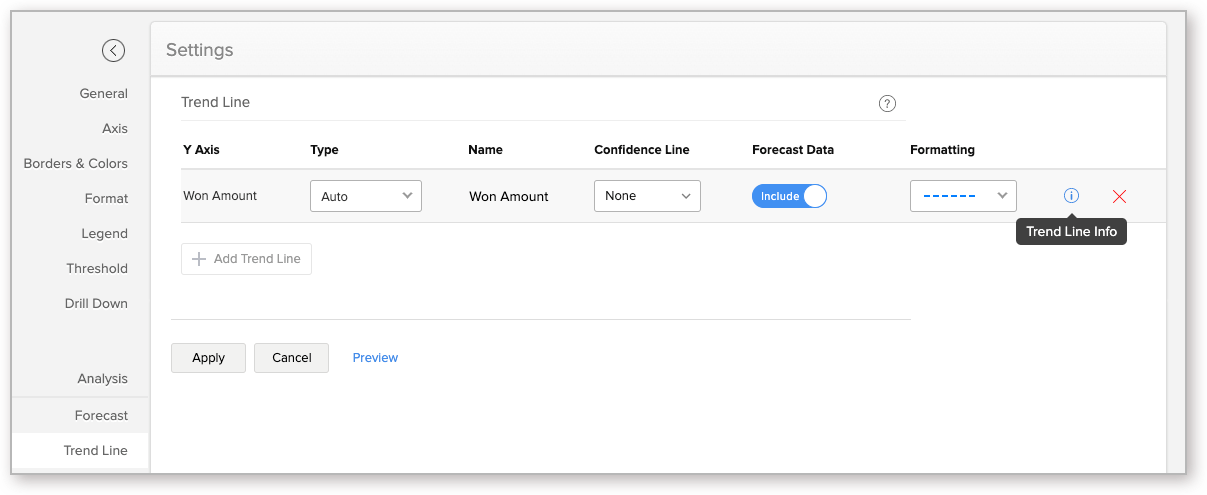
You can also view the Trend Line model from the Settings page. Open the Trend Line tab and click the info icon.
The Trend Line Model dialog will open displaying the following information.
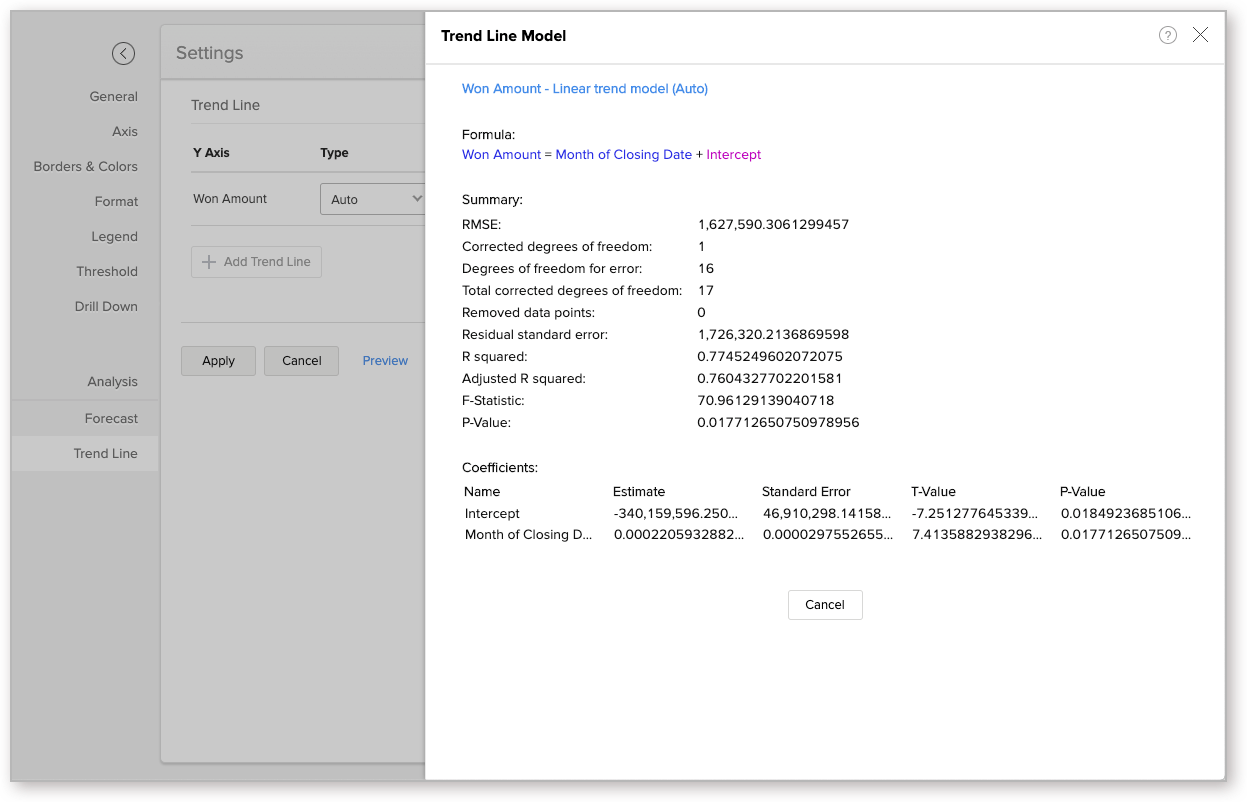
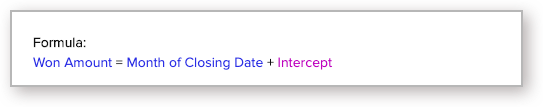
Formula
This section displays the formula applied over the chart to drive the Trend Line.
Model Summary
This section displays the model summary.
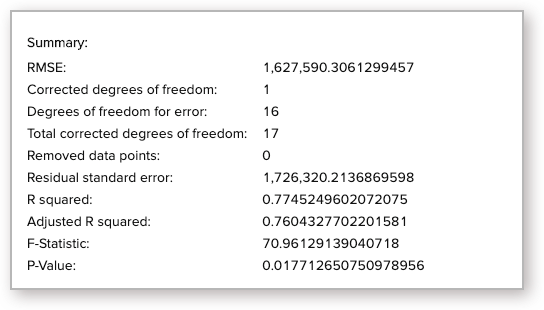
- RMSE - Root Mean Square Error shows how concentrated the data is around the Trend Line. To calculate this, the error2 will be divided by the Mean and then the square root of the result will be calculated.
- Corrected degrees of freedom - This displays the number of coefficients minus 1. The value will be 1 for all models except for Polynomial.
- Degrees of freedom for error - This displays the number of data points that are included in calculating the Trend Line minus the number of coefficients.
- Total corrected degrees of freedom - This displays the number of data points that are included in calculating the Trend Line minus 1.
- Removed data points - Number of data points that are eliminated while calculating the Trend Line. Avoid using a model that discards more data points unless you know that they are invalid.
- Residual standard error - Here error2 will be divided by the corrected degrees of freedom.
- R squared - This indicates how better the trend fits in the model. A line for the average of the data will be plotted. The average is divided by the error2. If the result is approximately equal to 1, then the data fits the model.
- Adjusted R squared - This ensures that the model does not overfit. This reduces the metric by the number of parameters in the model. If the result is approximately equal to 1, then the data fits the model.
- F-Statistic - This shows how far the X value influences the trend. The higher the value the more X value contributes to the trend.
- P-Value - This shows the probability of the estimator not contributing for the data. This indicated the significance of the Coefficients. The smaller the p-value, the more significant the model is.
Coefficients
This section displays the significance of the Coefficients.
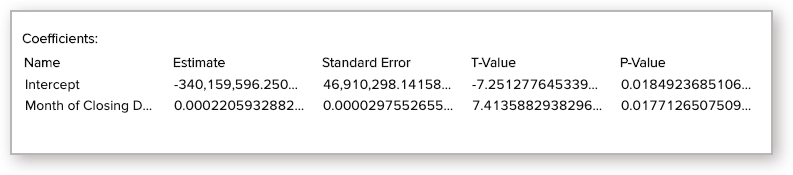
- Name - Name of the components.
- Estimate - The estimated value of the coefficient for the corresponding components.
- Standard Error - This shows the possibility of error for the coefficient.
- T-Value - This shows the estimated value divided by the Standard Error. A higher value indicates how better the model fits.
- P-Value - This indicates how helpful the corresponding parameter is in creating the model.
9. Can I set up a Trend Line for forecasted data?
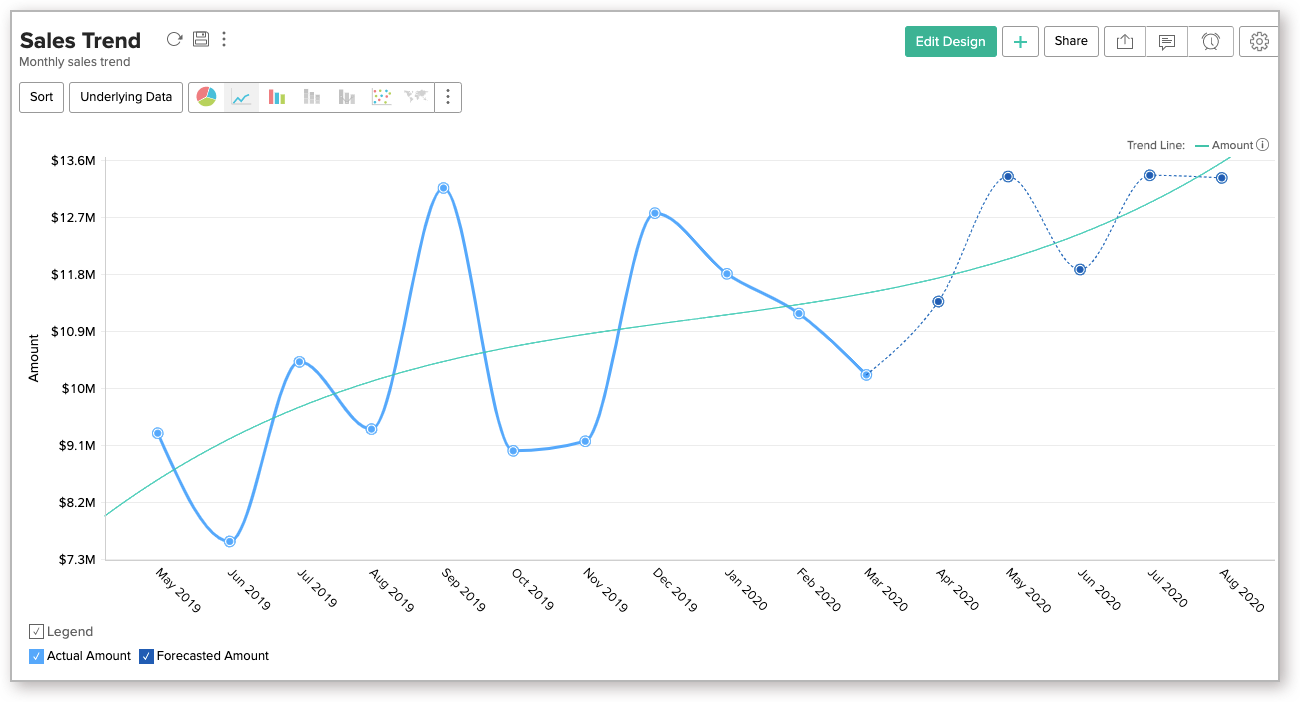
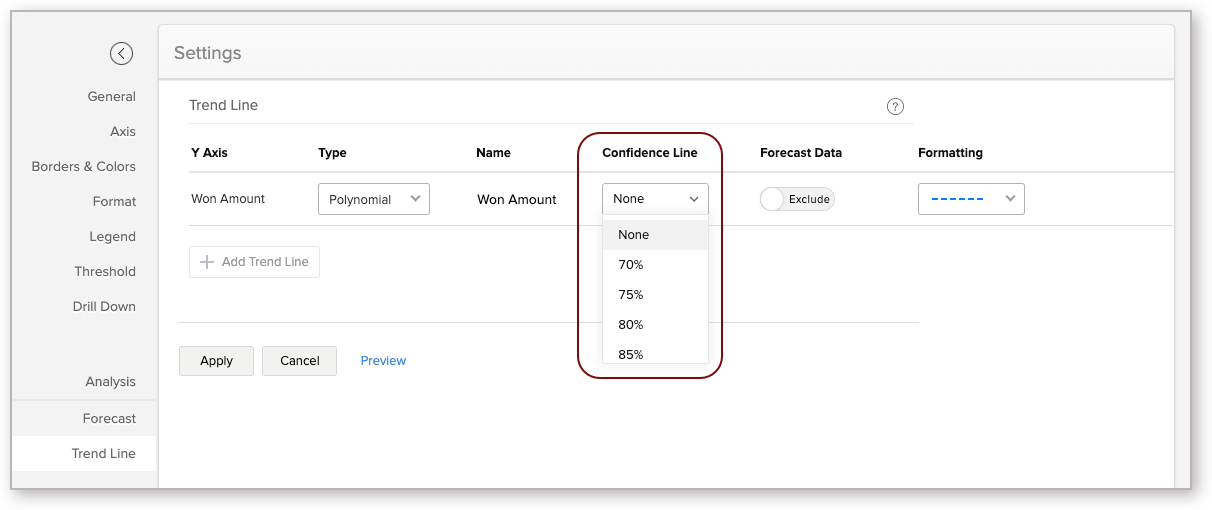
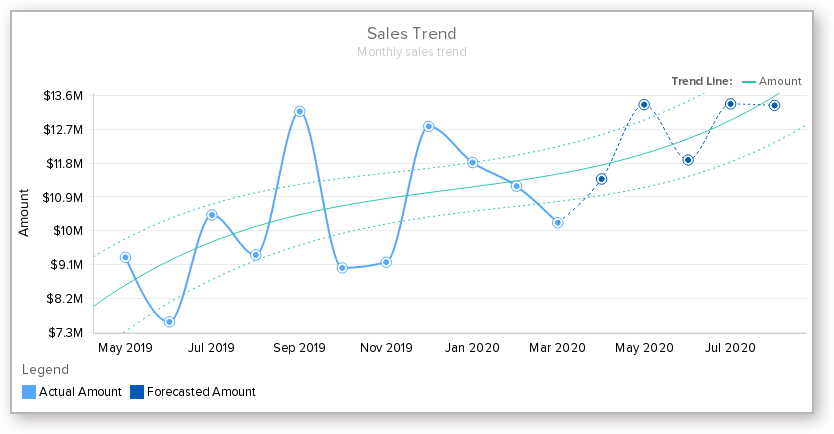
Yes, you can predict the Trend Line for forecasted data. To include trend line for forecasted data for Trend Line calculation, set the Forecast Data toggle button as Include.
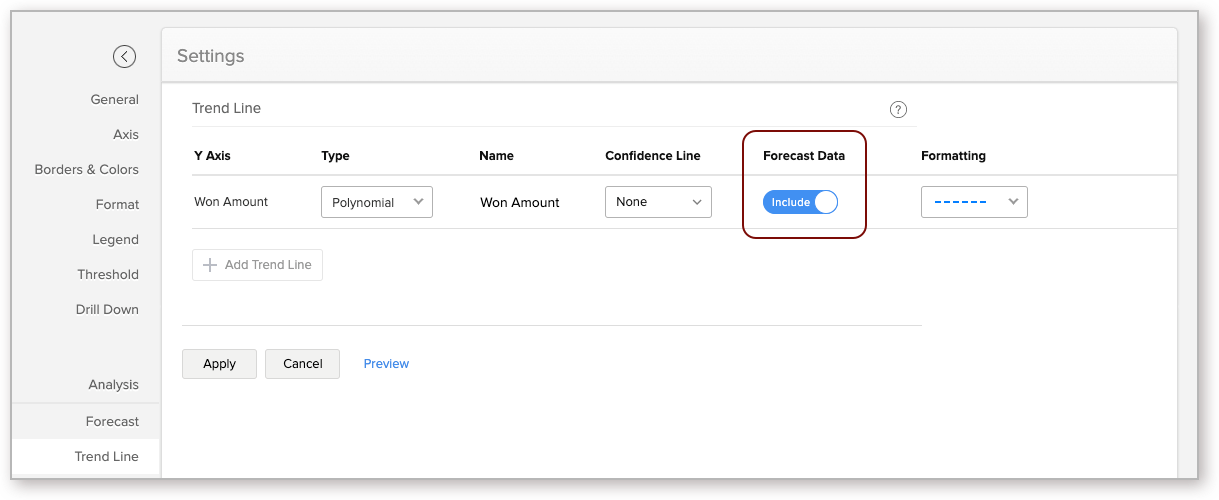
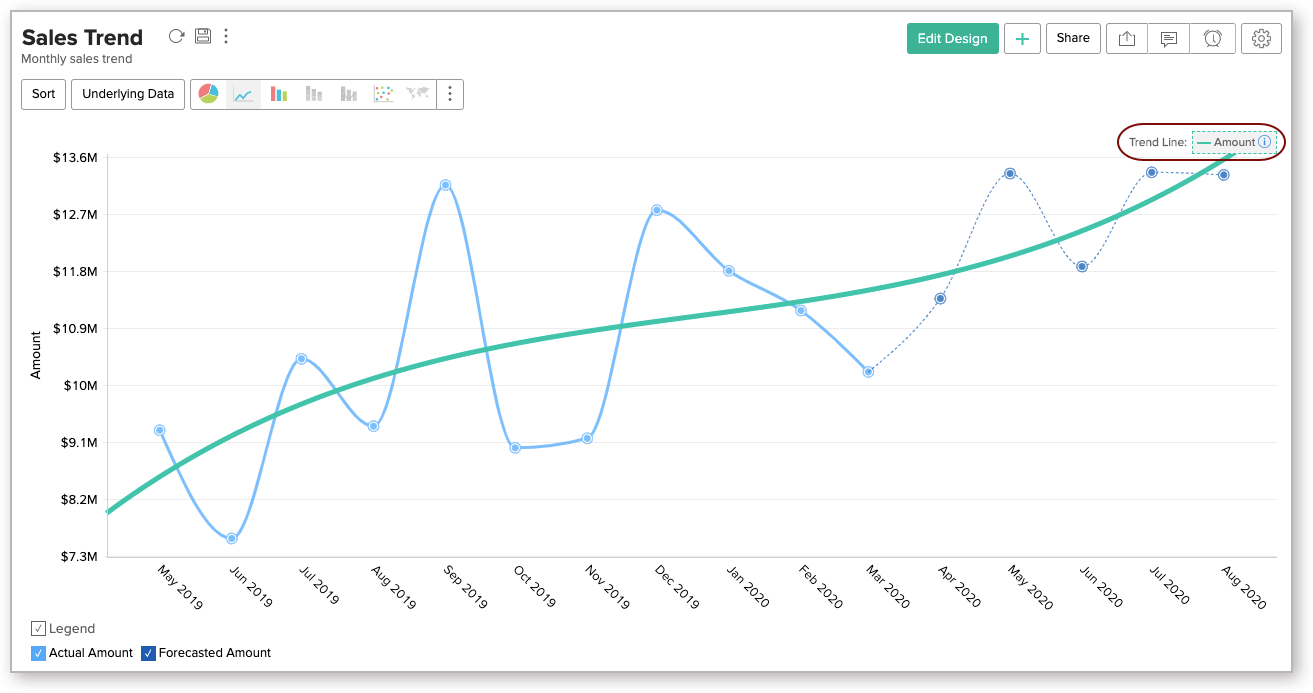
The following illustration shows the Trend Line for forecasted data.
10. What is Confidence Line and how do I add this for my Trend line?
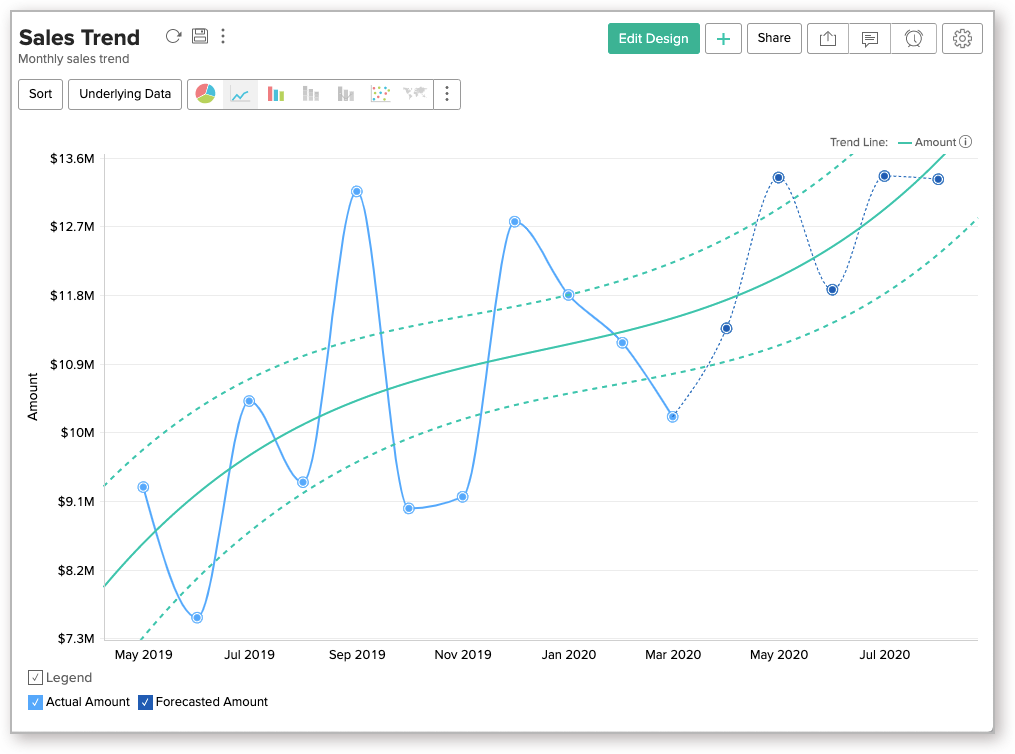
The Confidence Line predicts what the Trend Line can be for a similar data set for the given probability. You can select the probability range in the Confidence Line from 70% to 95%.
The below chart is drawn with a 90% confidence range. i.e., when you change the underlying data with a similar data set (populated with the same conditions), then the Trend Line will be 90% within this Confidence Line.
11. Can I set up a Trend Line over multiple Y-Axes?
Yes, you can plot the trend for a chart with multiple aggregate columns in Y-Axes. The Trend Line can be drawn up to 5 Y-Axes.
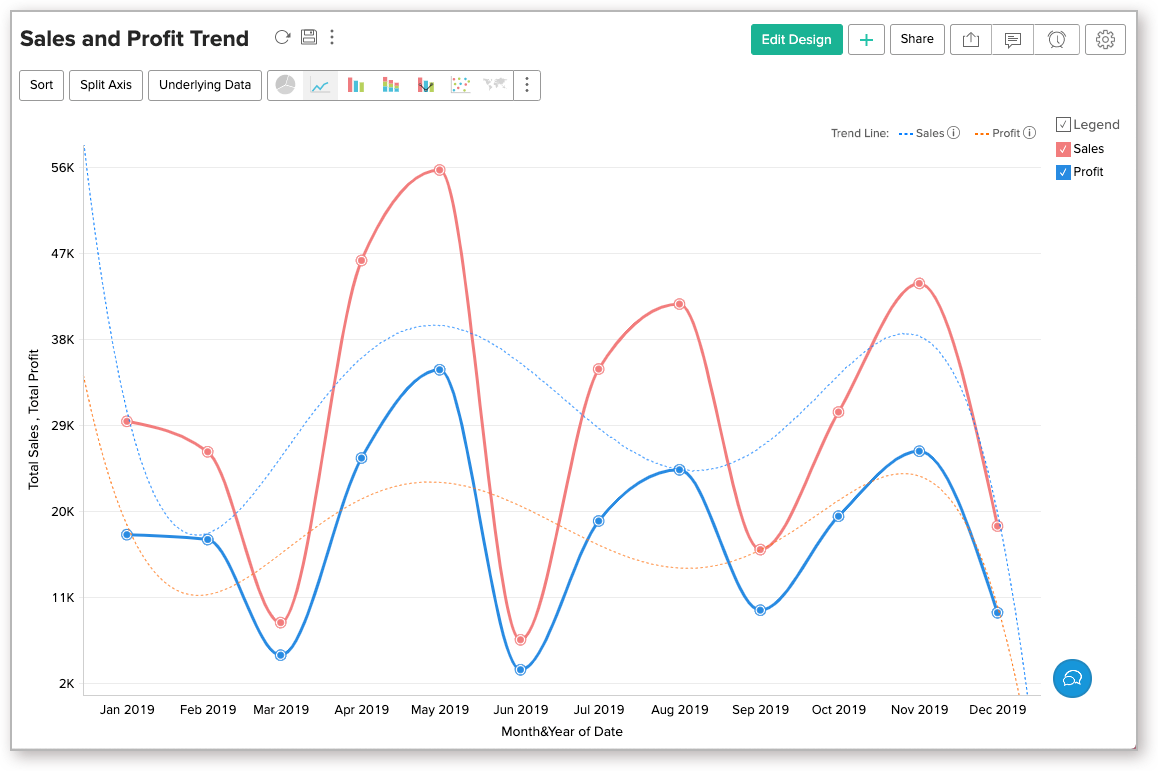
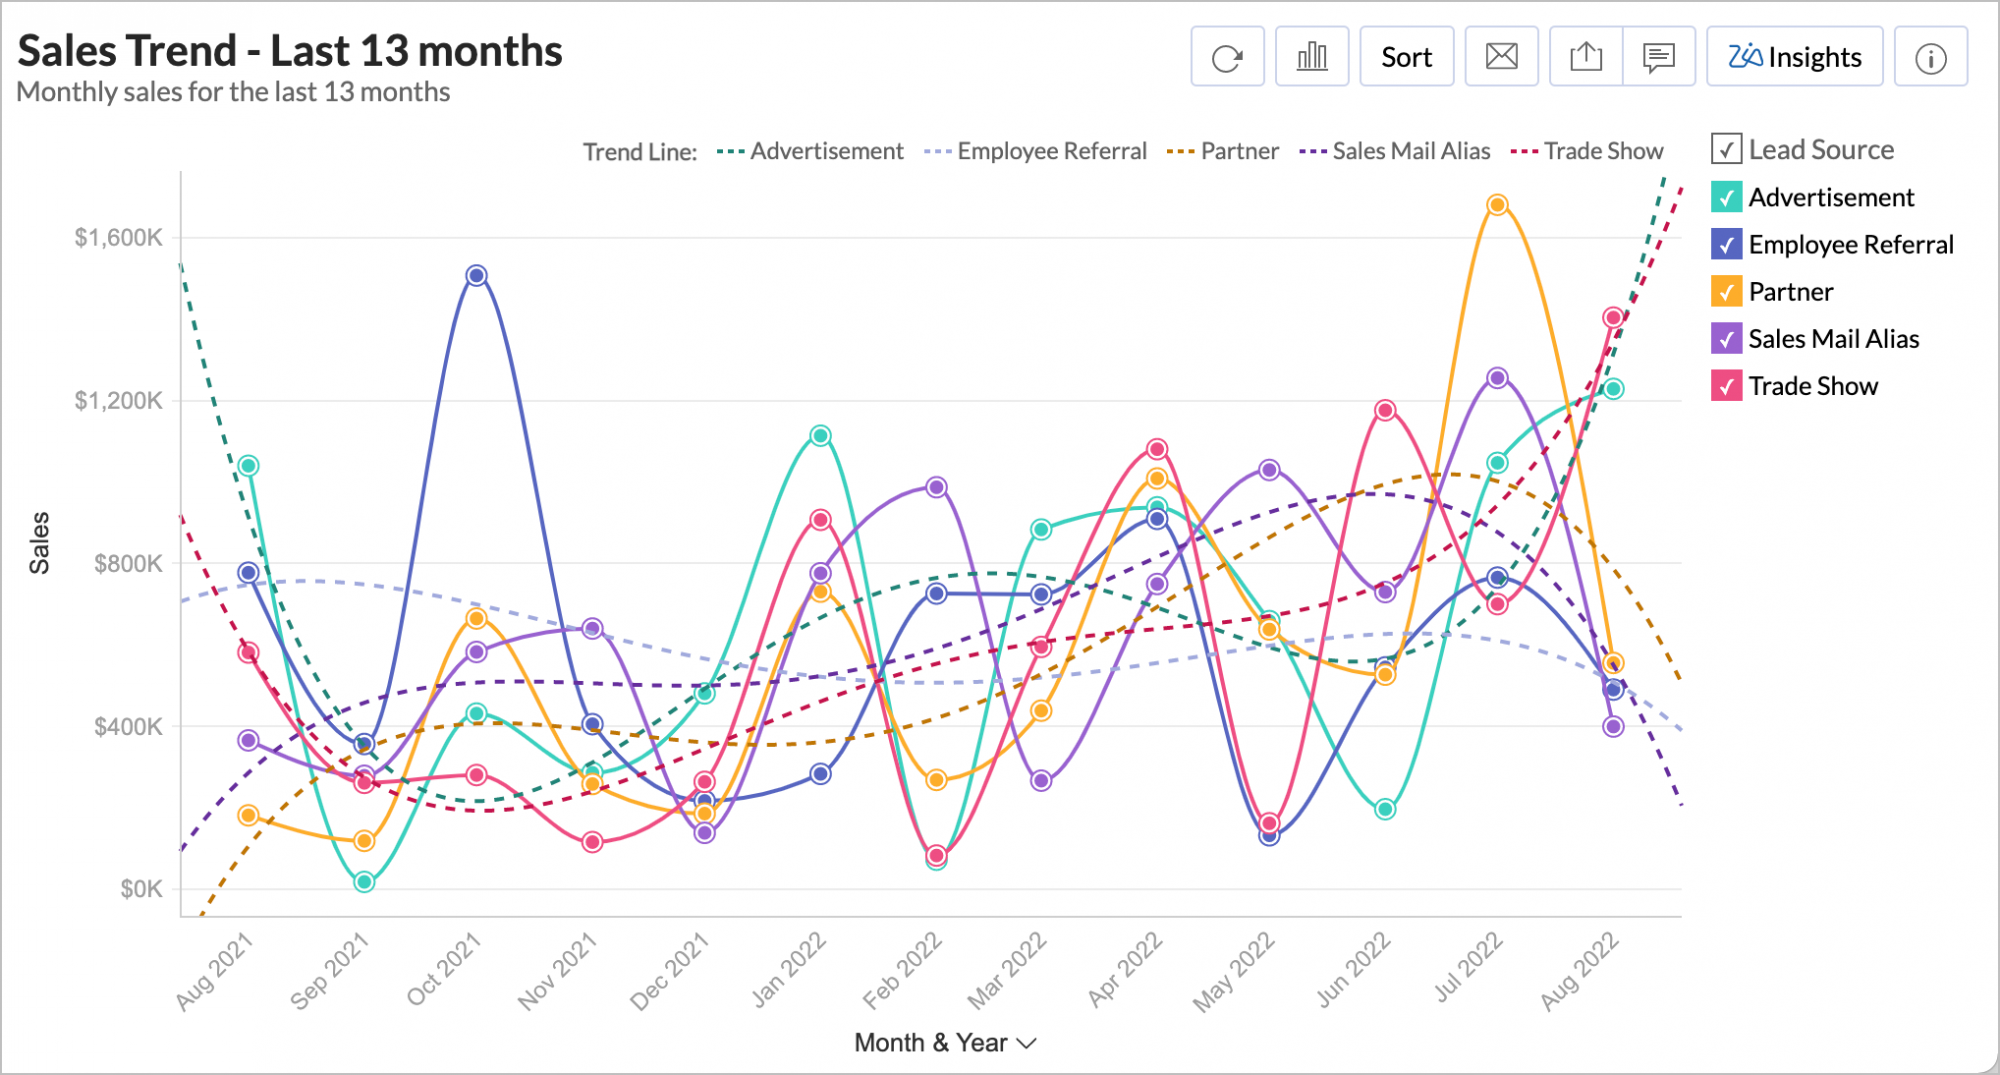
12. Can I set up a Trend Line over a chart with legend?
Yes, you can plot the trend for a chart with legend.
13. Trend Line option is not available in my chart, why?
The Trend line will be enabled only when it match the following conditions:
- The chart type should be any one of the following:
- Line Chart, Bar Chart, Stacked Bar Chart, Scatter Chart, Area Chart, Stacked Area Chart, Bubble Chart (not Bubble Pie and Packed Bubble), Combo Charts.
- The X-axis of the chart should be a TIME, Date, or NUMBER series.
- The Chart should have at least one aggregate or measure column in Y-axis.
14. Can my Shared users view the Trend Line?
Yes, shared users can view the Trend Line. They can also view the Trend Line model applied by clicking the info icon in the Legend Title. Shared Users cannot edit the Trend Line.
15. Can I Export Trend Line data?
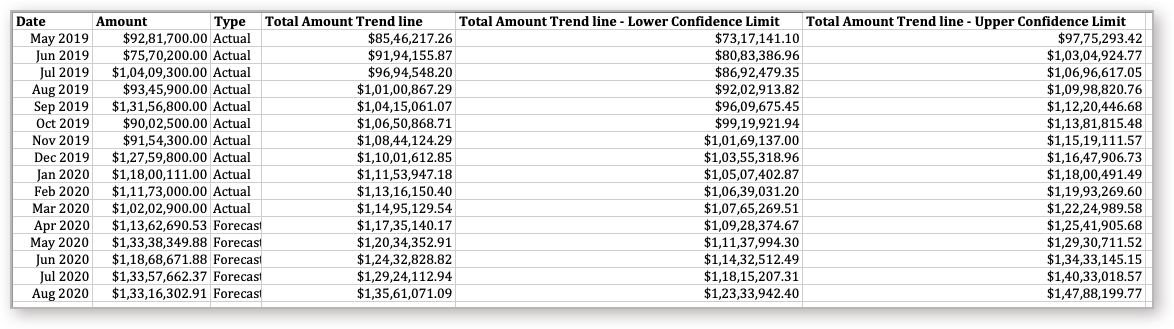
Yes, you can export Trend Line data alone with the chart.
When exporting into a tabular format (CSV, Excel, Zoho Sheet), Trend Line data will be exported as columns.